
Market Overview
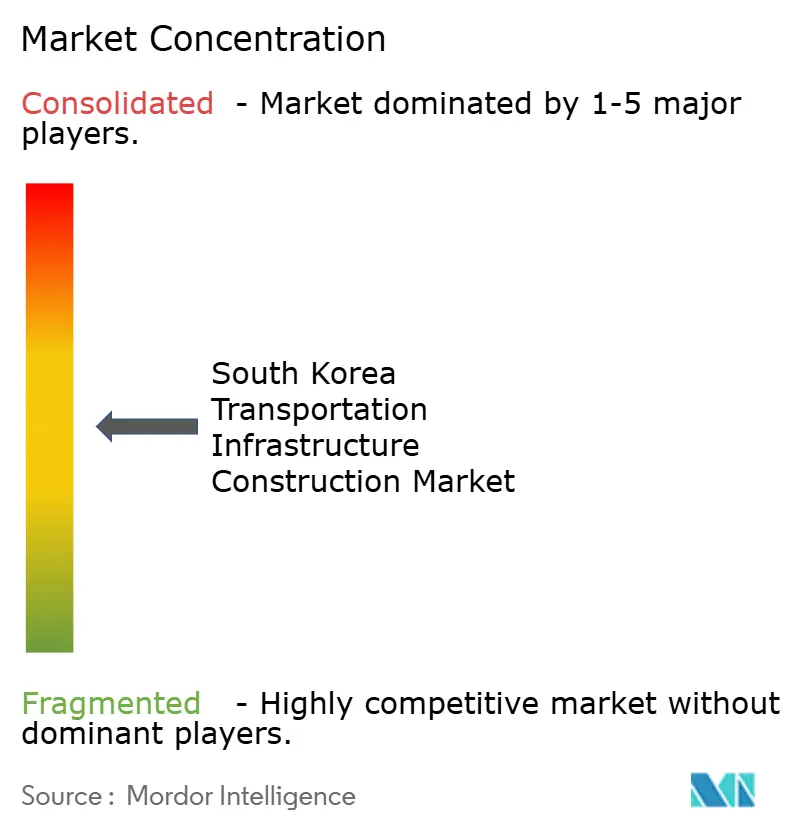
| Study Period | 2020 - 2031 |
|---|---|
| Forecast Data Period | 2026 - 2031 |
| Base Year Market Size (2025) | USD 5.79 Billion |
| Market Size (2026) | USD 5.98 Billion |
| Market Size (2031) | USD 7.04 Billion |
| Growth Rate (2026 - 2031) | 3.32 % |
| Market Concentration | Medium |
Major Players *Disclaimer: Major Players sorted in no particular order Image © Mordor Intelligence. Reuse requires attribution under CC BY 4.0. | |
South Korea Transportation Infrastructure Construction Market Analysis by Mordor Intelligence
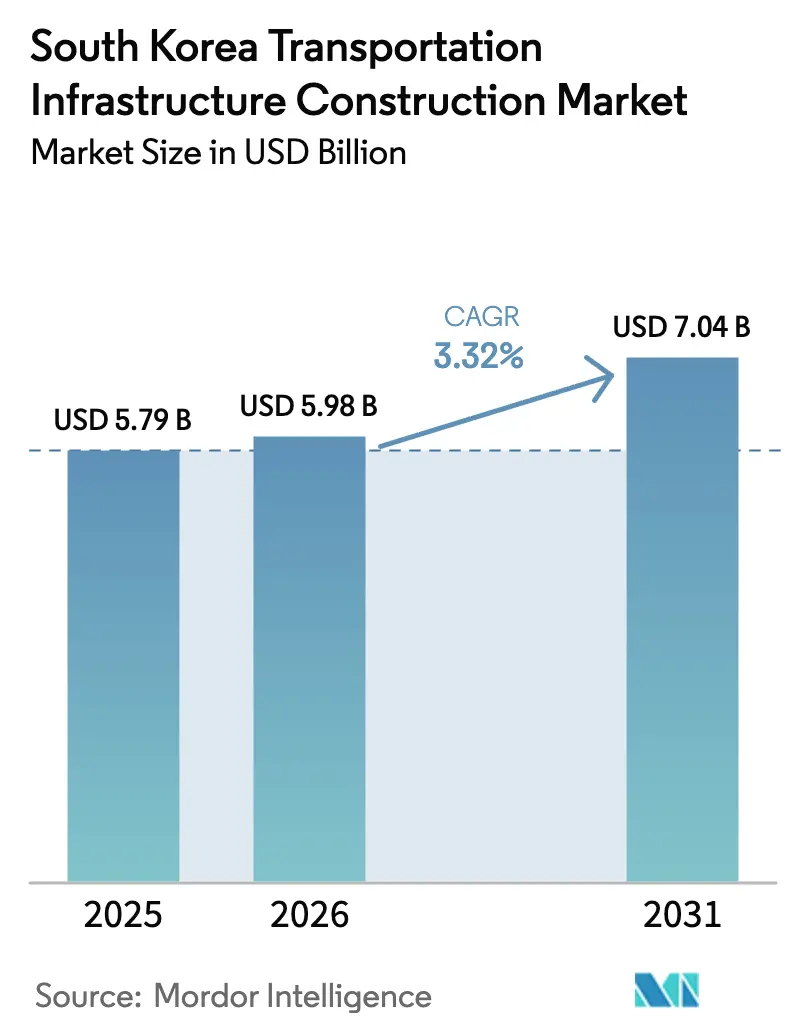
The South Korea transportation infrastructure construction market size was valued at USD 5.79 billion in 2025 and estimated to grow from USD 5.98 billion in 2026 to reach USD 7.04 billion by 2031, at a CAGR of 3.32% during the forecast period (2026-2031). Current growth momentum is anchored in rail electrification, aviation-port modernization, and asset-life extension rather than pure lane-kilometer additions. Capital is shifting toward projects that weave digital twins, automated terminals, and renewable-energy traction into daily operations, reflecting a policy pivot toward carbon-neutral mobility and export-gateway efficiency. Contractors that master modular tunneling and off-site fabrication now out-compete rivals on congested urban work sites where land premiums add 20%–30% to baseline budgets. At the same time, revenue-guarantee mechanisms and land-value-capture instruments are drawing pension funds into blended public-private partnerships, supporting a steady pipeline despite national debt nudging 50% of GDP.
Key Report Takeaways
- By type, roadways led with 49.25% South Korea transportation infrastructure construction market share in 2025, while railways are on track for a 4.05% CAGR through 2031.
- By construction type, new construction captured 66.55% of the South Korean transportation infrastructure construction market size in 2025; renovation is advancing at a 4.35% CAGR to 2031.
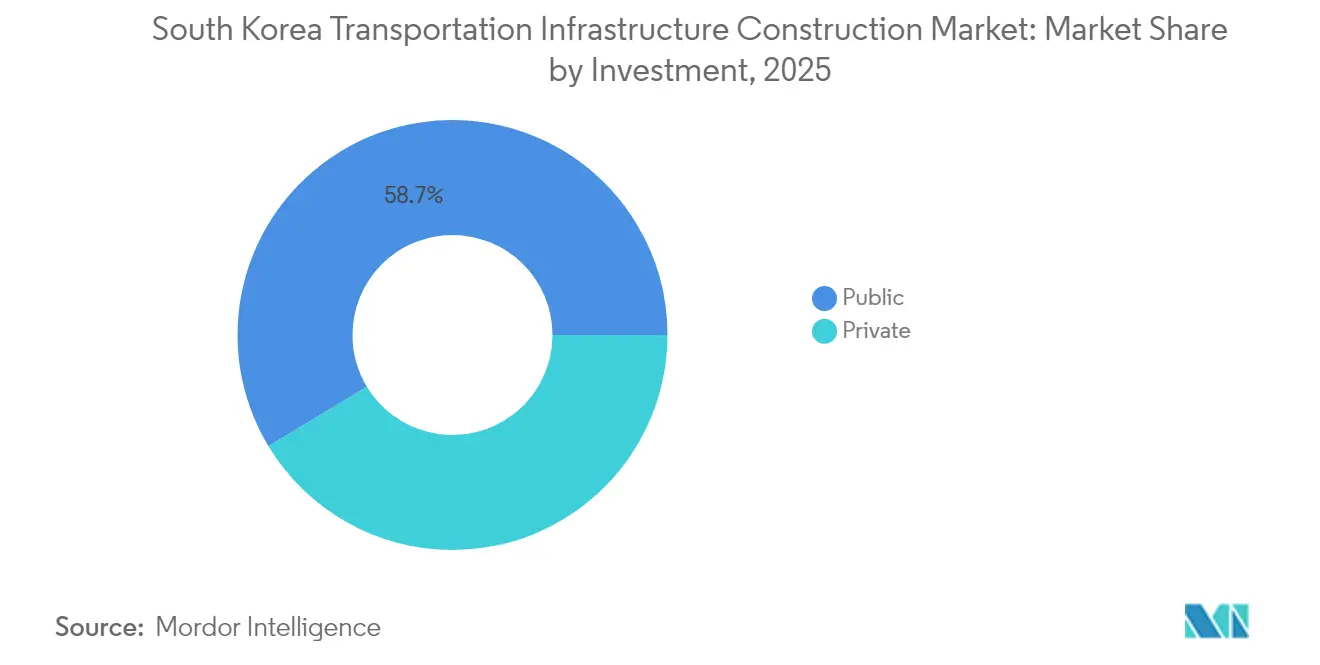
- By investment source, public funding held 58.65% of activity in 2025, whereas private capital is forecast to expand at a 4.65% CAGR through 2031.
- By city, Seoul commanded 38.25% of total spend in 2025, and Incheon is growing at 4.80% CAGR on the back of airport and port expansions.
Note: Market size and forecast figures in this report are generated using Mordor Intelligence’s proprietary estimation framework, updated with the latest available data and insights as of 2026.
South Korea Transportation Infrastructure Construction Market Trends and Insights
Drivers Impact Analysis*
| Drivers | (~) % IMPACT ON CAGR FORECAST | Geographic Relevance | Impact Timeline |
|---|---|---|---|
| Metropolitan rail build-out | +1.2% | Seoul Capital Area, Incheon, N. Gyeonggi | Medium term (2–4 years) |
| Airport and port modernization | +0.9% | Busan, Incheon, national trade flows | Long term (≥4 years) |
| National logistics corridors | +0.6% | Export belt Ulsan–Pohang–Gwangyang | Medium term (2–4 years) |
| Rail electrification & low-carbon mobility | +0.5% | National, early adopters in Seoul, Busan, Daegu | Long term (≥4 years) |
| Safety, resilience & digital upgrades | +0.3% | Seismic and flood-prone routes | Short term (≤2 years) |
| Source: Mordor Intelligence | |||
Metropolitan Rail Build-Out Accelerates Urban Densification
GTX lines are compressing 90-minute journeys into 30 minutes, nudging housing demand into fringe cities, and lifting satellite land prices by double digits within a year of service launch[1]“GTX-A Begins Commercial Operations,” Railway-News, railway-news.com. Daily ridership on the GTX-A section topped 120,000 within three months of its March 2024 opening, overshooting forecasts by 15% and prompting the ministry to green-light new Phase 2 feasibility studies. Twelve-meter tunnel-boring machines now slice under metro platforms and deep utility corridors with minimal surface vibration, speeding right-of-way acquisition in densely built districts. A hybrid finance model—public seed grants plus developer density-bonus fees—could unlock USD 6 billion in private cash by 2028, aligning station-area profits with ridership growth. The approach shifts risk from taxpayers to land owners while keeping delivery on a predictable four-to-five-year horizon.
Airport and Port Modernization Anchors Trade-Gateway Strategy
Busan’s USD 10.5 billion automated container terminal recorded 40 crane moves per hour from April 2024—25% above legacy averages—cementing its transshipment edge in the hydrogen and offshore-wind supply chains. Incheon Airport’s USD 4.7 billion Terminal 2 makeover adds biometric boarding and AI-routed baggage, ratcheting capacity to 100 million passengers by 2030 and compressing average dwell time by a quarter. Hyundai E&C’s May 2025 exit from the USD 10.3 billion Gadeokdo airport consortium exposed marine-geology and typhoon-proofing risks, triggering a rebid that will embed more robust force-majeure clauses. Together, next-gen aviation and seaborne logistics projects are projected to drive nearly one percentage point of incremental export GDP by 2031, buffering the South Korea transportation infrastructure construction market against domestic austerity cycles.
National Logistics Corridors Enhance Export Competitiveness
Dedicated freight lanes shave congestion delays by 20% on expressways vital to chip, battery, and auto shipments, cutting logistics costs enough to offset rising wage bills. Electrified rail spines now haul 5,000-ton trains at 120 km/h to inland depots in Cheongju and Gwangju, lowering carbon output by 60% per ton-kilometer relative to trucking. Roadside sensors and vehicle-to-infrastructure signals dynamically tweak speed limits, boosting peak-hour throughput by 12% without pouring a centimeter of new asphalt. Export manufacturers report inventory-in-transit cuts of 48 hours on Ulsan–Busan runs, reinforcing South Korea’s reputation for just-in-time reliability. The corridor build-out, therefore, underpins both trade surplus resilience and the long-run health of the South Korea transportation infrastructure construction market.
Rail Electrification Aligns with Decarbonization Mandates
Phasing out diesel multiple units by 2029 requires USD 3.2 billion in catenary work on provincial lines, coupled with solar-tied substations that recapture braking energy for twilight peaks. Electric BRT fleets in Daegu and Gwangju routinely log 300 km daily on a single pantograph charge, chopping operating costs 30% against CNG buses and winning passenger approval for lower cabin noise. The environment ministry is finalizing carbon-credit schemes that let transit operators monetize saved emissions, potentially funding fare freezes through 2028. ISO 14001 certification has become table stakes in bid pre-qualification, rewarding contractors fluent in renewable integration. The electrification cycle, therefore, locks sustainability and profitability into a single, reinforcing loop.
Restraints Impact Analysis*
| Restraints | (~) % IMPACT ON CAGR FORECAST | Geographic Relevance | Impact Timeline |
|---|---|---|---|
| High project costs & complex land needs | –0.8% | Seoul, Busan metros | Short term (≤2 years) |
| Fiscal pressure & spending trade-offs | –0.5% | National, secondary cities | Medium term (2–4 years) |
| Environmental reviews & local opposition | –0.4% | Coastal & wetland zones | Medium term (2–4 years) |
| Source: Mordor Intelligence | |||
High Project Costs Compress Contractor Margins
Groundwater-soaked granite under Seoul forces tunneling expenses 40%–60% higher than greenfield freeways and pushes bid prices beyond mid-tier balance-sheet limits. Land parcels in Gangnam trade near USD 22,500 per square meter, meaning acquisition often absorbs a quarter of total project outlays[2]J.S. Park, “Land Prices Soar in Gangnam,” Wall Street Journal, wsj.com. Safety mandates after the 2022 Itaewon tragedy require fire-resistant linings and real-time monitoring even in short tunnels, adding another 15% to costs. Hyundai E&C’s 2025 walk-away from Gadeokdo highlighted how fragile margins turn when geology, typhoons, and rigid contracts collide. Until flexible risk-sharing models mature, profit compression will temper new-project appetite within the South Korean transportation infrastructure construction market.
Fiscal Pressure Delays Secondary Infrastructure
Government debt hovering near 50% of GDP prompted ceiling caps that channel scarce funds toward showpiece corridors while provincial arteries wait in the queue. Welfare outlays on aging and childcare absorb parallel budget lines, forcing multi-year staging that inflates interest charges and lengthens delivery by up to five years. Smaller cities such as Gwangju see LRT extensions paused despite ridership deficits, aggravating regional inequality. Proposed asset-recycling—selling mature toll roads to investors—could recycle cash, but concession rules remain opaque, stalling deals. The longer uncertainty persists, the more growth slippage bleeds into the South Korea transportation infrastructure construction market forecast.
*Our forecasts treat driver/restraint impacts as directional, not additive. The impact forecasts reflect baseline growth, mix effects, and variable interactions.
Segment Analysis
By Type: Railways Outpace Legacy Roadway Dominance
Roadways held a 49.25% South Korea transportation infrastructure construction market share in 2025, underscoring the legacy predominance of expressways in national mobility budgets. Yet railways, propelled by a 4.05% CAGR through 2031, are redirecting spend toward grade-separated corridors that free valuable surface real estate for pedestrians and cyclists. The GTX-A corridor reached 120,000 daily boardings in its inaugural quarter of 2024, validating demand for high-speed suburban rail and tilting investor preference toward station-area mixed-use projects that recycle transit uplifts into project cash flows.
Aviation and maritime sub-segments provide less volume but higher capital intensity per site. The USD 10.3 billion Gadeokdo airport, once Hyundai E&C re-bid concludes, could represent 15% of incremental spend between 2026 and 2030, while Busan’s automated container terminal already sets a global benchmark at 40 moves per crane-hour. Inland waterways remain niche, but experiments with autonomous electric ferries indicate future multimodal extensions. Overall, the pivot toward digital, electrified, and carbon-aware modalities positions rail and ports as the public-policy darlings of the South Korean transportation infrastructure construction market.


By Construction Type: Renovation Gains as Assets Age
New construction absorbed 66.55% of the South Korean transportation infrastructure construction market size in 2025, thanks to flagship builds such as GTX-C and Terminal 2. However, renovation is now growing at a 4.35% clip, outstripping greenfield spend as thousands of 1980s-era bridges approach end-of-design life. Contractors like Taeyoung E&C secure fast-cycle carbon-fiber wrap contracts that reopen lanes within weeks, improving cash flow and political optics.
Digital-twin overlays predict maintenance 18 months, extending asset life 20%–30% and sparing taxpayers new-build sticker shock. Intelligent transport systems shave secondary crash rates by 18% and boost throughput 12%, proving that smart tech can rival asphalt in congestion relief. Together, these factors embed renovation as a durable growth driver in the South Korean transportation infrastructure construction market.
By Investment Source: Private Capital Seeks Revenue Certainty
Public funds still supplied 58.65% of 2025 outlays, but private money is accelerating at a 4.65% CAGR, almost 40% faster than the headline growth rate. Land-value capture at GTX stations could yield USD 6 billion by 2028, while inflation-indexed toll escalators lure pension funds into 30-year concessions. GTX Phase 2 is slated as a showcase for blended finance, reducing public exposure yet safeguarding completion timelines with sovereign guarantees on land acquisition.
Asset-recycling talks—selling mature tollways to infrastructure funds—remain tentative due to gain-sharing haggles, but once frameworks stabilize, they could unlock multi-billion liquidity within two budget cycles. The investment-source split, therefore, signals a gradual hand-off of risk and reward from state to market, reinforcing long-run liquidity in the South Korean transportation infrastructure construction market.
Geography Analysis
Seoul’s 38.25% slice of 2025 spending positions it as the market anchor, yet physical saturation and costly land push the focus toward renovation and ITS overlays rather than new alignments. GTX builds now extend Seoul’s commute shed by roughly 40 km, swelling residential uptake in Dongtan and Gwangmyeong and tempering inner-city real-estate inflation. With land parcels in Gangnam exchanging near USD 22,500 a square meter, planners prefer grade-separated rails and predictive asset management to sprawling expressways.
Incheon’s 4.80% growth rank owes to Terminal 2’s expansion and port digitization that together aim to serve 100 million flyers and a booming EV export trade by 2030. Automated cranes cut dwell times for short-haul transshipment, reinforcing Incheon’s allure among freight forwarders juggling same-day air-ocean transfers. Busan matches ambition with its automated terminal and Gadeokdo reclamation, but Hyundai’s exit and the ensuing rebid inject timeline risk that could tip first flights into 2030.
Beyond the metropolitan triad, Daegu, Gwangju, and Pohang face spending caps that defer ring roads and airport upgrades, though asset-recycling and regional bonds may unlock new rounds of funding by 2027. The geography split, therefore, accentuates the concentration of spending in coastal gateways while interior provinces lobby for fiscal parity—an enduring tension within the South Korea transportation infrastructure construction market.
Regulatory Landscape
South Korea transportation infrastructure construction is governed through a mix of MOLIT procurement rules, national construction safety frameworks, and technical cost standards that shape bid pricing and contract risk allocation. For 2026, the government public construction investment plan totals KRW 62.8 trillion, with KRW 21.1 trillion earmarked for SOC such as railways, roads, and airports, and MOLIT scheduled 45 new SOC projects for tender, reinforcing public ordering as a driver of near-term project starts.
The regulatory environment is also tightening around permitting and cost realism. The Enforcement Decree of the Building Act (amended August 26, 2025) took effect February 27, 2026, strengthening requirements tied to permits and safety evaluations. MOLIT also updated standard construction cost items effective January 1, 2026, revising hundreds of unit-price components to better reflect labor and site safety costs, which directly feeds into public-project estimates and contractor margin management. In parallel, the Framework Act on the Construction Industry continues to drive five-year master planning and annual implementation plans, shaping safety, capability requirements, and compliance expectations across civil and transport works.
Value Chain Analysis
The value chain starts with project planning and funding led primarily by central and quasi-government procurers (MOLIT and affiliated ordering bodies), then moves through design and engineering, tendering, EPC delivery, and life-cycle maintenance where digital monitoring and asset upgrades are increasingly bundled. On the demand side, the 2026 ordering pipeline is anchored by public agencies such as Korea Land and Housing Corporation (LH), Korea Expressway Corporation, Korea Water Resources Corporation, and Korea National Railway, aligning procurement schedules with national SOC priorities (rail, roads, airports) and metropolitan congestion programs such as the 5th Metropolitan Area Traffic Congestion Road Improvement Plan (2026-2030) covering 21 road projects.
Upstream supply is concentrated in heavy materials (cement, aggregates, steel), electromechanical systems, and ICT layers (sensors, communications, control software) that enable ITS, automated terminals, and rail electrification. Large contractors, including Samsung C&T and GS E&C, typically integrate design, civil works, and systems delivery through consortium structures, while specialized suppliers provide cement and prefabricated or modular components for urban work sites. Key frictions in the chain are permitting and land acquisition timing, cost pass-through for safety and labor (reflected in 2026 unit-price standard updates), and interface management between civil packages and digital or ICT scopes, which are increasingly procured under standardized ICT construction cost estimates.
Competitive Landscape
The field remains moderately fragmented: Samsung C&T, Hyundai E&C, and POSCO E&C together hold under 45% share, leaving latitude for GS E&C, Daelim Industrial, and Lotte E&C to contest urban renovation and ITS overlays. Conglomerates gravitate to mega-projects with sovereign or gateway significance—GTX spurs, Gadeokdo airport, Busan port—where balance-sheet depth and integrated design-build-finance capacity trump unit-cost bids. Mid-tier challengers, meanwhile, carve out niches using modular TBMs, AI scheduling, and night-shift deployments that cut disruption fees on busy arterials.
Technology adoption is the new battlefront. Digital twins embedded with strain gauges create data annuities, positioning early adopters to win life-cycle O&M contracts that can exceed build fees over 30 years. C-ITS deployments on expressways generate real-time traffic insights monetizable via mobility-as-a-service platforms, opening a secondary revenue tier beyond concrete pours. Sustainability credentials now influence award decisions; ISO 14001 certification and proven renewable integration tilt scoresheets in electrification and port tenders.
Hyundai E&C’s Gadeokdo exit underscores risk-transfer limits even for tier-one firms, hinting at greater appetite for consortiums featuring marine-engineering specialists from Japan and Europe. Start-ups offering autonomous dump trucks and 3D-printed bridge components reduce onsite labor by up to 40%, chipping away at conglomerate cost advantages. The competitive map thus favors agile firms with deep digital and ESG toolkits, suggesting that pure balance-sheet strength will no longer guarantee dominance in the South Korean transportation infrastructure construction market.
South Korea Transportation Infrastructure Construction Industry Leaders
Samsung C&T
Hyundai E&C
Daaelim Industrial
GS E&C
Daewoo E&C
- *Disclaimer: Major Players sorted in no particular order

Market Opportunities and Future Outlook
Opportunities are clustering around rail megaproject execution, private-financed road delivery, and technology-heavy upgrades that compress construction windows in dense metros. In rail, MOLIT commenced construction on the 174.6 km Gimcheon-Geoje high-speed line in February 2026, featuring South Korea's first 2.1 km undersea rail tunnel, which creates demand for advanced tunneling, marine geotechnics, and systems integration across civil and electrified rail scopes. On the road side, the Taean-Anseong private expressway cleared a feasibility review in June 2026, highlighting ongoing use of private capital structures for long corridors that connect regional growth areas to the Seoul economic zone.
A second opportunity set is emerging from government-backed digitalization and automation programs that expand the addressable scope beyond concrete and asphalt into software-enabled infrastructure performance. In 2026, MOLIT launched the AI Application Product Rapid Commercialization Support Program (AX-SPRINT) to accelerate adoption of AI in road and mobility infrastructure, while autonomous-driving pilots, including a 2026 pilot city initiative in Gwangju, broaden the need for V2I equipment, roadside sensing, and data platforms as part of transport works. Policy actions in 2026 also emphasized regional rebalancing and acceleration of regional airport projects, including Gadeokdo, Daegu-Gyeongbuk, and Saemangeum, supporting a broader geographic spread of transport infrastructure packages beyond the Seoul core.
Recent Industry Developments
- April 2026: Hyundai E&C began on-site work for the 86.46 km GTX Line C project following government budget approval. The start of field execution advances a flagship metro-area rail corridor and raises near-term demand for urban tunneling, station construction, and systems integration capacity.
- February 2026: The Gadeokdo New Airport Construction Authority shifted the KRW 10.7 trillion site preparation package to a negotiated contracting process with Daewoo E&C after two failed public tenders. The move changes procurement dynamics for one of the country’s largest aviation infrastructure projects and signals tighter risk allocation and delivery controls after earlier bid setbacks.
- April 2024: Busan Port Authority inaugurated automated container terminals under its KRW 14 trillion port investment program through 2045, achieving around 40 moves per crane-hour. Higher crane productivity strengthens the business case for automation-led port capex and pulls more construction scope into integrated civil, electrical, and digital terminal systems.


Research Methodology Framework and Report Scope
Market Definition and Coverage
This market counts the value of construction work carried out in South Korea to build, expand, or rehabilitate transportation infrastructure, where project spending is linked to physical assets used to move people and freight.
Scope exclusions: routine operations and maintenance, rolling stock or aircraft and vessels, and general real estate works that are not part of transport asset construction.
Segmentation Overview
- By Type
- Roadways
- Railways
- Airways
- Ports and Inland Waterways
- By Construction Type
- New Construction
- Renovation
- By Investment Source
- Public
- Private
- By Key Cities
- Seoul
- Busan
- Daegu
- Incheon
- Rest of South Korea
Data Sources, Market Sizing, and Validation
Desk Research
Desk work started with mapping the South Korea infrastructure pipeline and the related public spending context, then translating that into measurable inputs for transportation asset construction. We referenced public sources such as Statistics Korea (KOSIS) construction output series, Ministry of Land, Infrastructure and Transport updates, Korea Development Institute project appraisal notes, and disclosures from Korea Expressway Corporation and Korea Rail Network Authority to reflect program timing.
To keep price and activity assumptions anchored, we also used open documents from the Bank of Korea for macro indicators and procurement releases from government tender portals for typical project scopes and award patterns. Company annual reports, investor materials, and reputable press were reviewed to cross-check where revenue is genuinely tied to transportation-infrastructure construction. For consistency checks, we leaned on paid subscriptions that provide company financial intelligence, tender and contract tracking, and shipment or import-export context where construction inputs materially affect costs. The sources listed above are illustrative, and additional references were used to collect data, validate assumptions, and clarify gaps.
Primary Interviews and Surveys
Primary discussions were used to pressure test the desk-built model, especially around what is counted as new-build versus rehabilitation, and how project values flow from tender awards into recognized construction value. We spoke with a mix of owners and EPC stakeholders, subcontractors, materials-linked participants, and independent advisors, and collected input across major urban centers and provincial areas so the final view reflects execution conditions.
Distribution of primary research fieldwork respondents
| Company type | Respondent position |
|---|---|
| Top tier: 34% | CXOs: 13% |
| Mid tier: 48% | Functional/Unit leaders: 29% |
| Smaller Players: 18% | Managers: 58% |
Market-Sizing & Forecasting
Our sizing uses a top-down and bottom-up blend. First, national civil works activity is reconstructed into a transportation-only demand pool, then checked through project and supplier reality checks. The top-down path starts with transport infrastructure budget signals and realized construction output, which are then split by asset type using program shares and execution timing. To corroborate the totals, we use selective bottom-up approximations, including sampled project values by mode, typical spend splits across civil works and systems packages, and a reasonableness check from sampled contractor revenue exposure.
Key inputs that move the model include government transport capex plans and mid-term budgets, tender award momentum and implementation lags, the rehabilitation versus expansion mix, unit cost movement for concrete and steel-intensive works, and urban constraint factors that affect productivity and contract pricing. Where project information is incomplete, gaps are handled by applying peer-project unit costs and average phasing curves, then reviewing these in primary validation. Forecasts are built using scenario analysis, since policy pacing and tender conversion can shift year to year, and the assumptions are anchored to what local experts expect for project starts, price escalation, and completion slippages.
Data Validation & Update Cycle
Validation is done in layers so the final number can be explained back to simple drivers. We compare outputs against independent signals such as public budget execution, construction output series, and visible tender and award activity, then investigate any large variances before sign-off. If an outlier appears, analysts re-check unit costs, timing assumptions, and mode splits, and then re-contact selected interviewees when clarification is needed.
Each report is refreshed annually, and interim adjustments are made when a material policy shift, a major program change, or a macro shock is observed. Before delivery, the model is re-run with the latest available inputs and a final review is completed so clients receive an updated view that reflects current market conditions.
Mordor Intelligence's South Korea Transportation Infrastructure Construction Market Sizing Compared With Other Published Estimates
Published market sizes for this space often do not align, mainly because studies use different cutoffs for what qualifies as transportation infrastructure construction and they also choose different timing for currency and pricing. Differences also show up when one model relies more on planned budgets, while another leans on realized construction output, which can move the value in the short term.
A refresh-led difference is common in this market because South Korea tender awards, budget execution, and input-cost inflation do not track in a straight line across years. The table shows how currency timing and assumed price escalation can widen the spread, and how including or excluding rehabilitation-heavy work (for example, asset-life extension on roads and rail) changes the counted value, a choice handled with a tighter annual refresh cadence and cross-checks in Mordor Intelligence.
Benchmark comparison
| Source | Market Size | Gaps in Research Methodology |
|---|---|---|
| Mordor Intelligence | USD 5.79 B (2025) | |
| Industry Publisher A | USD 5.80 B (2025) | Uses a broader transportation infrastructure framing and does not clearly separate construction value from adjacent activities, which can blur rehabilitation versus routine upkeep and compress year-to-year price effects. |
| Industry Publisher B | USD 7.90 B (2035) | Publishes a longer-dated endpoint with limited transparency on annual phasing, currency conversion timing, and price escalation logic, which can make the implied growth path differ from near-term execution signals. |
Overall, the gap is less about arithmetic and more about boundaries, timing, and how pricing is carried through the forecast years. When scope is kept to construction value and then checked against awards, execution signals, and realistic cost movement, the market size becomes easier to trace back to a few repeatable drivers.


Key Questions Answered in the Report
How large is the South Korea transportation infrastructure construction market in 2026?
It is valued at USD 5.98 billion and is projected to reach USD 7.04 billion by 2031, reflecting a 3.32% CAGR.
Which segment is expanding fastest in South Korean transport projects?
Railways lead with a forecast 4.05% CAGR, driven by GTX lines and the 2029 diesel-unit phase-out.
Why is private capital rising in Korean infrastructure?
Revenue-guarantee clauses and land-value-capture tools now protect returns, attracting pension funds and sovereign investors at a 4.65% CAGR.
What makes Incheon a high-growth location?
Parallel USD 4.7 billion airport and major port upgrades synchronize air-sea logistics, supporting a 4.80% local CAGR.
How are aging bridges being handled?
Carbon-fiber wraps, base isolators, and digital twins extend life 20%–30% while avoiding disruptive lane closures.
What risks could slow new mega-projects?
Complex geology, high land costs, and lengthy environmental reviews can shave up to 0.8 percentage point off the market CAGR.
Page last updated on:


 Your data is secure and never sold or shared.


