
Market Overview
| Study Period | 2020 - 2031 |
|---|---|
| Forecast Data Period | 2026 - 2031 |
| Base Year Market Size (2025) | USD 40.34 Billion |
| Market Size (2026) | USD 41.81 Billion |
| Market Size (2031) | USD 50.01 Billion |
| Growth Rate (2026 - 2031) | 3.65 % |
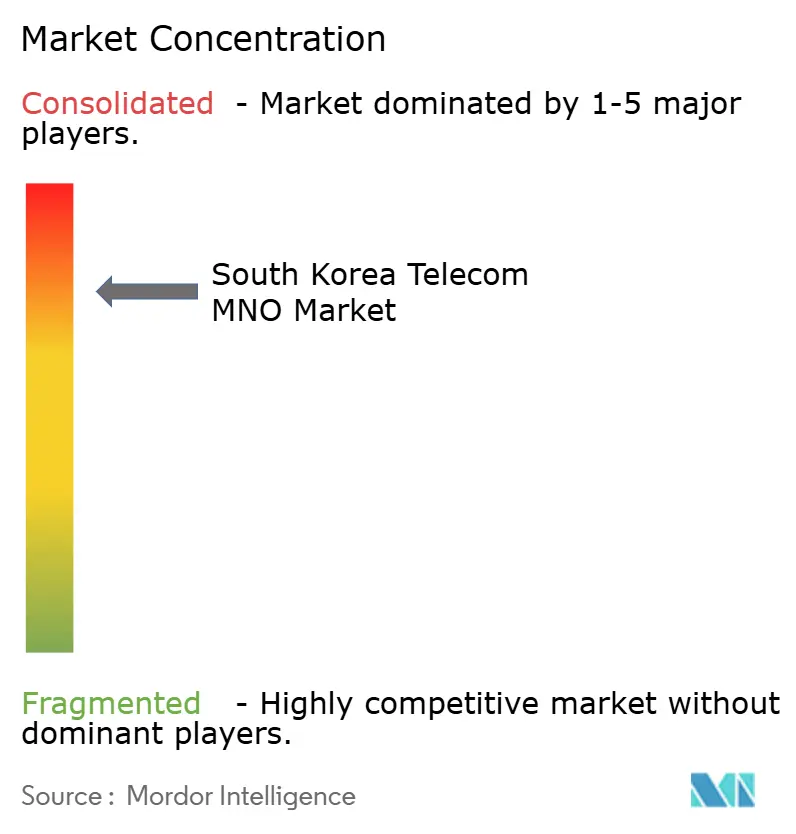
| Market Concentration | High |
Major Players *Disclaimer: Major Players sorted in no particular order Image © Mordor Intelligence. Reuse requires attribution under CC BY 4.0. | |
South Korea Telecom MNO Market Analysis by Mordor Intelligence
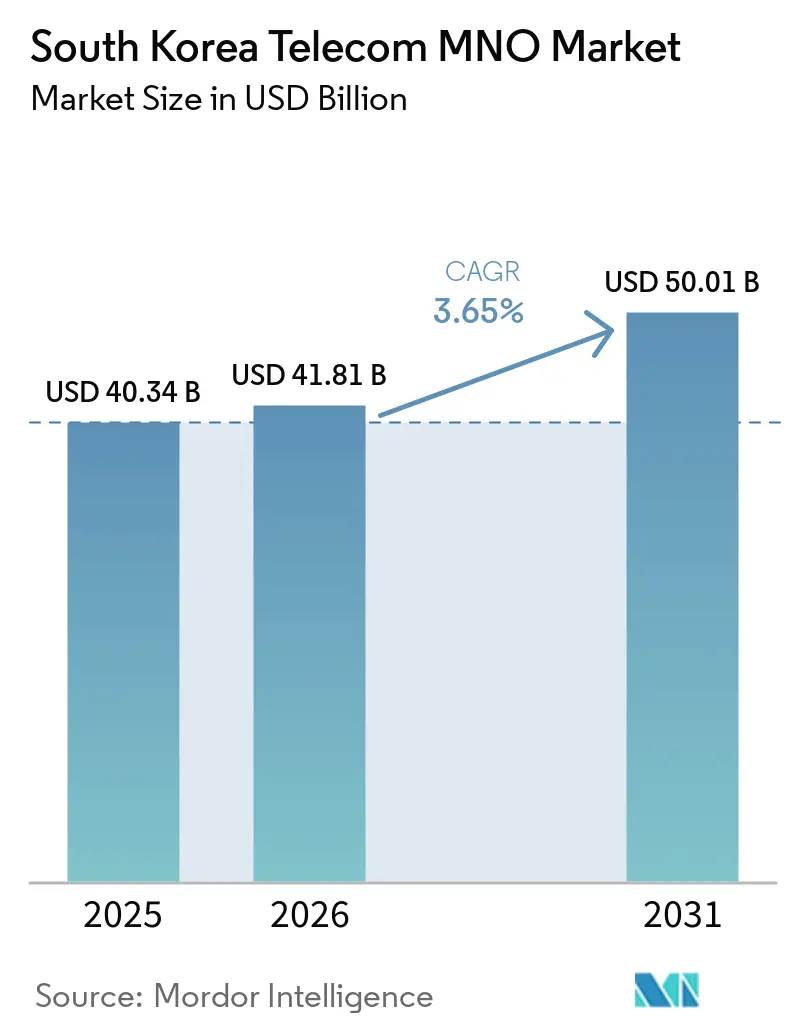
The South Korea Telecom MNO Market size is expected to increase from USD 40.34 billion in 2025 to USD 41.81 billion in 2026 and reach USD 50.01 billion by 2031, growing at a CAGR of 3.65% over 2026-2031. In terms of subscriber volume, the market was valued at 67.83 million Subscribers in 2025 and is expected to grow from 69.79 million Subscribers in 2026 to 80.47 million Subscribers by 2031, at a CAGR of 2.89% during the forecast period (2026-2031).
Operators are prioritizing enterprise network slicing, private 5G, and fixed-mobile convergence to counter price pressure from mid-tier 5G plans and MVNO-driven competition. Regulatory wholesale-rate cuts amplify that pressure, yet also broaden addressable demand in lower-income user groups, sustaining traffic growth. Manufacturing digitalization, cloud-edge partnerships, and AI-powered personal assistants are jointly enlarging the data services pie, while OTT substitution accelerates voice and SMS decline. Against this backdrop, spectrum fees and the 49% foreign-ownership cap continue to weigh on free cash flow and limit external funding.
Key Report Takeaways
- By service type, data and internet services held 41.35% of the South Korea telecom MNO market share in 2025. IoT and M2M services are projected to expand at a 3.76% CAGR from 2026 to 2031.
- By end user, the consumer segment accounted for 70.42% of the South Korea telecom MNO market size in 2025. The enterprise segment records the quickest trajectory, advancing at a 4.02% CAGR through 2031.
Note: Market size and forecast figures in this report are generated using Mordor Intelligence’s proprietary estimation framework, updated with the latest available data and insights as of 2026.
South Korea Telecom MNO Market Trends and Insights
Drivers Impact Analysis*
| Driver | (~)% Impact on CAGR Forecast | Geographic Relevance | Impact Timeline |
|---|---|---|---|
| Premium-priced 5G SA enterprise slicing | +0.8% | National, concentrated in Seoul-Incheon industrial corridor | Medium term (2-4 years) |
| Fixed-mobile convergence (FMC) bundles pushing churn below 2% | +0.6% | National, with higher penetration in urban areas | Short term (≤ 2 years) |
| MVNO-wholesale rate cuts enabling fourth-player price wars | +0.4% | National, with spillover effects in rural markets | Short term (≤ 2 years) |
| National push for private 5G in manufacturing "smart factories" | +0.7% | National, early gains in Ulsan, Gyeonggi, and Chungcheong provinces | Medium term (2-4 years) |
| AI-powered personal assistants driving data traffic | +0.5% | National, with early adoption in metropolitan areas | Long term (≥ 4 years) |
| Cloud-edge partnerships monetizing ultra-low-latency video | +0.3% | National, focused on high-density urban centers | Medium term (2-4 years) |
| Source: Mordor Intelligence | |||
Premium-priced 5G SA enterprise slicing drives B2B transformation
Operators deploy dedicated network slices over telecom tower infrastructure to guarantee latency and security for mission-critical tasks, enabling premium tariffs that shield margins in a saturated consumer arena. The Republic of Korea Navy’s private 5G project highlights the strategic value of isolated bandwidth for digital-twin and security workloads. Early industrial adopters such as Hyundai report zero connectivity-related downtime after integrating RedCap 5G into smart-factory lines. Regulators have already awarded private 5G frequencies to 35 firms across 56 sites, creating a robust pipeline for enterprise revenue [1].
Fixed-mobile convergence bundles reduce churn through service integration
Bundling broadband, mobile, and IPTV under a unified bill raises switching costs and pulls churn below 2%. Historical household surveys show bundle adoption drives markedly stronger retention compared with single-play subscriptions. KT’s Digico strategy illustrates the shift, leveraging fixed assets to cross-sell AI, cloud, and big-data services that deepen customer lock-in [2]. SK Broadband’s full ownership by SK Telecom further underlines the prioritization of converged packages to enlarge lifetime value.
MVNO wholesale-rate cuts intensify fourth-player competition
The Ministry of Science and ICT slashed usage-based wholesale fees by up to 52%, from KRW 1.29 to KRW 0.62 per MB, granting MVNOs more economic headroom and stimulating tariff competition at the low end [3]. LG Uplus’s decision to pursue MVNO partnerships underscores incumbents’ acknowledgement of the need to defend market share among price-conscious users. Although Stage X’s license revocation removed a full-network entrant, the expanded wholesale regime effectively seeds a de facto fourth-player dynamic in the budget segment.
National manufacturing digitization accelerates private 5G adoption
Government frequency allocations (100 MHz at 4.7 GHz and 600 MHz at 28 GHz) target smart-factory initiatives, pushing operators into turnkey automation roles. Samsung and Hyundai’s RedCap proof-of-concept demonstrated uplink reliability gains essential for real-time robotics, and follow-on projects span logistics and healthcare campuses.
Restraints Impact Analysis*
| Restraint | (~)% Impact on CAGR Forecast | Geographic Relevance | Impact Timeline |
|---|---|---|---|
| Saturated >130% SIM penetration ceiling | -0.9% | National, with highest saturation in metropolitan areas | Short term (≤ 2 years) |
| Foreign-ownership cap (49%) limiting new capital inflows | -0.4% | National, affecting all major operators | Long term (≥ 4 years) |
| OTT substitution eroding voice/SMS ARPU | -0.7% | National, with higher impact in younger demographics | Medium term (2-4 years) |
| High spectrum-renewal fees squeezing FCF | -0.5% | National, affecting all licensed operators | Medium term (2-4 years) |
| Source: Mordor Intelligence | |||
Saturated >130% SIM penetration ceiling
With 130% SIM penetration and 24 million 5G accounts already live, net-add upside is negligible, rerouting competition toward ARPU uplift rather than subscriber wins [4]. Operators are introducing sub-USD 20 equivalent 5G plans to avoid churn, yet these dilute blended revenue. In response, SK Telecom pivots resources into AI infrastructure and service differentiation to stabilize margins.
OTT substitution eroding voice/SMS ARPU
Household spend on telecom and streaming is projected to top KRW 140,000 in 2025, diverting wallet share from voice and SMS toward content subscriptions. Netflix and YouTube price hikes magnify the squeeze, particularly for youth cohorts who rely on data-rich apps instead of operator messaging. Telcos respond with content alliances and in-platform recommendation engines, yet low-margin data bundles offset gains in premium tiers.
*Our forecasts treat driver/restraint impacts as directional, not additive. The impact forecasts reflect baseline growth, mix effects, and variable interactions.
Segment Analysis
By Service Type: Data services dominate while IoT accelerates
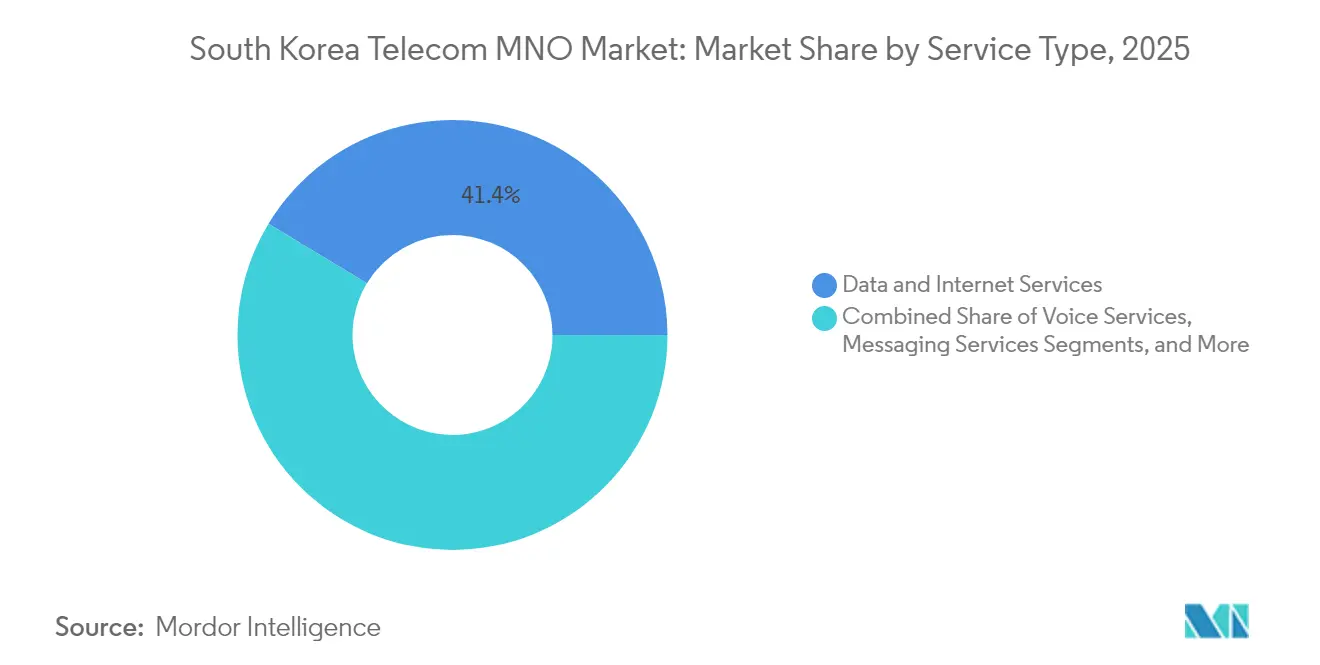
Data and internet services secured 41.35% of the South Korea telecom MNO market share in 2025, benefiting from nationwide 5G coverage and consumer appetite for UHD streaming and cloud gaming. Voice and messaging continue a low-single-digit slide as OTT preference solidifies. The South Korea telecom MNO market size contribution from IoT and M2M remains smaller in absolute value but leads growth at a 3.76% CAGR due to connected-factory and telematics adoption. Operators extend edge-compute nodes that lower latency by 60%, enabling differentiated data-centric use-cases. OTT and PayTV bundles add incremental revenue, with AI-curated channels aiming to stem churn.
Moving through 2026-2031, revenue mix tilts further to data as 6G research collaboration seeds early proofs. Ultra-low-latency video and cloud gaming act as gateway applications for premium tiers, offsetting commoditized connectivity. Operators layer security and analytics on IoT lines to raise ARPU, and private-network slices for factory automation accelerate fee-based growth. Together, these shifts reinforce a pivot toward high-value, data-intensive models that lower reliance on legacy voice contributions.

By End User: Enterprise expansion outpaces consumer maturity
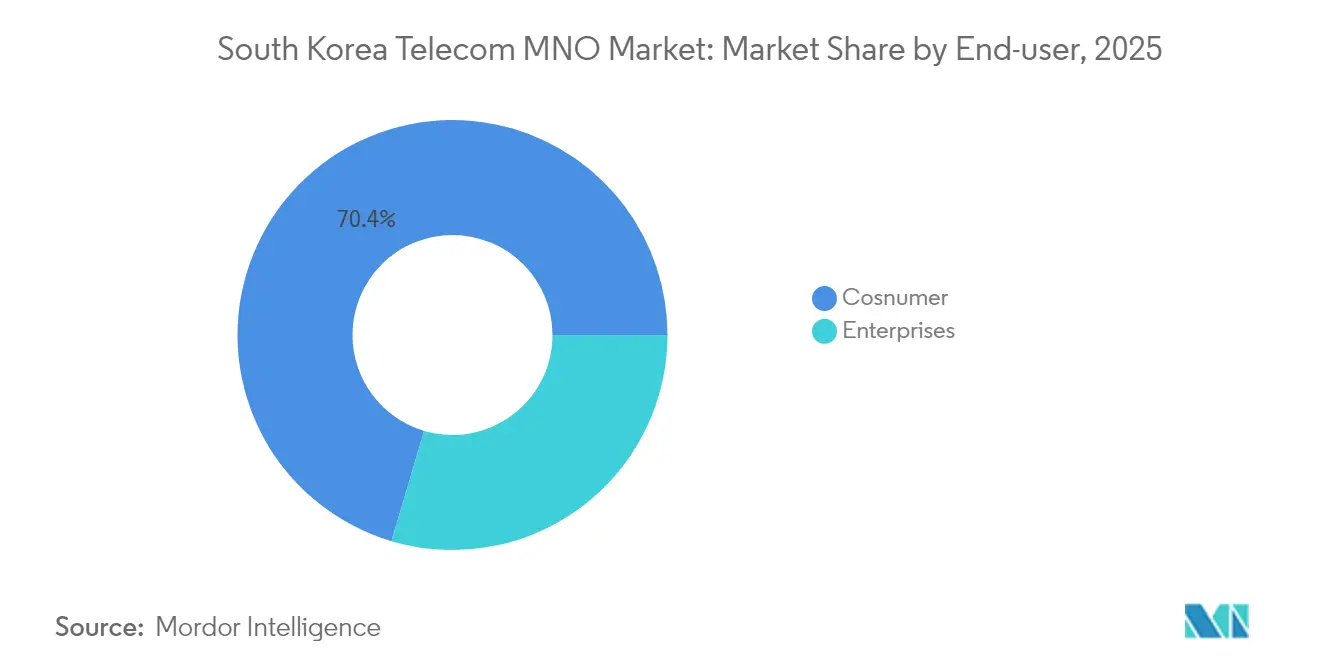
Consumer connections still anchor 70.42% of 2025 revenue, reflecting multi-device households and ubiquitous smartphone penetration. Yet the South Korea telecom MNO market size uplift now skews to enterprise lines, which chart a 4.02% CAGR as manufacturers install private 5G systems to link robots, digital twins, and AGVs. Enterprises adopt network-slice SLAs that command premiums over mass-market price plans, cushioning operator margins in a saturated household arena.
From 2025 onward, regulatory support for Industry 4.0 and the rise of AI-enabled assistants in retail, logistics, and healthcare will broaden the enterprise addressable base. Operators bundle cloud, edge, and security into managed offerings, embedding themselves deeper into customer workflows. While affordable consumer 5G plans safeguard base retention, their limited pricing power keeps overall blended ARPU flat, reinforcing enterprise as the decisive growth engine within the South Korea telecom MNO market.
Geography Analysis
South Korea’s compact geography and government coverage mandates have delivered blanket 5G availability since April 2024. Metropolitan Seoul-Incheon drives premium uptake and early enterprise slicing, owing to dense headquarters clusters and affluent consumers. Manufacturing provinces, Ulsan for shipbuilding, Gyeonggi for electronics, Chungcheong for automotive, anchor private 5G deployments that feed enterprise revenue lines. Rural regions witness MVNO-fueled adoption after wholesale-rate cuts, narrowing the digital divide but at thinner margins.
Urban ARPU remains highest, buoyed by AI-bundled IPTV and cloud gaming. Edge hubs sited in metropolitan exchanges further shorten packet journeys, enabling 8-millisecond latency for AR and industrial control. In industrial belts, private spectrum allocations let factories run autonomous guided vehicles without interference, a capability central to export competitiveness. Coastal naval facilities adopt bespoke 5G for security surveillance, expanding telco reach into defense verticals.
Limited domestic green-field expansion steers operators toward overseas partnerships. SK Telecom’s 6G collaboration with Singtel and Aster AI launch in North America broadens revenue horizons while exporting Korean platform IP. Such ventures offset home-market saturation and leverage advanced network expertise developed under stringent Korean quality-of-service benchmarks.
Regulatory Landscape
South Korea telecom policy is anchored by the Ministry of Science and ICT (MSIT) and the Telecommunications Business Act, with consumer-protection and competition levers increasingly shaping mobile economics. A key recent change is the March 2026 amendment requiring operators to analyze subscriber usage patterns and notify customers of optimal rate plans, with enforcement beginning in October 2026. This adds compliance requirements that interact with ongoing pricing pressure from lower-cost 5G tiers and MVNO activity.
Industrial and technology policy also influences operator capex and spectrum strategy. The Information Communications Strategy Committee released the 4th Basic Plan for Information and Communications Promotion and Convergence (2026-2028), which emphasizes 5G SA conversion and 6G R&D. Frequency policy shifts attention from new auctions toward reallocation of existing 3G/LTE bands. In parallel, the AI Basic Law takes effect in July 2026, setting transparency and safety obligations for high-impact AI systems, which is relevant as MNOs embed AI assistants and AI-enabled network operations into service delivery.
Competitive Landscape
South Korea’s telecom MNO market is highly concentrated: SK Telecom, KT Corporation, and LG Uplus collectively control a major share of industry revenue, creating an oligopolistic structure that suppresses pricing latitude yet funds R&D scale. Competitive vectors pivot from headline speeds to AI, edge compute, and quantum-secured networks. SK Telecom’s quantum partnership with Nokia underscores first-mover aspirations in post-5G security. KT blends nationwide fiber backbones with cloud services to woo enterprise CIOs, while LG Uplus courts MVNO affiliations to backfill share lost in top-tier segments.
Regulatory enablers such as lower MVNO tariffs prevent excessive rent extraction and sustain churn discipline. Nevertheless, investment obligations stay heavy, with operators pledging multibillion-dollar data-center outlays to serve AI workloads; SK Telecom alone injected USD 200 million into Smart Global Holdings’ U.S. edge facilities. Failure of Stage X to secure a nationwide license eliminated the prospect of a facilities-based fourth entrant, but indirect price warfare persists through MVNO proxies.
Strategic optionality centers on enterprise verticals. Telcos bundle robotics-friendly 5G, cloud analytics, and managed security for export-oriented manufacturers. Defense, smart-port, and smart-city tenders likewise create differentiation opportunities. Partnership ecosystems now extend beyond traditional OEMs into generative-AI labs, evidenced by SK Telecom’s entry into the MIT Consortium and its USD 10 million stake in Perplexity AI, positioning the firm to fuse AI agents with connectivity offers.
South Korea Telecom MNO Industry Leaders
-
SK Telecom
-
KT Corporation
-
LG Uplus
- *Disclaimer: Major Players sorted in no particular order
Market Opportunities and Future Outlook
The clearest whitespace for South Korea MNOs is enterprise-grade connectivity bundled with AI infrastructure services, where operators can sell beyond commodity mobile data. Government action provides a near-term anchor through the three-year AI and 6G roadmap (2026-2028) under the Information Communications Strategy Committee, along with pilots such as the Hyper AI Network Foundation project (KRW 17.206 billion) that selected SK Telecom and KT to test AI-RAN and physical-AI services. Together, these efforts support commercialization pathways for managed private 5G, slicing SLAs, and edge-enabled industrial workloads across manufacturing provinces.
A second opportunity cluster is the build-out of domestic AI compute and data-center linked telecom offerings, consistent with telco strategies to monetize fixed-mobile convergence, enterprise connectivity, and wholesale capacity. Disclosed commitments by major operators point to the scale and direction: KT has outlined a multi-year investment plan that includes dedicated AI data-center spending and network infrastructure upgrades (including 6G and submarine cables), while LG Uplus has announced an AI data-center build in Paju, Gyeonggi Province. On the commercial side, best-rate-plan notification requirements (enforcement from October 2026) and ongoing MVNO price competition increase the value of simplified integrated plans, upsell-ready FMC bundles, and differentiated enterprise propositions that attach security, analytics, and cloud-edge performance to connectivity.
Recent Industry Developments
- July 2026: SK Telecom launches integrated mobile plans consolidating LTE and 5G tariffs into Best and Lite categories. The move simplifies pricing and strengthens ARPU stability while offering subscribers a clearer path to upgrade. The tariff consolidation supports retention and upsell, aligning with AI-infra and data-centre monetization efforts.
- June 2026: SK Telecom partners with NVIDIA to build a gigawatt-scale AI cloud using the NVIDIA DSX platform. The partnership expands AI data-center capacity and cloud GPU services in Korea. It strengthens SK Telecom's AI infrastructure leadership and supports faster deployment of enterprise AI workloads in the market.
- May 2026: SK Telecom releases Q1 2026 earnings with strong AI Data Center AIDC revenue growth. The results point to a rising contribution from AI data centers to overall revenue. They also validate the pivot toward AI infrastructure and support planned data-center expansion.
Research Methodology Framework and Report Scope
Market Definition and Coverage
For this methodology, the market covers telecom operator revenues generated in South Korea from delivering connectivity and related communication services to consumers and enterprises, captured in USD value terms. The sizing follows the service revenue pool rather than counting equipment shipments.
Scope exclusions: We exclude handset and network equipment sales, pure IT services not billed as telecom services, and revenues earned outside South Korea.
Segmentation Overview
- Overall Telecom Revenue and ARPU
- Service Type
- Voice Services
- Data and Internet Services
- Messaging Services
- IoT and M2M Services
- OTT and PayTV Services
- Other Services (VAS, Roaming and International Services, Enterprise and Wholesale Services, etc.)
- End-user
- Enterprises
- Consumer
Data Sources, Market Sizing, and Validation
Desk Research
Desk research starts by building a clean fact base on subscriber scale, traffic growth, and regulated market structure, because these are the anchors that keep the revenue model realistic. Public sources that help here include official statistics and releases such as those from the Korea Communications Commission, the Ministry of Science and ICT, and Statistics Korea, along with OECD telecom indicators and ITU telecom statistics for cross-checking.
We also review operator filings and earnings materials, audited annual reports, and credible press coverage to understand ARPU direction, plan-mix changes, and the pace of 5G and fiber adoption. Where needed, our analysts also use paid subscriptions for company financials and intelligence, news and financials, patent databases, and an import-export shipment-level database to validate device mix signals that can influence service usage and pricing. The sources listed above are illustrative only, and many other public documents and data tables were also consulted for collection, validation, and clarification.
Primary Interviews and Surveys
Primary work is used to pressure-test the desk assumptions that typically drive the biggest swings in telecom value, especially pricing moves, subscriber migration to 5G plans, and enterprise connectivity adoption. We speak with telecom operator and wholesaler teams, enterprise connectivity buyers, channel and distribution stakeholders, and industry experts across South Korea, and then we use the feedback to tighten ARPU, service-mix, and adoption assumptions before finalizing the model.
Distribution of primary research fieldwork respondents
| Company type | Respondent position |
|---|---|
| Top tier: 32% | CXOs: 16% |
| Mid tier: 51% | Functional/Unit leaders: 38% |
| Smaller Players: 17% | Managers: 46% |
Market-Sizing & Forecasting
Sizing begins with a top-down build that reconstructs the service revenue pool from subscriber and connection bases, service penetration, and observed pricing levels in South Korea, and then it is translated into USD using consistent currency timing. Once the first pass is formed, the totals are corroborated through selective bottom-up checks such as sampled plan pricing times subscriber cohorts, channel checks on bundle attach rates, and partial roll-ups of publicly reported service lines, which are then used to adjust any overstatement.
Key inputs used in the model include mobile and fixed subscriber trends, 5G share of subscriptions, data consumption growth, ARPU movement by plan tier, fiber and broadband take-up, and the mix shift toward IoT and M2M connections. To keep the forecast grounded, scenario analysis is applied around a small set of variables that experts tend to agree on, like the pace of price competition, enterprise private network uptake, and the degree of substitution away from legacy voice and messaging. When bottom-up detail is missing for niche services, gaps are handled by using bounded ranges from interviews and then forcing consistency with the overall revenue pool and observed service-mix direction.
Data Validation & Update Cycle
Validation is done through triangulation across independent signals, and then through step-by-step variance checks at the service level and total market level. Our analysts compare outputs against external indicators such as subscriber and traffic series, reported ARPU trends, and regulatory updates that can quickly change wholesale terms or pricing behavior.
If a result looks off, the anomaly is traced back to the exact driver (price, penetration, or mix), followed by a second review, and re-contact is triggered with relevant interviewees when assumptions do not align with on-ground feedback. Reports are refreshed annually, with interim updates when material events occur, and a fresh pre-delivery pass is performed so clients receive the latest updated view.
Mordor Intelligence's South Korea Telecom Market Sizing Compared With Other Published Estimates
Different published market sizes for South Korea telecom can disagree even when they look similar on the surface, because the counted revenue streams and the treatment of pay-TV, OTT, and IoT services are not always consistent. The other common reasons are base-year choice, currency conversion timing, and whether a source relies more on operator disclosures or on modeled end-user demand signals.
Subscriber and ARPU trend checks, together with regulatory service-statistics releases used in validation, keep Mordor Intelligence's estimate tied to the telecom MNO revenue pool in South Korea instead of drifting into adjacent media or device revenue. In some publications, the headline total is built around telecom and pay-TV services revenue, and the model can also lean toward conservative pricing assumptions that flatten ARPU recovery. Another gap driver is refresh cadence, where older assumptions on 5G plan mix, MVNO pricing pressure, and enterprise connectivity growth can persist for longer than they should.
Benchmark comparison
| Source | Market Size | Gaps in Research Methodology |
|---|---|---|
| Mordor Intelligence | USD 40.34 B (2025) | |
| Trade Journal A | USD 32.30 B (2024) | Uses a telecom and pay-TV services revenue frame and a different base year, which can compress telecom-only revenue and shift totals due to currency timing. |
| Trade Journal B | USD 35.40 B (2029) | Publishes a forward-year revenue point for telecom and pay-TV, which is not directly comparable to a telecom MNO base-year value and can embed conservative ARPU and bundle assumptions. |
Overall, the spread is mainly explained by what gets counted as telecom services, the year being quoted, and how ARPU and bundle mix are projected. By keeping the model traceable to subscriber scale, service mix, and pricing behavior, the final output stays easier to reproduce and re-check when new KPIs are released.
Key Questions Answered in the Report
How large is the South Korea telecom MNO market in 2026?
It is valued at USD 41.81 billion in 2026.
Which service line currently leads revenue?
Data and internet services hold 41.35% share, the highest among service categories.
What CAGR is expected for enterprise connections?
Enterprise lines are projected to grow at a 4.02% CAGR between 2026 and 2031.
Who is the largest mobile operator?
SK Telecom leads with 33.6% revenue share.
Why are MVNOs expanding quickly?
Government-mandated wholesale-rate cuts of up to 52% lowered network-access costs, enabling aggressive retail pricing.
Which technology offers new premium revenue streams?
5G standalone network slicing provides guaranteed performance for mission-critical enterprise applications.