
Market Overview
| Study Period | 2021 - 2031 |
|---|---|
| Forecast Data Period | 2026 - 2031 |
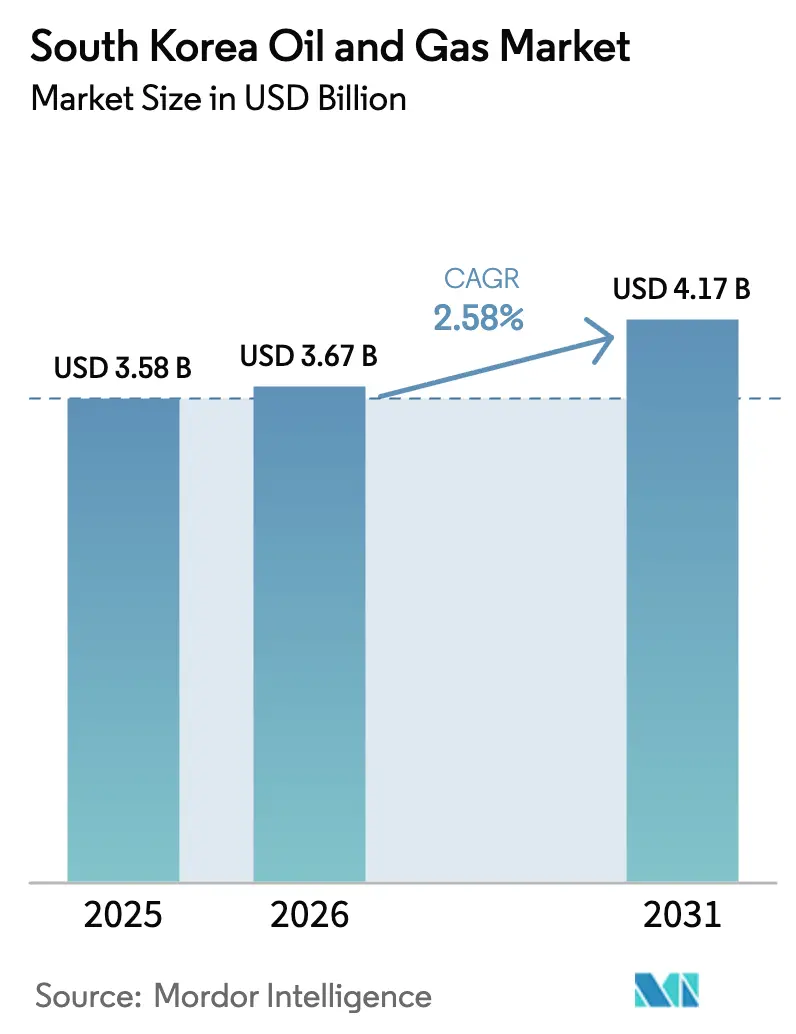
| Base Year Market Size (2025) | USD 3.58 Billion |
| Market Size (2026) | USD 3.67 Billion |
| Market Size (2031) | USD 4.17 Billion |
| Growth Rate (2026 - 2031) | 2.58 % |
| Market Concentration | High |
Major Players *Disclaimer: Major Players sorted in no particular order Image © Mordor Intelligence. Reuse requires attribution under CC BY 4.0. | |
South Korea Oil And Gas Market Analysis by Mordor Intelligence
The South Korea Oil And Gas Market size market is expected to grow from USD 3.58 billion in 2025 to USD 3.67 billion in 2026 and is forecast to reach USD 4.17 billion by 2031 at 2.58% CAGR over 2026-2031.
Strong downstream integration, rapid LNG terminal build-outs, and aggressive hydrogen pilots underpin near-term growth, even as long-run fossil-fuel demand plateaus. Downstream refiners continue to leverage the country’s 3.2 million barrels per day capacity to supply regional product deficits and finance energy-transition investments. Meanwhile, midstream operators are accelerating LNG import, storage, and distribution projects that also serve as future hydrogen and blue ammonia corridors, thereby creating a flexible supply backbone. Offshore exploration in the East Sea offers optionality against import dependence; yet, capital discipline and environmental safeguards remain pivotal. Competitive intensity rises as merged mega-players consolidate balance sheets, deploy digital twins, and pivot toward low-carbon offerings while state entities steer strategic stockpiling.
Key Report Takeaways
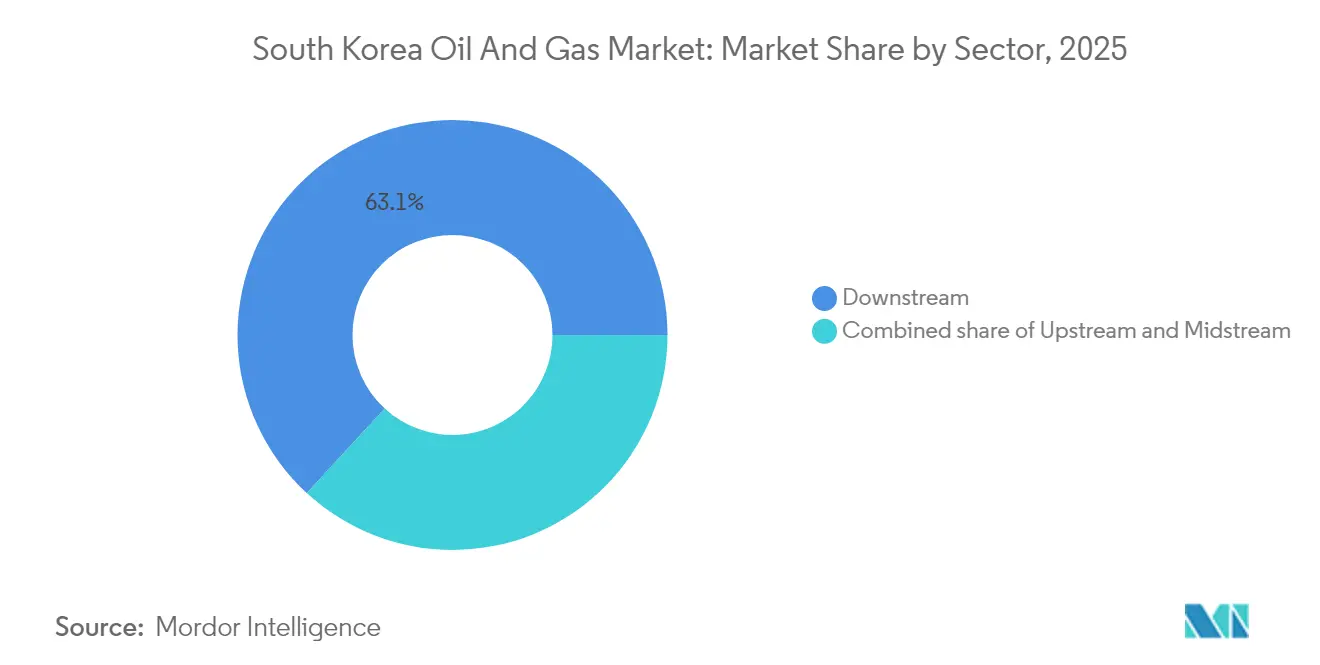
- By sector, the downstream sector held 63.15% of the South Korean oil and gas market share in 2025; the midstream sector is projected to advance at a 4.92% CAGR through 2031.
- By location, onshore assets accounted for 78.90% of the South Korea oil and gas market size in 2025, whereas offshore activities are forecast to expand at a 6.08% CAGR by 2031.
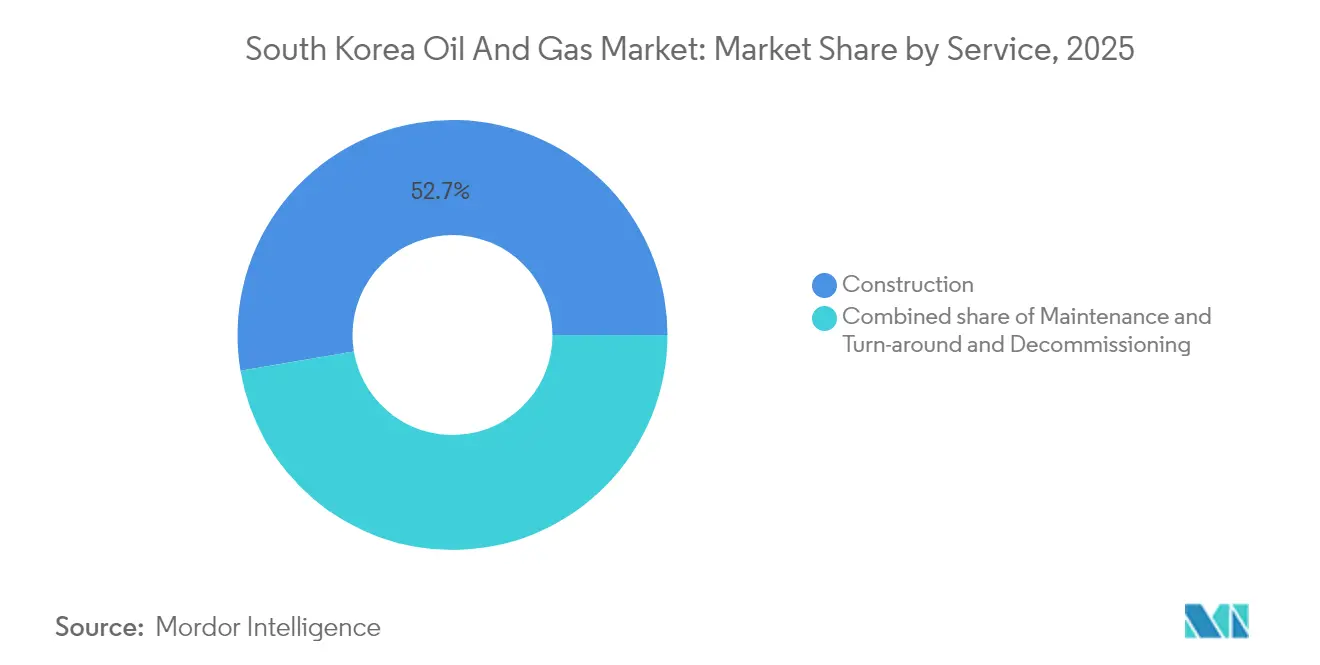
- By service, construction services captured 52.65% revenue share in 2025; decommissioning services are poised for a 5.72% CAGR to 2031.
Note: Market size and forecast figures in this report are generated using Mordor Intelligence’s proprietary estimation framework, updated with the latest available data and insights as of 2026.
Market Trends and Insights
Drivers Impact Analysis of South Korea Oil And Gas Market*
| Driver | (~) % Impact on CAGR Forecast | Geographic Relevance | Impact Timeline |
|---|---|---|---|
| LNG import-capacity expansion & new private terminals | +0.8% | National, concentrated in Yeosu, Gwangyang, Incheon | Medium term (2-4 years) |
| Jet-fuel-led rebound in refining margins | +0.6% | National, strongest in Ulsan-Onsan complex | Short term (≤ 2 years) |
| Expansion of strategic crude & fuel stockpiles | +0.4% | National, focused on Yeosu, Ulsan storage hubs | Medium term (2-4 years) |
| Hydrogen & blue-ammonia build-out leveraging LNG assets | +0.7% | National, early gains in Ulsan, Yeosu, Daesan | Long term (≥ 4 years) |
| AI-enabled digital oilfields & refineries | +0.3% | National, pilot projects in major refineries | Medium term (2-4 years) |
| Immersion-cooling fluids as new high-margin downstream outlet | +0.2% | National, concentrated in Seoul-Gyeonggi data center belt | Short term (≤ 2 years) |
| Source: Mordor Intelligence | |||
LNG Import-Capacity Expansion & New Private Terminals
South Korea's oil and gas market momentum gains from a new wave of privately financed LNG terminals that diversify supply routes beyond KOGAS's legacy network. POSCO International's Gwangyang facility—South Korea's first private terminal—adds 1 million tons annual capacity and catalyzes third-party procurement.[1] Concurrently, the KRW 1.4 trillion Yeosu Myodo project, slated for completion in 2026, introduces a 3 million-ton import capability with hydrogen-ready tanks. These expansions elevate national import capability to 65 million tons by 2027, enabling portfolio optimization among suppliers in Australia, Qatar, and the United States. Heightened competition lowers delivered gas costs for power generators and petrochemical users, while modular design eases future conversion to blue ammonia or liquid hydrogen handling. Strategic redundancy further insulates the South Korean oil and gas market from geopolitical shocks, thereby reinforcing its energy security prerogatives.
Jet-Fuel-Led Rebound in Refining Margins
Aviation traffic through Incheon International Airport rebounded to 75 million passengers in 2024, lifting jet-fuel cracks for Korean refiners to multi-year highs.[2] SK Innovation reported 40% higher jet-fuel margins year-over-year in Q4 2024, supplying carriers across Northeast Asia. GS Caltex optimized its Yeosu hydrocracker to reach 18% jet-fuel yield, while S-Oil’s USD 6.9 billion Shahin complex targets a 20% yield by 2026. Robust cash flows fund decarbonization retrofits such as carbon-capture units and hydrogen co-firing, sustaining competitiveness despite falling gasoline demand. The uplift also supports dividend stability, preserving investor confidence during the energy transition. As international travel continues to grow, jet-fuel-rich slates provide refiners a margin hedge until electric-aviation alternatives mature.
Expansion of Strategic Crude & Fuel Stockpiles
KNOC’s joint stockpiling deals with Kuwait Petroleum Corporation, Saudi Aramco, and ADNOC added 13.3 million barrels of storage without direct public expenditure. Foreign suppliers obtain proximity to Asian buyers, while South Korea secures an emergency supply that comfortably exceeds the IEA’s 90-day requirement. Rental fees create a predictable revenue stream that offsets KNOC’s debt-service obligations. Expansion plans include refined-product and hydrogen-carrier storage, future-proofing assets as fuel mixes evolve. By doubling as a regional commercial hub, the South Korean oil and gas market attracts trading houses seeking resilient inventory positions.
Hydrogen & Blue-Ammonia Build-Out Leveraging LNG Assets
Leveraging idle send-out capacity, SK E&S commissioned a 30,000-ton-per-year hydrogen liquefier in Incheon, interconnected with the existing LNG pipework. Government-backed 20-year clean-hydrogen PPAs de-risk new offtake, turning stranded LNG gear into growth engines. POSCO International’s blue-ammonia pier at Gwangyang, designed for an annual throughput of 1 million tons by 2027, showcases a capex-light reconfiguration of tanks, jetties, and vaporizers. These initiatives compress rollout timelines compared to greenfield builds, supporting South Korea’s ambition to supply 30% of its domestic power with clean hydrogen and ammonia by 2036. Synergies between LNG and hydrogen create a transition bridge that sustains midstream cash flow.
Restraints Impact Analysis of South Korea Oil And Gas Market*
| Restraint | (~) % Impact on CAGR Forecast | Geographic Relevance | Impact Timeline |
|---|---|---|---|
| Structural decline in gas-fired power demand post-2030 | -0.5% | National, affecting all gas-fired power plants | Long term (≥ 4 years) |
| LNG terminal over-build & stranded-asset risk | -0.3% | National, concentrated in coastal terminal locations | Medium term (2-4 years) |
| High corporate debt curbing capex in E&P & refining | -0.4% | National, affecting major energy companies | Short term (≤ 2 years) |
| Escalating CCS / carbon-price compliance costs | -0.2% | National, impacting high-emission facilities | Medium term (2-4 years) |
| Source: Mordor Intelligence | |||
Structural Decline in Gas-Fired Power Demand Post-2030
The 10th Basic Plan trims gas-fired generation’s share from 32.1% in 2022 to 21.6% by 2036, eroding long-term LNG baseload. Accelerating solar and wind rollouts, as well as nuclear restarts, displaces flexible gas, while K-ETS carbon prices narrow spark spreads. Korea Southern Power’s pledge to retire 2.4 GW of gas capacity by 2035 demonstrates growing momentum towards closure.[3] Lower plant load factors and pressure on offtake contracts jeopardize new LNG terminal economics. Operators mitigate risk by co-firing hydrogen blends, yet material volumes remain years away. Consequently, stranded-asset provisions weigh on balance sheets across the South Korean oil and gas market.
LNG Terminal Over-Build & Stranded-Asset Risk
Aggregate import capability could reach 65 million tons by 2027, compared to a projected 52 million ton demand peak in 2029, resulting in a 20% structural surplus. Utilization below 70% undermines debt-service coverage ratios, particularly for new private terminals that leverage project finance. Yeosu Myodo’s 3 million ton addition coincides with the electrification of petrochemical furnaces, hastening demand erosion. Asset owners explore diversifying into hydrogen, but conversions require new capital expenditures and regulatory clearance. Credit-rating agencies already flag terminal-specific downgrade risks, elevating refinancing costs within the South Korean oil and gas market.
*Our forecasts treat driver/restraint impacts as directional, not additive. The impact forecasts reflect baseline growth, mix effects, and variable interactions.
South Korea Oil And Gas Market Segment Analysis
By Sector:
Refining Scale Sustains, Midstream Leads GrowthThe downstream segment commanded 63.15% of the South Korean oil and gas market share in 2025, anchored by 3.2 million barrels per day of world-scale refining capacity located at Ulsan, Yeosu, and Onsan. Export-oriented product slats generate stable forex earnings and underpin the South Korean oil and gas market size for downstream players. High-complexity indices allow flexible crude selections, preserving gross refining margins under volatile feedstock differentials. Meanwhile, the midstream segment, although smaller, advances at a 4.92% CAGR to 2031, driven by LNG-terminal additions, hydrogen pipelines, and strategic stockpiling initiatives that position South Korea as Northeast Asia’s hub. Integrated operators are increasingly viewing midstream investments as a bridge to future hydrogen logistics, leveraging brownfield assets to minimize capital expenditures.
Strategically, downstream majors embark on deep-integration projects, such as S-Oil’s USD 6.9 billion Shahin complex, which couples fuel production with olefins, aromatics, and hydrogen-ready units. Such megaprojects extend value chains and mitigate declines in refined-product demand. Midstream players capitalize on policy incentives, including tax credits for blue-ammonia import facilities, and collaborate with utilities to pool offtake risk. This dual-track evolution preserves cash flow today while positioning the South Korean oil and gas market for low-carbon competitiveness.

By Location:
Coastal Concentration, Offshore UpsideOnshore infrastructure accounted for 78.90% of the South Korean oil and gas market size in 2025, reflecting the coastal industrial clustering that optimizes feedstock logistics and export channels. The Ulsan-Onsan corridor alone processes 1.4 million barrels per day and hosts petrochemical integration that boosts value capture. Dense pipeline grids and storage caverns reduce trucking emissions and enhance supply resilience. Yet offshore exploration grows at a 6.08% CAGR by 2031 as KNOC’s East Sea program enlists ExxonMobil, Chevron, and TotalEnergies to probe 3.5-14 billion-barrel prospects in 1,000-2,000 meter waters.
Offshore success could reshape the South Korean oil and gas industry by lowering import dependency and spawning domestic service ecosystems. Local shipbuilders, already global leaders in FPSO production, prepare modular production units tailored to Korean waters, creating synergies between the maritime and energy sectors. Environmental stakeholder engagement, however, remains pivotal to securing drill permits amid heightened ecological scrutiny.
By Service:
Construction Dominance, Decommissioning UpswingConstruction services accounted for 52.65% of total revenue in 2025, driven by EPC demand for LNG storage tanks, hydrogen liquefiers, and refinery upgrades. Domestic contractors utilize advanced project-management software and modular prefabrication, which compress schedules and reduce costs. Simultaneously, predictive-maintenance software packages become standard deliverables, unlocking recurring service fees post-handover. The decommissioning niche, although smaller, advances at a 5.72% CAGR amid planned gas-plant retirements and aging refinery units slated for closure by 2036.
Specialists in hazardous-waste handling, soil remediation, and materials recycling are position for multi-year dismantling contracts valued at USD 3.2 billion. Joint ventures with European decommissioning experts provide technology transfer while cultivating local supply chains. Maintenance and turnaround firms are integrating drones and robotics for flare-stack inspections, thereby minimizing downtime and safety incidents, and enhancing service-sector profitability within the South Korean oil and gas market.
Geography Analysis
The South Korean oil and gas market remains geographically concentrated along the southeast and southwest coasts, where integrated complexes leverage deep-water ports and proximity to export lanes. The Ulsan-Onsan basin hosts 44% of refining throughput, enabling economies of scale that anchor national fuel supply and petrochemical feedstock flows. Yeosu’s 800,000 barrels-per-day GS Caltex refinery integrates with downstream chemical parks, maximizing the utilization of propane and naphtha. Busan and Ulsan ports facilitate the import of crude oil and the export of refined products, reinforcing their coastal dominance.
Seoul-Gyeonggi, although landlocked, consumes 38% of total refined-product demand, driven by manufacturing, logistics, and burgeoning data center clusters that increasingly source specialty lubricants and immersion cooling fluids. Pipeline connectivity to coastal terminals ensures a reliable supply, while planned hydrogen highways aim to link production hubs to metropolitan fueling stations beginning in 2027.
Offshore, the East Sea exploration corridor extends 200-300 kilometers from shore, benefiting from nearby shipyards at Geoje and Ulsan, which are capable of constructing topsides and subsea modules. Discovery success would promote a domestic offshore services hub, leveraging Korea’s shipbuilding prowess for regional projects. Existing LNG carriers could be repurposed for the floating storage of blue ammonia exports, thereby amplifying the synergy between the maritime and energy sectors across the South Korean oil and gas market.
Regulatory Landscape
South Korea's oil and gas sector is governed by the Petroleum and Alternative Fuels Business Act (Petroleum Business Act), which sets rules for licensing, quality control, pricing oversight, and supply stability across refining, storage, distribution, and retail. In March 2026, the Ministry of Trade, Industry and Energy (MOTIE) introduced a measure capping exports of gasoline, diesel, and kerosene to 2025 levels to safeguard domestic supply, indicating the government's willingness to intervene in product flows when conditions tighten.
Price-related interventions and competition enforcement also shape operating conditions for refiners and marketers. In June 2026, the government promulgated rules enabling fiscal support for loss compensation tied to a maximum petroleum sales price system, which affects downstream margin management and compliance processes. Separately, prosecutors charged four major refiners, SK Energy, GS Caltex, S-OIL, and HD Hyundai Oilbank, with alleged price collusion in July 2026, reinforcing antitrust scrutiny and increasing the need for transparent wholesale-retail practices and audit-ready pricing systems.
Competitive Landscape
State-owned KNOC and KOGAS shape upstream and midstream strategies, ensuring alignment with national energy security mandates while delegating operational agility to private refiners. The November 2024 merger between SK Innovation and SK E&S created a KRW 105 trillion asset base capable of funding multi-fuel portfolios spanning oil, gas, hydrogen, and renewables. GS Caltex and S-Oil sustain a competitive edge through high-complexity refining, petrochemical integration, and aggressive co-processing of bio-feedstocks.
Digitalization differentiates contenders; AI-augmented process controls and predictive analytics cut variable costs and maximize yields, with early adopters reporting 2–3 percentage-point margin gains. Carbon-management capabilities, including flue-gas capture and low-carbon LNG procurement, are increasingly influencing lender and offtaker choices, encouraging joint investments in CCS infrastructure, such as Samsung Engineering’s USD 800 million POSCO project.
Consolidation pressures mount for smaller players, who lack the scale to absorb carbon costs or finance hydrogen pivots. Alliances with global majors provide capital and technology, evidenced by East Sea farm-ins that transfer deep-water know-how. Market entrants are eyeing niche downstream products—such as immersion-cooling fluids, high-purity solvents, and advanced lubricants—to bypass commodity cycles. Overall, strategic agility and balance-sheet resilience dictate winner profiles across the South Korean oil and gas market.
South Korea Oil And Gas Industry Leaders
-
SK Energy
-
GS Caltex Corporation
-
S-Oil Corporation
-
HD Hyundai Oil Bank Co., Ltd
-
Korea Gas Corporation
- *Disclaimer: Major Players sorted in no particular order

South Korea Oil And Gas Market Companies Covered in this Report
- Korea National Oil Corporation (KNOC)
- Korea Gas Corporation (KOGAS)
- SK Energy
- GS Caltex
- S-Oil Corporation
- Hyundai Oilbank (HD Hyundai Oilbank)
- POSCO International
- SK Gas
- SK Enmove (Lubricants)
- HD Hyundai Heavy Industries (Offshore/CCS)
- Samsung C&T (EPC & LNG)
- Daesung Industrial
- CNCITY Energy
- OZ-SEPA (Spill-remediation tech)
- CarbonCo (CCUS)
- GS EPS (Gas-fired IPP)
- Korea Southern Power (KOSPO)
- Korea Midland Power (KOMIPO)
- SK Innovation E&S (Hydrogen)
- KNOC–SK Joint Storage (Yeosu/Ulsan)
- Samsung Engineering (Petrochem & CCUS EPC)
Market Opportunities and Future Outlook
Energy-security programs continue to create room for growth in storage, logistics, and related services. Government plans to expand oil stockpiling facilities by over 20 million barrels, alongside an ongoing review to add naphtha or condensate to the national strategic stockpile list, support incremental demand for tankage, blending, sampling, inspection, and terminal operations, especially around existing coastal hubs. These policy moves build on South Korea's established approach to strategic storage as both an emergency buffer and a commercial platform, allowing midstream operators and service providers to structure capacity, operations, and financing around state-directed inventory priorities.
Decarbonization-linked industrial policy is also redirecting capital toward refinery efficiency and low-carbon utilities while pressuring high-emission configurations. Climate policy financing of KRW 790 trillion for 2026-2035, together with domestic production tax credits for essential materials (calculated by output volume) and higher loan limits (up to 100%) aimed at diversifying import sources for high-dependency materials, supports projects that cut energy intensity and improve resilience of feedstocks and intermediates used across refining and petrochemical value chains. GS Caltex's 2026 collaboration with Veolia on AI-based utility operations and wastewater reuse at Yeosu provides a concrete signal of this shift, pointing to opportunities in digital operations, industrial water reuse, and on-site utility decarbonization at large coastal complexes.
Recent Industry Developments in South Korea Oil And Gas Market
- July 2026: SK Group signs a definitive agreement to establish a renewable energy joint venture platform with KKR for solar, wind, fuel cells, and energy storage. The move broadens SK Group's exposure to renewables and mobilizes private capital to scale projects, supporting its sustainability push. It reinforces SK's GX trajectory by adding new assets to its renewable portfolio and signaling faster deployment.
- June 2026: SK Innovation signs a business transfer agreement with KKR to integrate renewable energy assets into a new platform with a roughly 5.5 GW pipeline. The arrangement expands 2026-2031 renewable capacity planning and brings private capital into the structure. It accelerates asset consolidation and funding for large-scale renewables within the SK Group ecosystem.
- April 2026: GS Caltex and Veolia sign a memorandum of understanding to integrate AI based utility operations and green technology at Yeosu refinery, focusing on digital and wastewater reuse. The collaboration supports refinery-level digital optimization and environmental performance improvements. It advances digitalization and carbon reduction ambitions at core refining assets.
South Korea Oil And Gas Market Report Scope and Research Methodology
Market Definition and Coverage
This market is defined as the value of oil and gas activities in South Korea, covering revenue linked to hydrocarbon exploration and production, transport and storage, and refining and related operational services, reported in USD for the study period.
Scope exclusions: We do not treat adjacent power generation, retail fuel marketing margins, or non-hydrocarbon renewable energy value chains as part of this market unless they are directly tied to oil and gas operations.
Segments Covered in This Report
- By Sector
- Upstream
- Midstream
- Downstream
- By Location
- Onshore
- Offshore
- By Service
- Construction
- Maintenance and Turn-around
- Decommissioning
Data Sources, Market Sizing, and Validation
Desk Research
Desk research was used to set the factual backbone for the model, mainly by mapping South Korea energy balance realities and the role of imports, refining, and logistics. We referenced public sources such as Korea National Oil Corporation releases, Korea Gas Corporation publications, Ministry of Trade, Industry and Energy notices, and national statistics and trade series (for example, Statistics Korea and the Korea Customs Service).
To make the inputs usable for sizing, we also reviewed operator disclosures such as annual reports and investor presentations, along with port and terminal updates and reputable press coverage on refinery utilization and major project timelines. Where needed, we supplemented this with paid subscriptions focused on company financials and intelligence, news and financials, and import and export shipment-level trade flows to cross-check volumes and pricing direction. The desk sources listed here are illustrative only, and additional public references were used for data collection, validation, and clarification.
Primary Interviews and Surveys
Primary work was completed through expert interviews and structured surveys with upstream and midstream specialists, refinery and terminal stakeholders, engineering and service participants, and local market observers who track operating conditions. We used these discussions to confirm what is counted as in-scope revenue, test utilization and service intensity assumptions, and sanity-check pricing and timing for maintenance and project cycles across South Korea.
Distribution of primary research fieldwork respondents
| Company type | Respondent position |
|---|---|
| Top tier: 37% | CXOs: 18% |
| Mid tier: 43% | Functional/Unit leaders: 38% |
| Smaller Players: 20% | Managers: 44% |
Market-Sizing & Forecasting
Market sizing starts with a top-down build that reconstructs South Korea oil and gas value pools from activity indicators, and then assigns spend and revenue intensity to each activity area. In practice, we track signals such as crude and product throughput at refineries, LNG and gas import handling volumes, storage and terminal utilization, and the cadence of turnarounds and maintenance works that drive service revenue.
Those activity pools are then corroborated with selective bottom-up approximations, such as sampled price per unit of service, typical contract sizes for maintenance and construction tasks, and supplier and channel checks that help us adjust totals when a single metric appears overstated. When gaps appear (for example, limited disclosure on smaller service participants), we use conservative proxying based on verified utilization ranges and normalize results against visible import, refining, and logistics signals.
For forecasting, we mainly apply scenario analysis supported by a light multivariate regression view, where volumes, utilization, policy direction on gas supply security, and project pipeline timing are treated as the main drivers. Assumptions are reviewed with interview feedback so the forward view reflects realistic operating constraints rather than a straight-line trend.
Data Validation & Update Cycle
Before finalizing outputs, we run triangulation checks by comparing model totals against independent signals, such as changes in import and handling volumes, refinery run rates, and observed service activity patterns during scheduled shutdown seasons. Outliers are flagged and reworked, and then an additional analyst review is completed so calculation logic, unit conversions, and currency timing are consistent.
If material variance shows up between desk indicators and interview feedback, we re-contact sources to confirm whether a shift is structural (policy, outage, new capacity) or temporary (timing and one-off events). Reports are refreshed annually, and interim updates are made when major events impact volumes, utilization, or pricing assumptions. Before delivery, we do a final pass so clients receive the most current view available at that time.
Mordor Intelligence's South Korea Oil and Gas Market Estimate Compared With Other Published Estimates
Published market values for South Korea oil and gas can look far apart because groups often define the market differently and then apply different activity and pricing assumptions on top of that. Some estimates lean heavily toward upstream and field services, and others toward downstream operations or even include broader energy-related revenues.
A common split comes from scope width, since some published numbers fold in fuel retail, petrochemicals, or wider energy infrastructure spending that sits next to oil and gas. In the split used by Mordor Intelligence, revenue is counted only when it ties back to oil and gas operations across upstream, midstream, and downstream activities, and it is kept in value terms with checks against utilization, import handling, and turnaround cycles.
Benchmark comparison
| Source | Market Size | Gaps in Research Methodology |
|---|---|---|
| Mordor Intelligence | USD 3.58 B (2025) | |
| Industry Publisher A | USD 0.53 B (2026) | This figure appears to be closer to a narrower oil and gas services view, which can exclude downstream operational revenue pools such as refining-linked activity and terminal handling, leading to a smaller total. |
| Industry Publisher B | USD 0.34 B (2025) | This estimate looks aligned to a limited sub-scope that emphasizes exploration or upstream-only spend, and it may not reconcile results against import, throughput, and maintenance cycle signals that can materially affect the in-country value pool. |
Taken together, the spread in values is mainly explained by what each publisher includes as monetized activity inside South Korea, and whether the model is anchored to observable volume and utilization indicators. Our approach stays traceable to practical drivers like throughput, handling volumes, and service cadence, which makes the final number easier to re-check and update when conditions change.
Key Questions Answered in the Report
How large is the South Korea oil and gas market in 2026?
It stands at USD 3.67 billion and is forecast to reach USD 4.17 billion by 2031.
Which segment is growing fastest through 2031?
Midstream, buoyed by LNG-terminal and hydrogen-pipeline build-outs, is projected to post a 4.92% CAGR.
What share do onshore assets hold today?
Onshore infrastructure accounts for 78.90% of total activity in 2025, reflecting the country’s coastal industrial clusters.
Why are refiners focused on jet fuel production?
Jet-fuel margins surged 40% in Q4 2024 as aviation traffic rebounded, providing critical cash flow for transition investments.
How is South Korea addressing long-term LNG overcapacity?
Operators are adding hydrogen and blue-ammonia handling to existing terminals to repurpose assets and safeguard utilization.
What competitive trend reshaped the sector in 2024?
The merger of SK Innovation and SK E&S formed Asia-Pacific’s largest private energy firm, sharpening scale advantages for low-carbon pivots.