
Market Overview
| Study Period | 2020 - 2031 |
|---|---|
| Forecast Data Period | 2026 - 2031 |
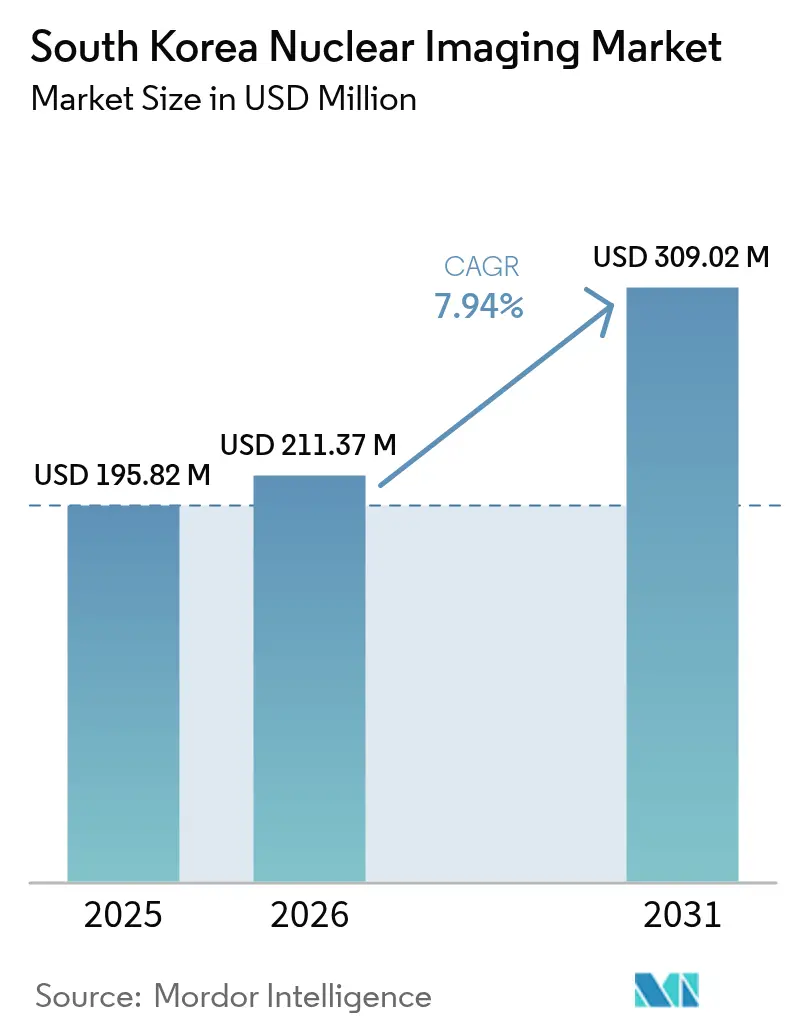
| Base Year Market Size (2025) | USD 195.82 Million |
| Market Size (2026) | USD 211.37 Million |
| Market Size (2031) | USD 309.02 Million |
| Growth Rate (2026 - 2031) | 7.94 % |
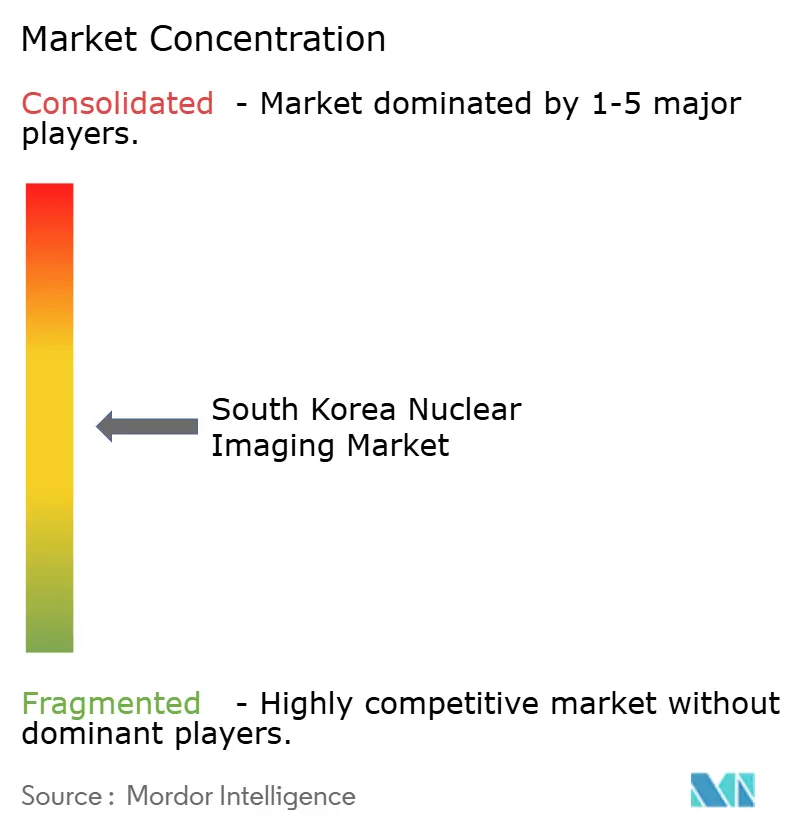
| Market Concentration | Medium |
Major Players *Disclaimer: Major Players sorted in no particular order Image © Mordor Intelligence. Reuse requires attribution under CC BY 4.0. | |
South Korea Nuclear Imaging Market Analysis by Mordor Intelligence
South Korea nuclear imaging market size in 2026 is estimated at USD 211.37 million, growing from 2025 value of USD 195.82 million with 2031 projections showing USD 309.02 million, growing at 7.94% CAGR over 2026-2031. Robust demand for precision oncology diagnostics, expanding domestic radioisotope production, and rapid integration of artificial intelligence (AI) into imaging workflows collectively underpin this trajectory[1]. Continued build-out of cyclotron capacity, coupled with favorable reimbursement for neurology PET tracers, is widening clinical adoption beyond the Seoul–Busan corridor. Private-sector hospital investment is shortening equipment refresh cycles, while international medical-tourism inflows stimulate premium diagnostic services. Persistent supply-chain fragility for imported isotopes and workforce shortages in nuclear-medicine technologists remain structural headwinds.
Key Report Takeaways
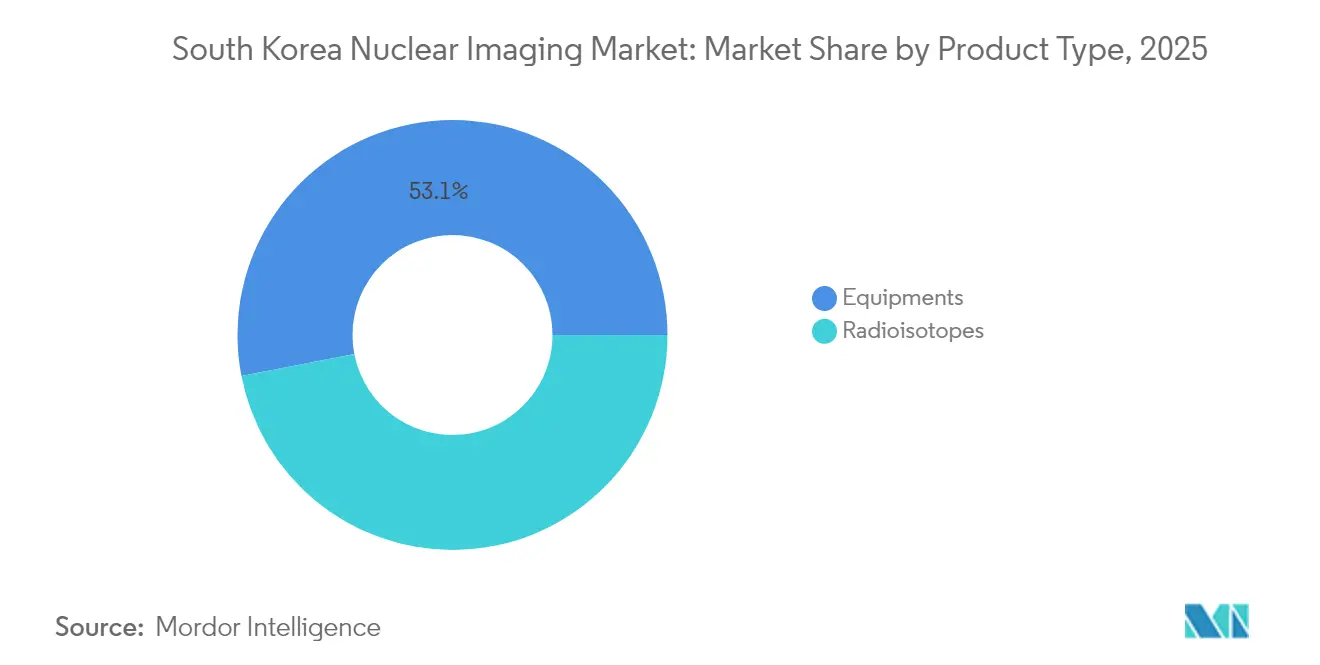
- Equipment captured 53.05% of the South Korea nuclear imaging market in 2025, reflecting provider preference for high-resolution molecular imaging, Radiosiotopes outpaced all other equipment segments with an 8.01% CAGR forecast through 2031, aided by lower capital costs and broader provincial rollout.
- Oncology applications accounted for 64.19% of the South Korea nuclear imaging market in 2025 as aging demographics accelerated demand for cancer staging and therapy monitoring, Neurology is projected to record the fastest growth, expanding at an 8.17% CAGR to 2031 on the back of dementia-care reimbursement expansion.
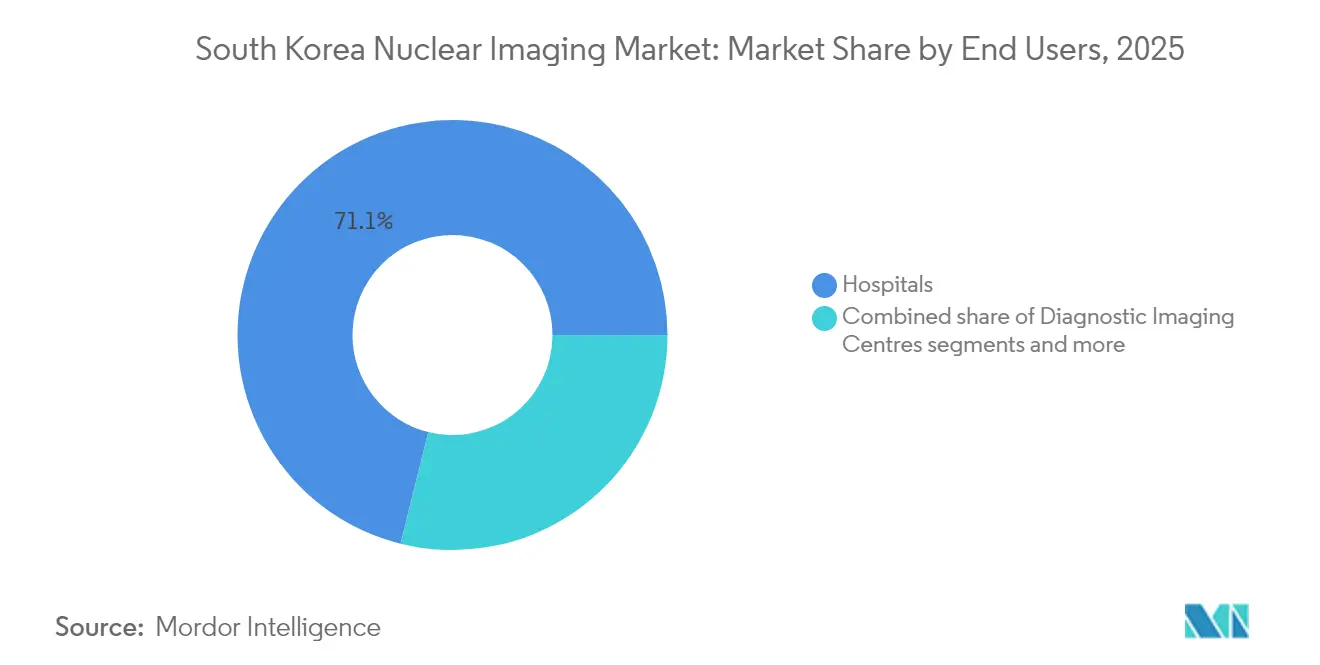
- Hospitals dominated end-user uptake with a 71.12% revenue share in 2025, leveraging integrated diagnostic-treatment pathways, Academic and research institutes are forecast to grow at 8.03% CAGR through 2031, driven by theranostics clinical-trial pipelines and government R&D grants.
Note: Market size and forecast figures in this report are generated using Mordor Intelligence’s proprietary estimation framework, updated with the latest available data and insights as of 2026.
South Korea Nuclear Imaging Market Trends and Insights
Drivers Impact Analysis*
| Driver | (~) % Impact on CAGR Forecast | Geographic Relevance | Impact Timeline |
|---|---|---|---|
| Growing oncology PET/CT demand driven by aging population | +1.8% | National, concentrated in Seoul-Busan corridor | Long term (≥ 4 years) |
| Government reimbursement expansion for dementia PET tracers | +1.2% | National, with priority in underserved regions | Medium term (2-4 years) |
| Roll-out of domestic Ga-68 generator manufacturing capacity | +1.5% | National, centered on KAERI facilities | Medium term (2-4 years) |
| Hospital privatisation accelerating equipment refresh cycles | +0.9% | Urban centers, particularly Seoul metropolitan area | Short term (≤ 2 years) |
| AI-based image-reconstruction lowering dose & scan-time | +1.1% | Major hospital networks nationwide | Short term (≤ 2 years) |
| Cyclotron build-out linked to theranostics clinical trials | +1.0% | Academic medical centers and research institutes | Long term (≥ 4 years) |
| Source: Mordor Intelligence | |||
Growing Oncology PET/CT Demand Driven by an Aging Population
Korea’s population aged 65 plus will reach 20.3% in 2025, placing sustained pressure on oncology imaging capacity. High-sensitivity PET/CT scanners deployed at the National Cancer Center show markedly improved lesion detection in prostate cancer, achieving 86.9% accuracy with 68Ga-NGUL tracers. Hospitals are accelerating procurement schedules, with Yonsei Cancer Center adding a carbon-ion facility that began treating patients in 2023. Parallel clinical-trial data demonstrate 49.5% objective response rates for targeted alpha therapy in neuroendocrine tumors. These factors combine to keep the South Korea nuclear imaging market firmly anchored in oncology leadership.
Government Reimbursement Expansion for Dementia PET Tracers
The Health Insurance Review and Assessment Service widened coverage for amyloid and tau PET imaging in January 2025, cutting patient co-payments by 18%. The policy supports a projected trebling of dementia prevalence by 2050, intensifying demand for early PET-based diagnosis. Seoul-based tertiary centers report 92% diagnostic accuracy when pairing AI analytics with PET for mild cognitive impairment screening. Expanded insurance coverage thereby sustains medium-term volume growth for the South Korea nuclear imaging market.
Roll-out of Domestic Ga-68 Generator Manufacturing Capacity
KAERI commenced commercial actinium-225 output in mid-2025 and is scaling gallium-68 generator lines to mitigate European reactor supply risk[2]. Cyclotron-produced Ga-68 shows 491 GBq/µmol apparent molar activity, markedly outclassing generator-derived alternatives. Domestic isotopes are priced nearly 14% below imported equivalents, freeing budget for equipment upgrades. Localized supply thereby strengthens resilience and underpins the South Korea nuclear imaging market.
Hospital Privatization Accelerates Equipment Refresh Cycles
Approval of Greenland International Hospital as Korea’s first for-profit facility signals broader privatization momentum. Government infrastructure packages allocate KRW 10 trillion for hospital expansion through 2028, amplifying private capital flows. Equipment vendors note reduced sales-cycle times, reflecting aggressive procurement by urban private centers. The trend elevates unit shipments and lifts near-term revenue for the South Korea nuclear imaging market.
Restraints Impact Analysis*
| Restraint | (~) % Impact on CAGR Forecast | Geographic Relevance | Impact Timeline |
|---|---|---|---|
| Radiopharmaceutical supply chain intermittency | -1.3% | Global impact, affecting Korean imports | Short term (≤ 2 years) |
| High capital cost of PET/MR limiting provincial access | -0.8% | Rural and secondary cities outside Seoul-Busan | Medium term (2-4 years) |
| Shortage of certified nuclear-medicine technologists | -1.1% | National, acute in rural areas | Long term (≥ 4 years) |
| Stringent MOHW radio-isotope transport regulations | -0.6% | National, affecting inter-facility transfers | Medium term (2-4 years) |
| Source: Mordor Intelligence | |||
Radiopharmaceutical Supply-Chain Intermittency
The October 2024 European reactor outage slashed Mo-99 output by 50%, forcing Korean clinics to ration 99mTc doses. Cardiology centers extended imaging windows and curtailed elective studies, undercutting procedure volumes. Reliance on aged foreign reactors exposes Korea to geopolitical and maintenance shocks, pressuring procurement budgets. Accelerated domestic actinium-225 and Ga-68 programs mitigate but do not yet eliminate risk. Supply instability remains the largest drag on the South Korea nuclear imaging market.
High Capital Cost of PET/MR Limiting Provincial Access
Integrated PET/MR systems exceed USD 5 million per unit, constraining adoption outside academic flagships. Provincial hospitals face longer payback horizons amid lower patient throughput. Government grants focus on PET/CT expansion, leaving PET/MR largely unfunded. The cost gap sustains modality imbalance, limiting comprehensive oncologic imaging in rural areas. Uneven equipment distribution restrains equal growth across the South Korea nuclear imaging market.
*Our forecasts treat driver/restraint impacts as directional, not additive. The impact forecasts reflect baseline growth, mix effects, and variable interactions.
Segment Analysis
By Product: Equipment Dominance Strengthens High-Resolution Imaging Adoption
The Equipment segment captured 53.05% of the South Korea nuclear imaging market share in 2025, underscoring provider commitment to high-resolution molecular imaging. Rapid rollout of digital detector technology improves sensitivity, letting hospitals justify premium pricing. Domestic Ga-68 production lowers tracer overhead, raising PET utilization rates across oncology and neurology. SPECT retains a strong installed base, yet faces competitive displacement in capital budgets. Equipment vendors increasingly bundle AI reconstruction to differentiate offerings, supporting higher average-selling prices.
Radioisotopes is projected to expand at an 8.01% CAGR on a value basis through 2031 as provincial hospitals favor its lower entry cost. Hybrid SPECT/CT upgrades extend the modality’s lifespan by improving anatomical localization in cardiology and thyroid imaging. The radioisotope sub-segment benefits from steady technetium-99m demand despite global supply volatility. Cyclotron-enabled copper-64 and gallium-68 pipelines diversify tracer options, reinforcing resilience. Overall, the South Korea nuclear imaging market continues to tilt toward PET while sustaining niche opportunities in SPECT and emerging therapeutic isotopes.

By Application: Oncology Leads While Neurology Gains Momentum
Oncology maintained a commanding 64.19% revenue share in 2025, reflecting Korea’s advanced multi-modality cancer care pathways. Proton and carbon-ion centers integrate diagnostic PET/CT into treatment planning, deepening procedure frequency per patient. Targeted alpha therapies guided by theranostic imaging expand addressable spend per case. Cardiology remains stable but secondary, awaiting broader tracer diversification.
Neurology shows the fastest acceleration with an 8.17% CAGR to 2031 as dementia screening becomes policy-backed. New amyloid and tau tracers coupled with AI analytics advance early diagnosis, pressing hospitals to add neuro-focused PET capacity. Thyroid imaging and therapy continue as steady-state niches supported by HANARO reactor-supplied I-131. The South Korea nuclear imaging market thus balances entrenched oncology leadership with rising neurological demand.
By End User: Academic Centers Propel Theranostics Research
Hospitals command 71.12% of the South Korea nuclear imaging market, leveraging integrated inpatient, outpatient, and surgical services. Flagship university hospitals serve as national referral hubs, operating multi-scanner suites that feed high daily throughput. Private facilities invest aggressively to retain high-acuity oncology and neurology cases in competitive urban corridors.
Academic and research institutes post an 8.03% CAGR through 2031, driven by translational theranostics programs and government R&D grants. Their proximity to cyclotrons and GMP radiochemistry labs positions them to pioneer actinium-225 and copper-64 trials. Dedicated diagnostic imaging centers fill urban scheduling gaps, particularly for PET/CT overflow. Collectively, these end-user dynamics reinforce sustained demand within the South Korea nuclear imaging market.
Geography Analysis
The Seoul metropolitan area hosts the highest density of PET/CT and cyclotron assets, anchoring more than two-thirds of national procedure volume. Flagship institutions—including Seoul National University Hospital and Korea University Medical Center—align clinical services with in-house tracer production, further cementing regional dominance. Concentration in Seoul accelerates innovation cycles, but also magnifies disparities with provincial hospitals.
Busan and surrounding Southeastern provinces represent the second growth pole, catalyzed by National University Hospital’s planned proton center and industrial links to isotope-production supply chains. Regional policy incentives, including corporate tax relief for medical-tourism facilities, spur private-sector imaging investments. However, capital intensity limits PET/MR penetration, and technologist scarcity persists outside major cities.
Rural districts remain underserved owing to long travel distances and limited equipment budgets. The Act on Integrated Support for Community Care encourages tertiary centers to deploy mobile imaging units and tele-nuclear-medicine platforms, yet execution lags due to transport-permit constraints. Addressing geographic imbalances will be crucial for equitable expansion of the South Korea nuclear imaging market.
Regulatory Landscape
Nuclear imaging equipment in South Korea falls under the Medical Devices Act, with the Ministry of Food and Drug Safety (MFDS) overseeing classification and market authorization. Devices are managed under a risk-based scheme (Class I to IV), where higher-risk products typically require MFDS pre-market approval. This structure shapes both time-to-market and post-market compliance expectations for PET/CT, SPECT/CT, and software-enabled upgrades.
Radiopharmaceuticals used for nuclear imaging follow a separate pathway under the Pharmaceutical Affairs Act. MFDS review (including NDA/IND pathways as applicable) runs alongside radioisotope production licensing and facility oversight by the Nuclear Safety and Security Commission (NSSC). Industry bodies such as the Korea Medical Devices Industry Association (KMDIA) have continued engaging regulators, including a May 2026 Regulatory Committee discussion on expanding acceptance of real-world evidence and easing certain change-approval requirements, which affects how vendors manage incremental hardware and software changes in imaging platforms.
Value Chain Analysis
The value chain runs from global OEMs supplying PET/CT and SPECT/CT systems, through domestic and institutional radioisotope production (reactor and cyclotron routes), radiopharmaceutical manufacturing and labeling, and controlled logistics, to delivery for hospitals and academic centers operating nuclear medicine departments. Upstream radioisotope availability is anchored by infrastructure such as the HANARO research reactor in Daejeon, while longer-term supply security initiatives are tied to projects such as the Gijang Research Reactor (KJRR) built for medical isotope production. Downstream demand is concentrated in large tertiary hospitals that integrate imaging, therapy planning, and clinical trials.
Domestic radiopharmaceutical players are expanding across diagnostic tracers, radioligand therapy, and CDMO services, intensifying competition among local companies including DuChemBio, SK biopharmaceuticals, and FutureChem. Clinical use is also shaped by hospital radiation safety governance and dose optimization practices, including the 2024 finalization and approval of National Diagnostic Reference Levels (DRLs) covering nuclear medicine and hybrid CT studies, which supports protocol standardization, scanner utilization, and procurement preferences for dose- and time-efficient systems.
Competitive Landscape
Global OEMs tightly hold modality leadership by combining equipment sales with structured service contracts and tracer-distribution alliances. GE HealthCare’s USD 183 million purchase of Nihon Medi-Physics secures regional radiopharmaceutical supply, reinforcing its PET/CT installed-base strategy. Siemens Healthineers fields the Biograph Trinion PET/CT with air-cooled architecture, aiming to lower facility retro-fit costs for private clinics. Philips embeds SmartSpeed AI into MRI to improve scan efficiency, positioning for cross-modal upsell .
Domestic firms seize white-space opportunities in therapeutics. SK Biopharmaceuticals’ actinium-225 pipeline with KIRAMS exemplifies synergistic research-to-manufacture capability . Korea Hydro & Nuclear Power and Framatome evaluate lutetium-177 production at Wolsong, leveraging existing reactor infrastructure . Smaller venture-backed players focus on AI workflow orchestration, addressing staffing bottlenecks rather than hardware.
Regulatory compliance under the Nuclear Safety Act imposes high entry barriers, favoring players with established quality systems. Service differentiation shifts toward end-to-end solutions—hardware, tracers, AI, and maintenance bundles—rather than price competition. Collectively, the top five companies capture roughly 55% of revenue, indicating a moderate concentration in the South Korea nuclear imaging market.
South Korea Nuclear Imaging Industry Leaders
-
Samyoung Unitech
-
GE Healthcare
-
FutureChem
-
IBA Radiopharma Solutions
-
NuCare Inc.
- *Disclaimer: Major Players sorted in no particular order
Market Opportunities and Future Outlook
A key whitespace is the coupling of domestic isotope capability with localized clinical validation and procurement, which reduces exposure to imported radioisotope disruptions that have previously constrained scheduling and throughput. On the supply side, KAERI receiving MFDS GMP certification (May 2025) for Sodium Iodide (I-131) liquid supports more standardized domestic supply to pharmaceutical manufacturers. KIRAMS securing NSSC approval (May 2024) to produce actinium-225 using a cyclotron supports theranostics programs that broaden the role of nuclear imaging from diagnosis into treatment selection and monitoring.
On equipment and workflow, hospitals and vendors are pushing higher-resolution, software-integrated imaging to support quantitative biomarkers and AI-enabled interpretation, particularly for neurology and oncology. Brightonix Imaging reported in July 2026 that its PHAROS system is installed or in demonstration at over 100 Korean medical institutions, including Seoul National University Hospital and Asan Medical Center, as it builds commercial traction for brain-dedicated PET in Korea. May 2026 first-in-human imaging results published in the Journal of Nuclear Medicine also reinforce the clinical positioning of high-resolution PET for neurological and oncological settings. These developments create room for OEMs and local innovators to compete on clinical performance, dose efficiency, and integrated analytics, while the parallelized MFDS IND and hospital IRB review process (noted as approximately 30 working days for IND processing) supports faster initiation of radiopharmaceutical and imaging-centric clinical studies in-country.
Recent Industry Developments
- July 2026: Brightonix Imaging advanced its AI-driven digital PET technology for global rollout, highlighting Korea-origin hardware and software integration in high-resolution PET. The development points to expanding commercialization pathways for domestic imaging innovation alongside established global OEMs, and strengthens reference-site visibility through deployments and demonstrations at major hospitals.
- May 2025: KAERI obtained GMP certification from the Ministry of Food and Drug Safety (MFDS) for its Sodium Iodide (I-131) liquid as a radioactive drug substance. This milestone supports more standardized domestic supply to pharmaceutical manufacturers and reinforces upstream resilience for nuclear medicine workflows that depend on consistent radiopharmaceutical availability.
- October 2024: A European reactor outage cut Mo-99 output by about 50%, forcing rationing of 99mTc doses in South Korea and disrupting routine nuclear cardiology and other SPECT-heavy schedules. The event exposed Korea's dependence on imported isotope supply and increased attention on domestic production programs and alternative tracer pipelines.
Research Methodology Framework and Report Scope
Market Definition and Coverage
This market covers the value generated in South Korea from nuclear imaging used for diagnosis, including the related imaging equipment and the radioisotopes (radiotracers) consumed for PET and SPECT procedures.
Scope exclusions: radiation therapy, non-nuclear diagnostic imaging (such as CT-only or MRI-only), and broader hospital services that are not directly tied to nuclear imaging equipment or radioisotope consumption are excluded.
Segmentation Overview
- By Product (Value)
- Equipment
- Radioisotopes
- SPECT Radioisotopes
- Technetium-99m (Tc-99m)
- Thallium-201 (Tl-201)
- Gallium-67 (Ga-67)
- Iodine-123 (I-123)
- Other SPECT Isotopes
- PET Radioisotopes
- Fluorine-18 (F-18)
- Rubidium-82 (Rb-82)
- Other PET Isotopes
- SPECT Radioisotopes
- By Application (Value)
- Cardiology
- Neurology
- Thyroid
- Oncology
- Other Applications
- By End User (Value)
- Hospitals
- Diagnostic Imaging Centres
- Academic & Research Institutes
Data Sources, Market Sizing, and Validation
Desk Research
Desk work started with public healthcare and trade references so we could frame the real demand pool and the supply constraints behind PET and SPECT use in South Korea. We used sources such as the Korea Disease Control and Prevention Agency, the Ministry of Health and Welfare, and the Health Insurance Review and Assessment Service for disease burden context, reimbursement direction, and utilization signals.
To anchor the equipment and isotope side, we also reviewed publications and statistics from sources such as the International Atomic Energy Agency, the OECD, and peer-reviewed nuclear medicine journals that discuss tracer usage patterns, scanner installs, and clinical practice. Alongside this, company annual reports, investor presentations, press releases, and credible media were used to cross check product mix and launch timing. We used a paid subscription for company financials and intelligence, plus an import export shipment-level database and patent databases, to validate supplier exposure and technology focus where there was uncertainty. These desk research sources are illustrative, and we also consulted other public references for data collection, validation, and clarification.
Primary Interviews and Surveys
Primary work was used to pressure test desk assumptions around PET versus SPECT mix, radiotracer sourcing reliability, and realistic pricing behavior across hospital and diagnostic center procurement. We spoke with clinical users, radiopharmacy and isotope supply experts, distributors, and service teams, and we balanced views across the main care hubs in the country so we could confirm what is actually being purchased and used.
Distribution of primary research fieldwork respondents
| Company type | Respondent position |
|---|---|
| Top tier: 27% | CXOs: 12% |
| Mid tier: 54% | Functional/Unit leaders: 38% |
| Smaller Players: 19% | Managers: 50% |
Market-Sizing & Forecasting
Our sizing logic starts with a top-down build where procedure activity and installed nuclear imaging capacity in South Korea are translated into annual equipment demand and radioisotope consumption, then valued using observed pricing ranges. We then corroborate the outputs with selective bottom-up checks, such as sampled average selling price times unit volumes for PET and SPECT systems, plus channel conversations on isotope volumes, before final totals are adjusted.
Key inputs used in the model include PET versus SPECT procedure mix, scanner installation and replacement cycles, radiotracer availability (for example, PET isotopes like F-18 and SPECT staples like Tc-99m), reimbursement and tender behavior where applicable, and the split of usage across hospitals, diagnostic imaging centers, and academic or research sites. When parts of the market are hard to observe directly, we use proxy ratios from comparable facilities and then validate the implied volumes using interview feedback.
For forecasting, we used scenario analysis supported by simple trend fitting on utilization drivers. The scenarios were mainly shaped by expected capacity additions, radiotracer supply stability, and clinical adoption in oncology, cardiology, neurology, and thyroid imaging. Assumptions were kept easy to trace so the model can be refreshed each year without relying on inaccessible data.
Data Validation & Update Cycle
Validation is done through triangulation across three layers, desk indicators, interview feedback, and internal consistency checks across volumes, prices, and end-user splits. If a year shows an unusual jump, the drivers are rechecked against installed base changes, tracer availability, and reimbursement or procurement shifts, and we re-contact respondents when the variance cannot be explained cleanly.
Before sign-off, the model is reviewed in steps by another analyst who checks formulas, units, and whether assumptions match observed market behavior. Reports are refreshed annually, and interim updates are triggered when there are material events such as supply disruptions, new capacity rollouts, or policy changes. Right before delivery, a final pass is completed so clients receive the most current view available.
Mordor Intelligence's South Korea Nuclear Imaging Market Size Compared Against Other Published Estimates
Published market sizes for South Korea nuclear imaging do not always match because the boundary between equipment revenue, radiotracer value, and procedure-related services is drawn differently across sources, and the base year and currency timing also vary. Even when the same terms are used, the implied mix of PET versus SPECT, plus what is counted as part of radiopharmaceutical value, can change the total substantially.
The benchmark table shows a clear spread, and in Mordor Intelligence's model the total is built from equipment plus radioisotopes tied to PET and SPECT imaging, rather than treating the market as a broader nuclear medicine bucket that can absorb adjacent therapeutics or wider service revenues. Differences also come from how fast average prices are assumed to change, whether older installed systems are treated as active demand drivers, and how often assumptions are rechecked against utilization and supply signals.
Benchmark comparison
| Source | Market Size | Gaps in Research Methodology |
|---|---|---|
| Mordor Intelligence | USD 195.82 M (2025) | |
| Industry Research Publisher A | USD 321.60 M (2025) | Uses a wider interpretation of nuclear imaging value, which appears to lift the 2025 total through broader inclusions and a longer forecast window that can embed faster assumed adoption. |
| Industry Research Publisher B | USD 113.82 M (2024) | Bases the estimate on a smaller 2024 starting point and likely applies narrower revenue capture and slower price or volume growth, which compresses the implied market compared with equipment plus isotope demand signals. |
Reading the three figures together, the gap is mainly explained by what gets counted around radiotracer value and how tightly the scope stays linked to PET and SPECT imaging demand in South Korea. By keeping the build tied to observable capacity, utilization, and pricing checks, we end up with a number that is easier to reconcile to real purchase and consumption behavior year to year.
Key Questions Answered in the Report
What is the projected value of the South Korea nuclear imaging market in 2031?
The market is forecast to reach USD 309.02 million by 2031, expanding at a 7.94% CAGR over 2026-2031.
Which imaging modality currently leads unit revenue in Korea?
Forecasts place the market at USD 309.02 million by 2031, reflecting an 7.94% CAGR over 2026-2031.
Which imaging modality currently leads unit revenue in Korea?
PET holds leadership, capturing 53.05% share of 2025 sales thanks to oncology demand and domestic Ga-68 supply.
Why is neurology considered a high-growth application area?
Expanded reimbursement for dementia tracers and AI-enabled image analysis support an 8.17% CAGR for neurology procedures to 2031.
How are domestic isotope programs affecting supply stability?
KAERIs production of actinium-225 and gallium-68 reduces reliance on European reactors, mitigating recent Mo-99 shortages.
What challenges limit market expansion in rural provinces?
High PET/MR capital costs, technologist shortages, and stringent isotope-transport rules slow equipment deployment outside metro areas.
Which end-user group is expected to record the fastest growth?
Academic and research institutes lead with an 8.03% CAGR as they scale theranostics trials and cyclotron partnerships.