
Market Overview
| Study Period | 2020 - 2031 |
|---|---|
| Forecast Data Period | 2026 - 2031 |
| Base Year Market Size (2025) | USD 44.38 Billion |
| Market Size (2026) | USD 48.25 Billion |
| Market Size (2031) | USD 73.33 Billion |
| Growth Rate (2026 - 2031) | 8.72 % |
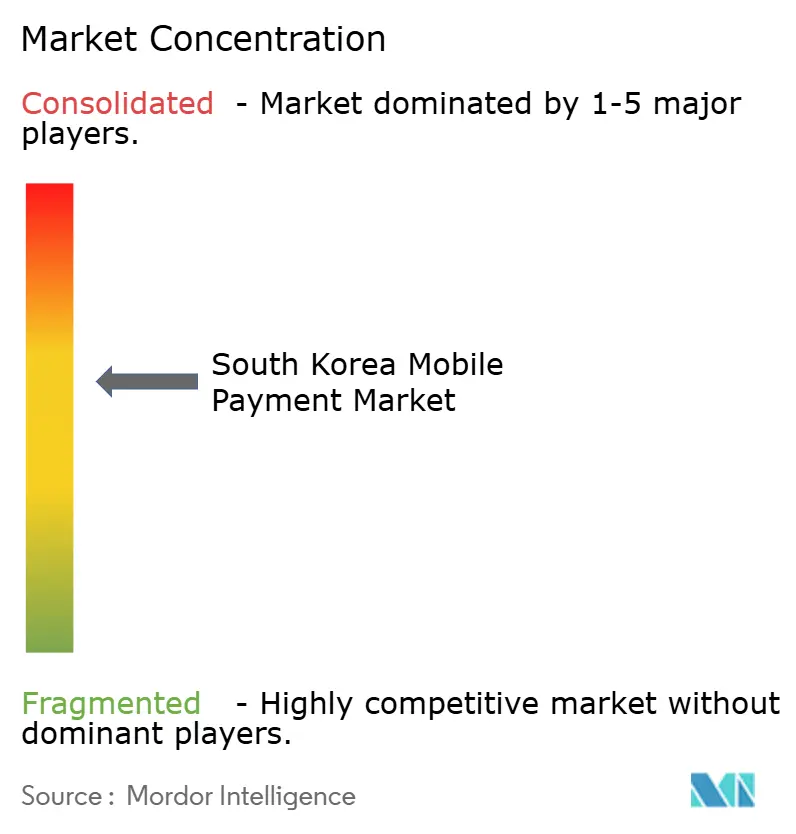
| Market Concentration | Medium |
Major Players *Disclaimer: Major Players sorted in no particular order Image © Mordor Intelligence. Reuse requires attribution under CC BY 4.0. | |
South Korea Mobile Payment Market Analysis by Mordor Intelligence
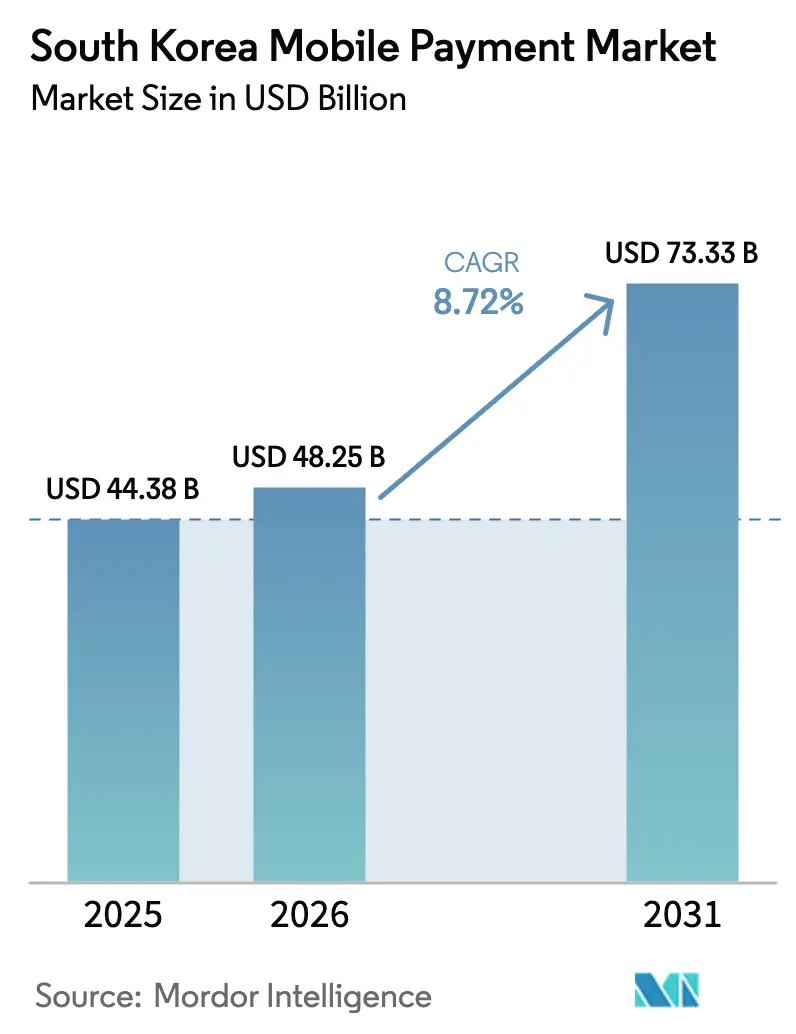
The South Korea mobile payment market size is expected to grow from USD 44.38 billion in 2025 to USD 48.25 billion in 2026 and is forecast to reach USD 73.33 billion by 2031 at 8.72% CAGR over 2026-2031. Structural change from card-centric purchasing to biometric-authenticated, super-app-embedded checkout continues as nationwide 5G coverage improves, interchange-fee caps favor QR-code rails, and proximity terminals reach quick-service outlets and mass-transit hubs. Samsung Pay’s retreat from Magnetic Secure Transmission (MST) toward tokenized NFC, combined with facial authentication, signals a broader pivot toward higher-security form factors. Super-apps Kakao Pay, Naver Pay, and Toss consolidate payments, mobility, and entertainment into single interfaces, pushing daily wallet transactions to 29.71 million in H1 2024. Government incentives, such as ZeroPay’s 0% merchant fees and VAT refunds, lower acceptance costs for micro-merchants, accelerating QR-code deployment in rural provinces.[1]
Key Report Takeaways
- By type, proximity payments accounted for 71.05% of the South Korea mobile payment market share in 2025, while the same segment is expanding at a 10.74% CAGR through 2031.
- By technology, NFC held 54.20% share of the South Korea mobile payment market size in 2025; QR-code payments are projected to grow at 10.21% CAGR to 2031.
- By application, retail and e-commerce led with 46.10% revenue share in 2025; transportation and mobility is advancing at a 9.86% CAGR through 2031.
- By end-user, millennials and Gen-Z represented 58.05% of transaction volume in 2025, while enterprises and SMEs show the highest projected growth at 10.05% CAGR to 2031.
Note: Market size and forecast figures in this report are generated using Mordor Intelligence’s proprietary estimation framework, updated with the latest available data and insights as of 2026.
South Korea Mobile Payment Market Trends and Insights
Drivers Impact Analysis*
| Driver | (~) % Impact on CAGR Forecast | Geographic Relevance | Impact Timeline |
|---|---|---|---|
| Surging 5G-enabled smartphone penetration | +2.1% | National, with early gains in Seoul Capital Area, Gyeonggi, Incheon | Short term (≤ 2 years) |
| E-commerce and quick-commerce boom | +1.8% | National, concentrated in Seoul Capital Area, Gyeonggi | Medium term (2-4 years) |
| Government incentives (ZeroPay VAT refunds, fee caps) | +1.5% | National, targeting SME-dense provinces (Chungcheong, Gyeongsang, Jeolla) | Medium term (2-4 years) |
| Super-app ecosystem integration (mobility, finance) | +1.9% | National, led by Seoul Capital Area, Gyeonggi | Long term (≥ 4 years) |
| Biometric authentication enabling high-ticket mobile payments | +1.3% | National, early adoption in Seoul Capital Area | Medium term (2-4 years) |
| Cross-border K-content micro-transactions | +0.7% | Global, with spillover to Asia-Pacific, North America, Europe | Long term (≥ 4 years) |
| Source: Mordor Intelligence | |||
Surging 5G-Enabled Smartphone Penetration
5G subscriptions surpassed 35 million in 2024, covering 67% of mobile lines and providing the low-latency backbone necessary for biometric-secured proximity payments.[2] The bandwidth allows real-time fraud scoring in milliseconds, lowering chargebacks and encouraging merchants to accept high-value wallet transactions. Samsung Wallet’s 2024 integration of mobile driver’s licenses showcases how fast networks merge identity and payments into one tap. PASS consortium data shows that 45 million mobile IDs have been issued, turning phones into government-recognized credentials. Compliance with the Personal Information Protection Act forces end-to-end encryption, raising entry barriers for new wallets yet building consumer trust.
E-Commerce and Quick-Commerce Boom
Mobile commerce reached USD 101 billion in 2023 and is on track for USD 185.4 billion by 2028, outpacing GDP and routing traffic toward in-app wallets. Coupang’s Rocket Delivery guarantees sub-2-hour drop-offs, so Kakao Pay and Naver Pay are embedded directly in product pages for one-click checkout. Food-delivery aggregators Baemin and Yogiyo have extended wallet acceptance to 200,000 restaurants, and BNPL users are forecast to double to 17.3 million by 2028, easing friction from high-ticket purchases.
Government Incentives (ZeroPay VAT Refunds, Fee Caps)
ZeroPay enrolled 1.2 million merchants by mid-2024, promising 0% transaction fees and 40% income-tax deductions for small businesses. Interchange caps at 0.5% for small sellers shrink issuer margins but democratize acceptance. The differential explains QR-code volumes growing faster than NFC, especially for low-ticket street-food and traditional-market transactions.[3] Automated VAT refunds through wallets further lighten administrative load for SME owners in rural provinces.
Super-App Ecosystem Integration
Kakao Pay processed KRW 167.3 trillion in payments in Q4 2024 by integrating ride-hailing, parking, and insurance services within its app. Naver Pay logged KRW 22.7 trillion in Q3 2025, boosted by Naver Webtoon’s 160 million monthly users who pay for digital comics and micropayments. Toss blends payment, brokerage, and crypto trading for 9.5 million users, enabling instant movement of investment gains into retail spend. These bundled services lock users in, raising friction for multi-homing.
Restraints Impact Analysis*
| Restraint | (~) % Impact on CAGR Forecast | Geographic Relevance | Impact Timeline |
|---|---|---|---|
| Rising cyber-fraud sophistication | -1.2% | National, with higher incidence in Seoul Capital Area due to transaction density | Short term (≤ 2 years) |
| Regulatory interchange-fee caps squeezing margins | -1.0% | National, acute pressure on card issuers (Shinhan, KB, Hana) | Medium term (2-4 years) |
| Demographic digital divide among seniors | -0.8% | National, concentrated in Gangwon, Jeju, rural Jeolla provinces | Long term (≥ 4 years) |
| Domestic market saturation limiting transaction-growth headroom | -0.9% | National, most pronounced in Seoul Capital Area, Gyeonggi | Medium term (2-4 years) |
| Source: Mordor Intelligence | |||
Rising Cyber-Fraud Sophistication
Phishing, SIM-swap, and deepfake voice scams climbed in 2024, leading the Financial Security Institute to mandate real-time anomaly detection and multi-factor checks for all wallets. Kakao Pay’s 2024 privacy inquiry heightened scrutiny on data-sharing practices. Platforms now assume liability for reimbursing fraud victims within 30 days, tightening margins for thin-capitalized fintechs. Behavioral biometrics countermeasures raise operational costs that only scale players can absorb.
Regulatory Interchange-Fee Caps Squeezing Margins
Caps of 0.5% for small merchants and 1.0% for mid-sized retailers removed KRW 1.2 trillion in issuer revenue in 2024. Card brands cut NFC terminal subsidies, accelerating the pivot to QR-code rails among street vendors. Fintechs that monetize through lending or insurance cope better with compressed payment yields, but smaller issuers face consolidation pressure as the Financial Services Commission signals deeper cuts in 2025.
*Our forecasts treat driver/restraint impacts as directional, not additive. The impact forecasts reflect baseline growth, mix effects, and variable interactions.
Segment Analysis
By Type: Proximity Dominance Fueled by Transit Integration
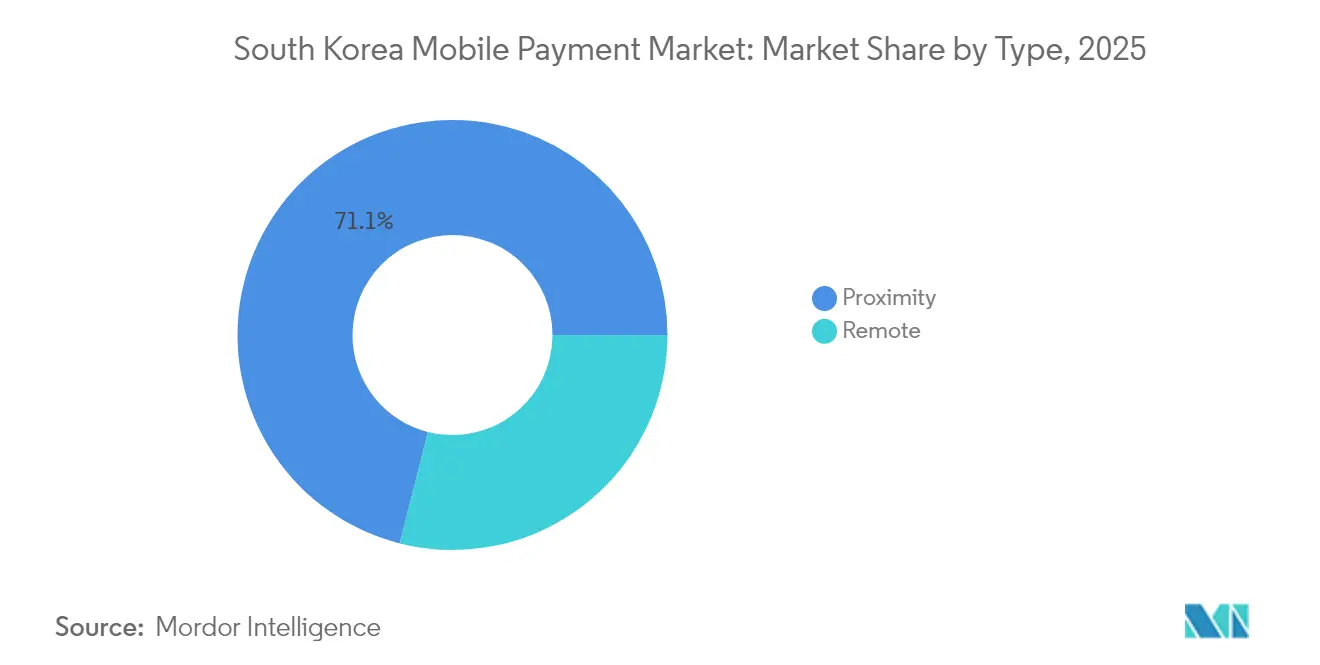
Proximity payments controlled 71.05% of the South Korea mobile payment market in 2025 and will expand at 10.74% CAGR to 2031, buoyed by Seoul Metro’s smartphone-tap turnstiles and the 50,000 quick-service outlets that now accept contactless transactions. The South Korea mobile payment market size for proximity channels is therefore scaling faster than remote methods, whose mobile-browser checkout abandonment remains above 25%.
Remote payments still matter for cross-border and subscription use cases but lose share as super-apps auto-populate credentials inside native environments. Samsung Pay’s sunsetting of MST clarifies market direction toward EMV-grade NFC and biometrics, with luxury merchants recording average mobile tickets of KRW 500,000 in 2024.

By Technology: QR-Code Gains Ground on Fee Arbitrage
NFC retained 54.20% South Korea mobile payment market share in 2025, yet QR-code volumes are pacing at 10.21% CAGR on the back of ZeroPay’s free-to-merchant model. The South Korea mobile payment market size tied to QR acceptance is especially strong among micro-merchants that cannot fund NFC terminals.
Daily wallet transactions reached 29.71 million in H1 2024, with QR usage high in traditional markets, while NFC dominates high-value retail, where EMV tokenization cuts fraud. Samsung Wallet’s biometric NFC and the FSC’s plan for a single national QR standard illustrate a convergence path, though competing specs keep universal acceptance on hold.
By Application: Transportation Surges as Mobility Integrates
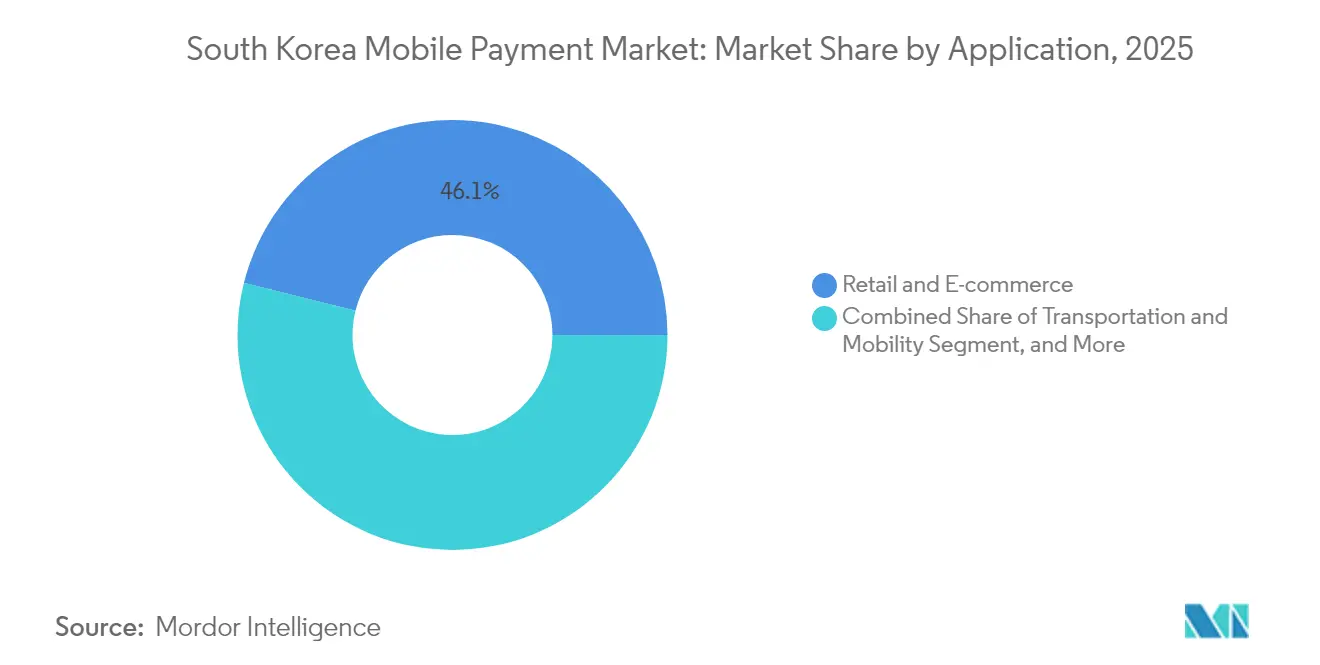
Retail and e-commerce led with 46.10% share in 2025, yet transportation and mobility display the fastest 9.86% CAGR, driven by Kakao Mobility rides, Seoul Metro taps, and parking-fee wallets. As a result, the South Korea mobile payment market size tied to commuting is catching up with retail.
Quick-service food, digital content, and gaming segments deepen wallet penetration by embedding one-click flows that trim cart abandonment by 18% versus credit cards. Municipalities are now piloting wallet payments for taxes and fines, hinting at a next leg of institutional adoption.
By End-User Segment: Enterprises Accelerate B2B Adoption
Millennials and Gen-Z generated 58.05% of 2025 transaction volume, but enterprises and SMEs post the highest 10.05% CAGR after Visa and KOTRA rolled out real-time export settlements. Consequently, the South Korea mobile payment market size for B2B flows is expanding faster than the consumer base.
Integrate Business and Kakao Pay for Business plug wallets into payroll and invoice systems, providing instant visibility into cash positions. Senior adoption remains limited, yet government-sponsored tutorials and larger-font interfaces are helping to close the gap.
Geography Analysis
The Seoul Capital Area generates over 50% of the transaction value, thanks to a 90% smartphone penetration rate and an early 5G rollout. Kakao Pay and Naver Pay derive 65% of their volumes from this region, utilizing it as a live lab for features such as face authentication and mobile IDs. Seoul Metro’s wallet-ready turnstiles act as an onboarding funnel for new users every rush hour.
Incheon’s Songdo business district pilots Alipay+ interoperability, allowing Chinese tourists to scan the same code at duty-free stores, resulting in KRW 450 billion in cross-border spending in 1H 2024. Gyeonggi’s factory belts push B2B wallet settlements through Visa’s KOTRA platform for just-in-time component payments. Chungcheong, Gyeongsang, and Jeolla provinces leverage ZeroPay to leapfrog card terminals in traditional markets.
Jeju and Gangwon lag due to aging populations, but tourism creates niche wallet use cases such as wearable wristbands at ski resorts and duty-free shops. Kakao Pay reports Jeju’s cross-border wallet spend jumped 28% year-over-year in 2024, reflecting rising tourist traffic.
Regulatory Landscape
South Korean mobile payments sit under oversight led by the Financial Services Commission (FSC) and the Financial Supervisory Service (FSS), with consumer data and security obligations shaped by the Personal Information Protection Act for wallet operators and their partners. A near-term compliance focus is the revised Electronic Financial Transactions Act (EFTA) framework for electronic payment gateway (PG) services, where the FSC opened a legislative and regulatory notice period from June 19 to July 29, 2026 to specify subordinate-statute requirements on settlement-fund safeguarding and PG capital standards.
Under the revised EFTA direction, PGs are required to externally manage 100% of unsettled funds via trust, deposit, or payment guarantee insurance, and large PGs (those exceeding KRW 30 billion in quarterly transaction volume) face a minimum capital requirement of KRW 2 billion, with official implementation referenced for December 17, 2026. In parallel, the Bank of Korea has been advancing work toward a dedicated settlement network supporting around-the-clock RTGS for offshore KRW settlement, reinforcing a policy bias toward regulated settlement rails as digital commerce volumes scale.
Value Chain Analysis
The value chain runs across (1) funding and account rails from banks and card issuers, (2) scheme and network layers (card networks, domestic clearing, and bank transfer rails), (3) payment gateway and processor services that connect merchants to acquiring and settlement, (4) wallet and super-app front ends (for example, Kakao Pay, Naver Pay, Samsung Wallet, and Toss), and (5) acceptance points across online checkout, NFC terminals, and QR-code deployments in physical retail, quick-service, and mobility environments. Samsung and handset OEMs provide secure elements and tokenization capabilities for NFC, while merchants, aggregators, and mobility platforms shape distribution through embedded checkout within commerce and transport apps.
Operational control and risk management have become more central as regulators tighten PG and multi-tier PG oversight. The National Assembly passed revisions to the Act on Electronic Financial Transactions in December 2025 that require PGs to externally manage 100% of unsettled funds and raise capital requirements for larger PGs. FSS guidelines effective January 2026 also introduced mandatory payment risk assessments when electronic financial service providers contract with lower-tier PG companies. On the demand side, Bank of Korea data highlighted scale in the back-end layer, with daily average PG service volume reported at KRW 1.55 trillion in 2025, which makes settlement-fund controls and partner due diligence decisive for ecosystem participation.
Competitive Landscape
The top four providers, Kakao Pay, Naver Pay, Samsung Pay, and Toss, command most of the transaction volume, leaving 25% to 21 smaller wallets, so the South Korean mobile payment market remains moderately concentrated. Super-apps gain stickiness by bundling finance, mobility, and content, while card issuers such as Shinhan and KB integrate their rails into third-party apps to remain visible.
Retail-backed wallets, such as Coupang Rocket Pay and SSG Pay, leverage first-party data to offer personalized cashback, effectively turning payments into retention levers. Start-ups, including Karrot Pay and Yanolja Pay, focus on vertical niches such as second-hand goods and travel bookings. Samsung’s 2024 biometric card patents hedge against device concentration by moving fingerprint sensors onto EMV cards, creating a device-agnostic fallback.
Regulatory oversight from the Financial Services Commission ensures fee transparency and interoperability, which raises compliance costs that favor capital-rich incumbents. White-space lies in cross-border remittances, wholesale tokenization pilots under BIS Project Agora, and Web3-based micropayments.
South Korea Mobile Payment Industry Leaders
-
Kakao Pay
-
Naver Corporation ( Naver Pay)
-
Samsung Electronics (Samsung Pay)
-
Viva Republica Co., Ltd. (Toss Payments)
-
NHN PAYCO Corp. (PAYCO)
- *Disclaimer: Major Players sorted in no particular order
Market Opportunities and Future Outlook
Cross-border acceptance and inbound-tourism payments are a clear whitespace where mobile wallets and national switches are shifting from isolated integrations toward interoperable QR. In April 2026, the Korea Financial Telecommunications and Clearings Institute (KFTC) commenced two-way QR payment services with Indonesia, creating a working model for expanding QR-based acceptance for travelers and merchants without requiring NFC terminal upgrades. This also fits merchant economics, since QR rails already align with lower hardware and deployment needs for micro-merchants, supporting higher acceptance density outside premium NFC-heavy retail.
A second opportunity centers on regulated tokenized settlement infrastructure that links banks, clearing, and wallet ecosystems for use cases beyond consumer checkout. In March 2026, the Bank of Korea began Phase 2 of Project Hangang with real-transaction testing for deposit tokens across nine commercial banks, and in July 2026 it scheduled live transactions for September 2026 in the wholesale CBDC pilot, including public sector operating expenses. Alongside these infrastructure pilots, tighter PG safeguarding rules under the revised EFTA, including 100% external management of unsettled funds and higher capital thresholds for large PGs, create room for compliant, well-capitalized processors and platforms to win merchant relationships as partners rationalize multi-tier PG arrangements.
Recent Industry Developments
- July 2026: Naver Pay, Kakao Pay, and Toss signed an MOU (July 9, 2026) with the Ministry of Interior and Safety, the Financial Supervisory Service, and the Korea Financial Telecommunications and Clearings Institute to connect to the resident registration card authenticity verification network. Linking major wallets to a national identity verification backbone strengthens onboarding and account-recovery flows and supports higher-assurance payment journeys for regulated use cases.
- October 2025: Visa and SK Telecom launched an eSIM-based tokenized mobile wallet for connected cars, enabling drivers of Hyundai’s 2026 models to authorize fuel, toll, and parking payments from the in-vehicle dashboard. The move extends mobile payment credentials into automotive embedded commerce and increases the relevance of tokenization and device-based authentication beyond smartphones.
- July 2025: Kakao Pay agreed to acquire BNPL specialist Finnq for KRW 620 billion (USD 470 million) to integrate installment financing into its super-app. This expanded Kakao Pay’s toolkit for higher-ticket purchases and merchant conversion, tightening the link between payments and credit services within a single user journey.
Research Methodology Framework and Report Scope
Market Definition and Coverage
For this methodology, the market covers the value of payments initiated through mobile devices in South Korea, spanning proximity and remote use cases, using common mobile payment technologies and both consumer and enterprise payment flows.
Scope exclusions: non-payment mobile banking activity that does not result in a completed payment transaction, such as balance checks and simple transfers, is excluded.
Segmentation Overview
- By Type
- Proximity
- Remote
- By Technology
- NFC (Near-Field Communication)
- QR-Code
- MST (Magnetic Secure Transmission)
- Tokenised Card and Other Technology
- By Application
- Retail and E-commerce
- Food and Quick-Service Delivery
- Transportation and Mobility
- Entertainment and Digital Content
- Utilities and Government Payments
- By End-User Segment
- Millennials and Gen-Z Consumers
- Gen-X Consumers
- Baby-Boomer Consumers
- Enterprises and SMEs (B2B Mobile Pay)
Data Sources, Market Sizing, and Validation
Desk Research
Desk research began with aligning definitions and confirming the demand pool for mobile payments in South Korea, before any calculations were finalized. Public statistics and policy releases were used to anchor digital payments adoption and infrastructure readiness, and the data was normalized into a consistent time series.
Common inputs were drawn from sources such as the Bank of Korea for payments trends, the Financial Services Commission and Financial Supervisory Service for regulatory and licensing context, Statistics Korea for consumer and retail activity indicators, and the Ministry of Science and ICT for digital and mobile infrastructure signals. Additional direction came from listed company filings and investor presentations, industry association publications, local press, patent databases for authentication and tokenization themes, and an import and export shipment-level database when hardware enablement needed a quick cross-check. These examples are not exhaustive, and additional public sources were used for data collection, validation, and clarification during the study.
Primary Interviews and Surveys
Primary inputs were collected through expert interviews and structured surveys across the payment ecosystem, including wallet providers, merchant-facing payment acceptance teams, banks, processors, and large merchants with a high mobile checkout mix. Interviews with channel-focused experts who track retail and e-commerce checkout behavior helped confirm technology splits and use-case growth patterns in South Korea.
Distribution of primary research fieldwork respondents
| Company type | Respondent position |
|---|---|
| Top tier: 30% | CXOs: 14% |
| Mid tier: 54% | Functional/Unit leaders: 35% |
| Smaller Players: 16% | Managers: 51% |
Market-Sizing & Forecasting
Sizing used a top-down and bottom-up workflow. First, national payment activity and digital commerce signals were used to reconstruct the mobile payment value pool, and then the totals were checked using selective roll-ups. Once the full market picture was assembled, the year-end USD market value was set as the final output.
Key inputs included mobile commerce share of online sales, smartphone and mobile internet usage indicators, merchant acceptance readiness (such as QR and NFC penetration), the proximity versus remote mix, and technology adoption markers like tokenization and biometric authentication. These variables were adjusted using primary feedback to reflect South Korea-specific conditions, including super-app usage and the shift in checkout toward in-app payments.
For forecasting, the approach relied mainly on scenario analysis supported by trend-based smoothing. The base case reflects expected adoption in retail and e-commerce, transportation and mobility payments, and recurring bill-pay behavior. Where bottom-up checks did not fully cover smaller acceptance channels, sampled average ticket sizes were used, along with assumed transaction growth ranges that were validated with interview inputs. Totals were then adjusted to stay consistent with the broader demand pool.
Data Validation & Update Cycle
Results were validated through multiple passes, starting with internal consistency checks across time series, segment splits, and implied growth rates. Model outputs were compared with independent signals, including published digital payments indicators, macro consumption patterns, and merchant acceptance cues. When anomalies appeared, the drivers were reviewed until the differences were explainable.
Before sign-off, assumptions were reviewed by another analyst, and large variances versus earlier editions triggered re-contact with selected respondents to confirm what changed. Reports are refreshed annually, with interim updates when material events occur, such as policy shifts or major changes in payment rails. Right before delivery, a final review pass is completed so clients receive the latest updated view.
Mordor Intelligence's South Korea Mobile Payment Market Sizing Compared With Other Published Estimates
Published market sizes for mobile payments in South Korea often differ because the underlying scope can shift, and the measurement unit is not always the same. Some sources track transaction value, others track revenue-like measures, and changes in base year assumptions and FX timing can affect the USD output.
The biggest gaps usually come from what counts as a mobile payment, how proximity versus remote payments are treated, and whether adjacent activity like pure mobile banking is blended into the total. Differences also show up when an estimate assumes faster QR migration or higher in-app checkout growth, without re-checking merchant acceptance and consumer behavior signals during the update cycle.
Benchmark comparison
| Source | Market Size | Gaps in Research Methodology |
|---|---|---|
| Mordor Intelligence | USD 44.38 B (2025) | |
| Trade Journal A | USD 50.60 B (2024) | Uses a transaction volume framing for 2024 and can mix online checkout heavy use cases without a clear split between mobile payment versus broader mobile commerce activity, which changes what is being counted year to year. |
| Industry Publisher B | USD 47.90 B (2030) | Reports a far-out year figure and applies a high-growth curve over 2024 to 2030, while disclosure on technology and use-case boundaries is limited, making it hard to reconcile proximity, remote, and non-payment app activity. |
The table shows a spread mainly driven by the unit of measurement and the year referenced. In Mordor Intelligence's model, the market is counted as mobile-initiated payment value in USD with proximity and remote use cases kept within the same definition, and non-payment mobile banking actions are not added. With this setup, the final number stays traceable to adoption indicators, and it can be re-checked when assumptions like technology mix or checkout behavior shift.
Key Questions Answered in the Report
What is the current value of the South Korea mobile payment market?
The market is valued at USD 48.25 billion in 2026.
How fast is the sector growing?
It is forecast to expand at a 8.72% CAGR through 2031.
Which payment type holds the largest share?
Proximity payments, with 71.05% share in 2025.
Why are QR-code payments expanding quickly?
ZeroPay’s 0% merchant fees and low hardware costs drive adoption among micro-merchants.
Which region records the highest transaction volume?
The Seoul Capital Area contributes more than half of national wallet transaction value.