
Market Overview
| Study Period | 2020 - 2031 |
|---|---|
| Forecast Data Period | 2026 - 2031 |
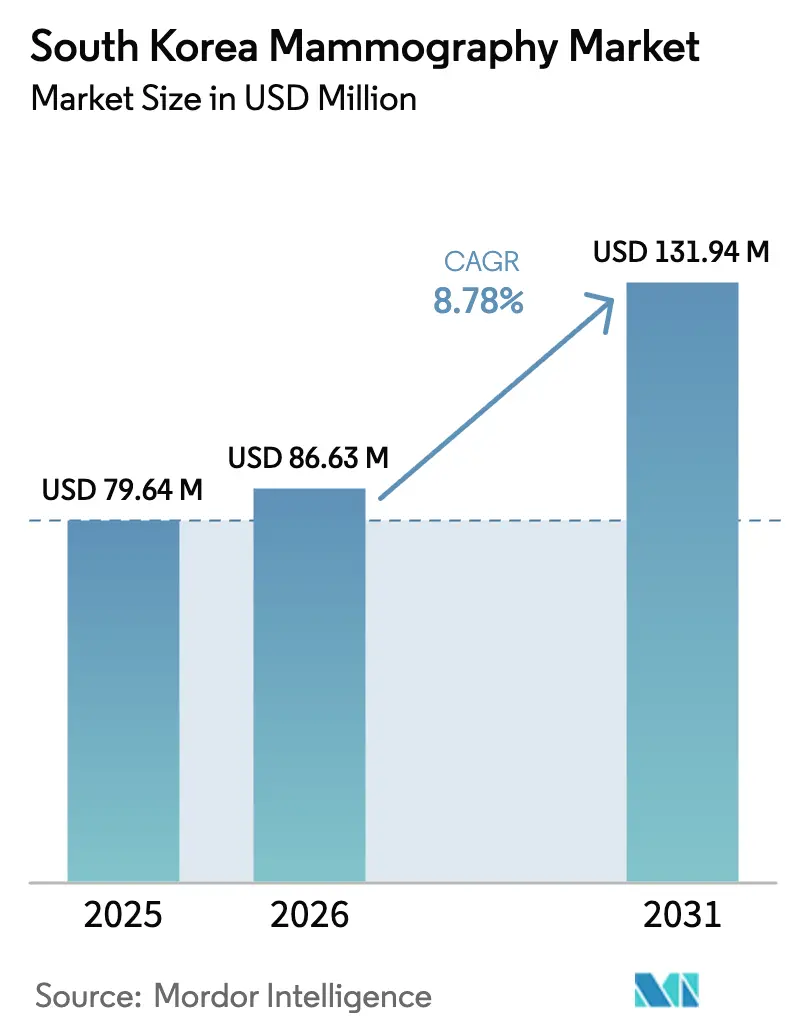
| Base Year Market Size (2025) | USD 79.64 Million |
| Market Size (2026) | USD 86.63 Million |
| Market Size (2031) | USD 131.94 Million |
| Growth Rate (2026 - 2031) | 8.78 % |
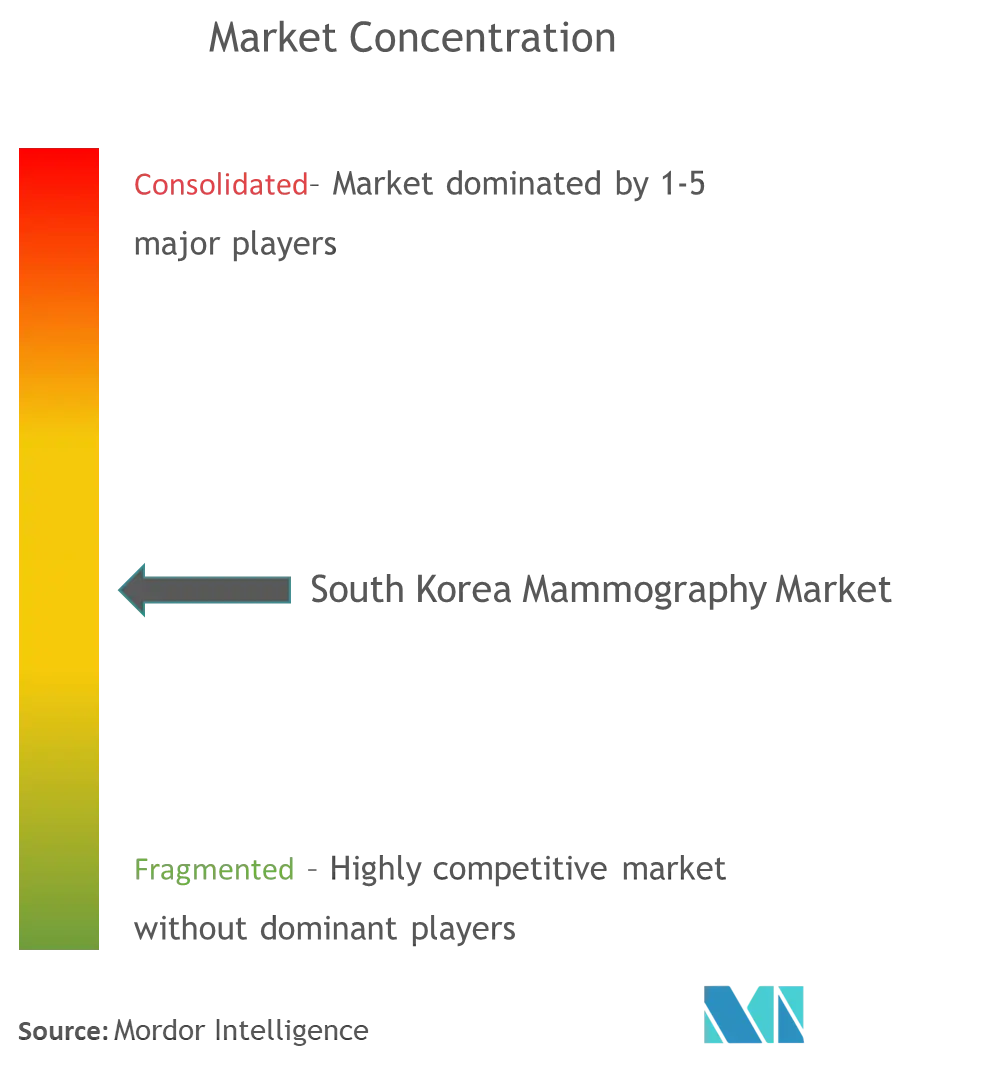
| Market Concentration | Medium |
Major Players *Disclaimer: Major Players sorted in no particular order Image © Mordor Intelligence. Reuse requires attribution under CC BY 4.0. | |
South Korea Mammography Market Analysis by Mordor Intelligence
South Korea mammography market size in 2026 is estimated at USD 86.63 million, growing from 2025 value of USD 79.64 million with 2031 projections showing USD 131.94 million, growing at 8.78% CAGR over 2026-2031. Demographic aging, expanded National Cancer Screening Program (NCSP) reimbursement, and rapid uptake of artificial-intelligence (AI) tools are the central forces propelling the South Korea mammography market. Digital breast tomosynthesis (DBT) is replacing 2-D mammography as the clinical baseline, while 5G-enabled remote quality-assurance (QA) frameworks reduce geographic gaps in image interpretation. Hospitals still anchor procurement volumes, yet specialty breast clinics are drawing share by offering patient-centric workflows and shorter waiting times. Competitive positioning is shifting toward software-led value propositions, with local vendors leveraging regulatory familiarity to accelerate go-to-market cycles.
Key Report Takeaways
- By product type, digital mammography captured 61.72% of South Korea mammography market share in 2025; Breast tomosynthesis is forecast to expand at a 10.05% CAGR, the fastest rate among product segments through 2031.
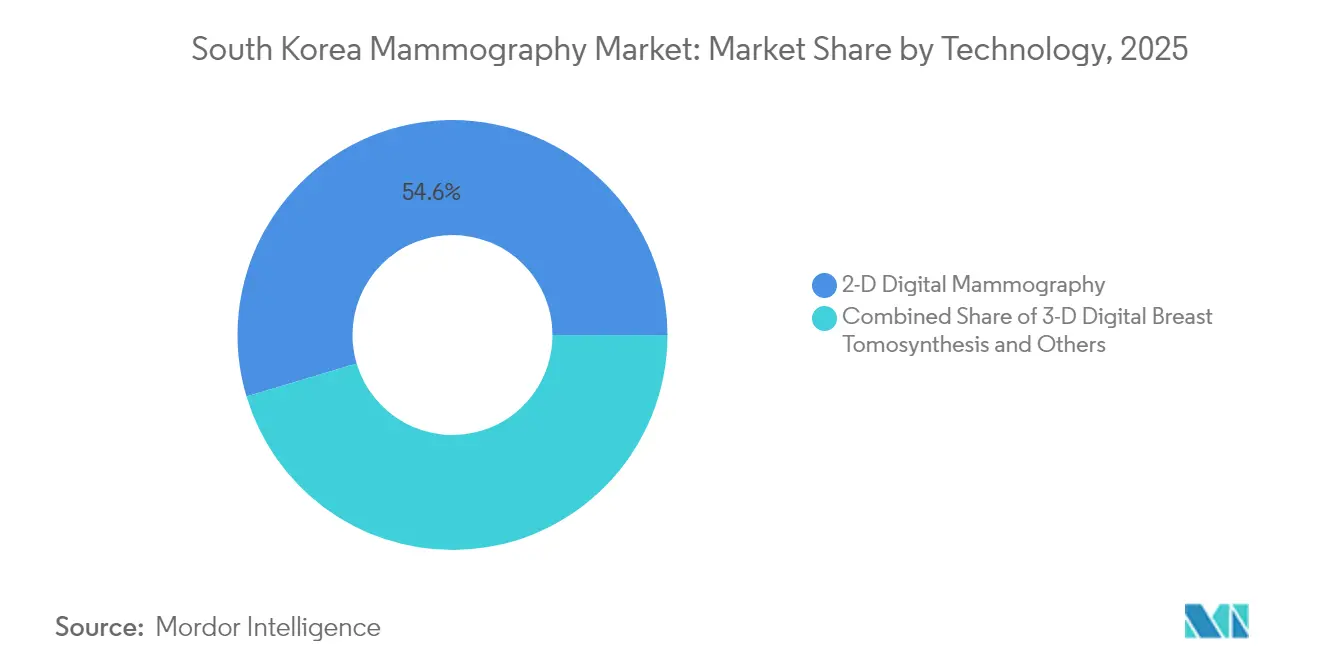
- By technology, 2-D systems held 54.62% share in 2025, while 3-D DBT advances at 9.83% CAGR to 2031.
- By end user, hospitals accounted for 48.25% of South Korea mammography market size in 2025, whereas specialty breast clinics are growing at 9.42% CAGR.
Note: Market size and forecast figures in this report are generated using Mordor Intelligence’s proprietary estimation framework, updated with the latest available data and insights as of 2026.
South Korea Mammography Market Trends and Insights
Drivers Impact Analysis*
| Driver | (~) % Impact on CAGR Forecast | Geographic Relevance | Impact Timeline |
|---|---|---|---|
| Rising breast-cancer incidence | +2.1% | National, highest in urban districts | Long term (≥ 4 years) |
| NCSP biennial screening reimbursement | +1.8% | National, stronger in rural regions | Medium term (2-4 years) |
| Reimbursement for digital breast tomosynthesis | +2.3% | Early uptake in Seoul Capital Area | Short term (≤ 2 years) |
| AI-powered computer-aided detection | +1.9% | Tertiary hospitals nationwide | Medium term (2-4 years) |
| Blood-based screening tests | +0.8% | Pilot sites in metropolitan areas | Long term (≥ 4 years) |
| 5G-enabled rural QA networks | +0.4% | Remote provinces outside Seoul | Medium term (2-4 years) |
| Source: Mordor Intelligence | |||
Rising Incidence of Breast Cancer Among Women
Breast-cancer cases reached 33,335 in 2025, making the disease the most common malignancy among Korean women [1]. Incidence rose 205.26% between 1990 and 2021, far outpacing regional averages. The 5-year relative survival rate climbed to 93.6% for the 2015-2019 cohort, underscoring the screening program’s clinical payoff. Women now delay childbirth and concentrate in urban settings, two established risk correlates. As the 50-59-year cohort expands, demand for mammography units rises, strengthening the South Korea mammography market.
Expansion of NCSP Reimbursement for Biennial Screening
NCSP now covers 90% of the cost for biennial mammography among women aged ≥ 40 years, eliminating out-of-pocket fees [2]. Participation improved, recall rates fell from 17.2% in 2009 to 11.2% in 2020, and detection rates grew from 1.5 to 3.1 per 1,000 screens. Rural uptake rose fastest, narrowing historical access gaps. Policymakers are assessing ultrasound reimbursement for dense breasts, which could elevate screening throughput further.
Rapid Switch-Over to Digital Breast Tomosynthesis Since 2023 Reimbursement
Parity reimbursement for DBT began in 2023, enabling facilities to justify capital outlays of USD 400,000–600,000 per unit. DBT identifies 20–65% more invasive cancers than 2-D mammography, a critical advantage in a population where dense breast tissue exceeds 70% prevalence. Seoul leads adoption, but provincial hospitals follow as reimbursement de-risks investment.
AI-Powered CAD Improving Detection & Workflow
Lunit INSIGHT achieved area-under-curve performance of 0.91 in DBT datasets. In the AI-STREAM prospective study, radiologists aided by AI detected 140 cancers versus 123 without assistance, without increasing recall. AI also improves specificity to 93% in extremely dense breasts, tackling a key limitation of human readers. Hospitals integrate AI to manage 15-20% annual growth in screen volumes amid flat radiologist supply.
Blood-Based Tests Expanding Screening Funnel
MASTOCHECK measures three protein biomarkers and targets women with dense tissue where mammography is less sensitive. Pilot coverage inside urban clinics enlarges the screening funnel, creating supplementary demand for diagnostic mammography follow-up.
5G-Enabled Remote QA Networks for Rural Clinics
Samsung Medison and Lunit run QA networks that transmit DBT files via 5G, allowing urban radiologists to review rural images within minutes. Mobile connectivity cuts diagnostic reading time by 50%, reducing travel burdens on patients and opening new device-placement opportunities.
Restraints Impact Analysis*
| Restraint | (~) % Impact on CAGR Forecast | Geographic Relevance | Impact Timeline |
|---|---|---|---|
| Radiation-dose concerns in women aged 40s | −1.2% | Urban, higher education levels | Short term (≤ 2 years) |
| Uneven 3-D system distribution | −0.9% | Rural provinces | Medium term (2-4 years) |
| Patient discomfort favoring ultrasound/blood | −0.7% | National, younger demographics | Long term (≥ 4 years) |
| Escalating PACS storage for DBT files | −0.5% | High-volume facilities | Medium term (2-4 years) |
| Source: Mordor Intelligence | |||
Radiation-Dose Concerns Among Women in Their 40s
Average scatter radiation is only 0.87 mGy at the sternum, yet fear persists. Educational campaigns and dose-reduction software seek to reassure patients, but anxiety suppresses screening intent, constraining near-term uptake.
Patient Discomfort Shifting Preference to Ultrasound/Blood Tests
Surveys show greater comfort with ultrasound than DBT. Clinics now bundle ultrasound and blood tests with mammography to retain patient loyalty, diluting pure mammography volume growth.
*Our forecasts treat driver/restraint impacts as directional, not additive. The impact forecasts reflect baseline growth, mix effects, and variable interactions.
Segment Analysis
By Product Type: Digital Dominance Drives Premium Migration
The South Korea mammography market size for digital equipment led all product categories, holding 61.72% share in 2025. Analog units fade as hospitals modernize electronic medical record (EMR) systems that require digital images. Breast tomosynthesis revenue will grow at a 10.05% CAGR, supported by reimbursement parity and superior cancer-detection metrics. Although capital costs remain steep, workflow gains and lower recall rates shorten return-on-investment periods. Niche categories such as contrast-enhanced mammography gain clinical traction where specificity is paramount. The Ministry of Food and Drug Safety (MFDS) now requires AI integration disclosure under the 2025 Digital Medical Products Act, further tilting demand toward smart digital platforms.
Legacy 2-D systems continue to serve lower-volume clinics, yet replacement cycles accelerate as DBT becomes the clinical baseline. Corporate procurement teams justify premium equipment by citing 20–65% higher invasive detection rates, especially relevant for the 70% dense-breast prevalence cohort. Digital breast tomosynthesis adoption aligns with national AI strategies, amplifying software subscriptions linked to each installed unit. Vendors now bundle cloud PACS storage and AI-CAD licences, transforming one-time hardware sales into recurring revenue streams.


By End User: Specialty Clinics Capture Growth Premium
Hospitals commanded 48.25% of South Korea mammography market share in 2025, anchored by comprehensive oncology pathways. Yet specialty breast clinics post the fastest 9.42% CAGR as patients seek streamlined experiences and faster report turnaround. Clinics often install DBT or contrast-enhanced units earlier than public hospitals, positioning themselves as technology leaders. Diagnostic imaging centers remain essential in mid-sized cities but feel margin pressure as hospitals expand outpatient wings.
Specialty providers differentiate by integrating AI-CAD, patient-comfort paddles, and rapid online scheduling. Hospitals counter by building dedicated breast-imaging suites that inherit multidisciplinary referral flows. Imaging centers invest in mobile DBT units to reach employer-sponsored screenings, yet their share erodes where clinics and hospitals overlap. Consequently, procurement strategies diverge: hospitals prioritize scalability, clinics emphasize premium experience, and imaging centers weigh cost versus service differentiation.
By Technology: 3-D Tomosynthesis Reshapes Clinical Standards
Two-dimensional systems retained 54.62% installed share in 2025, yet 3-D tomosynthesis is advancing at 9.83% CAGR. Evidence shows DBT cuts false positives and improves detection in dense breasts, underpinning rapid replacement of 2-D fleets. Additional modalities such as contrast-enhanced mammography and automated breast ultrasound (ABUS) fill diagnostic niches but remain smaller contributors.
AI-enabled DBT platforms like Lunit INSIGHT received FDA 510(k) in 2023, boosting domestic credibility and export opportunities. Vendors now deliver integrated packages pairing DBT hardware with AI subscriptions, PACS storage, and on-site training. MFDS approval pathways under the Digital Medical Products Act shorten time-to-market for such combined offerings. Hospitals prefer these turnkey platforms because they minimize vendor coordination and accelerate staff competency.
Geography Analysis
Seoul Capital Area hosts the densest cluster of DBT installations, yet 19.8% of breast-cancer patients still travel from other provinces for initial treatment. Metropolitan secondary cities such as Busan, Daegu, and Incheon intensify upgrades to stem this medical tourism. Expanded 5G networks enable remote QA workflows, allowing provincial radiologists to consult Seoul experts without patient transfer.
Regional cancer-detection rates vary; metropolitan screening participation outruns rural areas, yet government subsidies for mobile DBT vans aim to narrow gaps. Provincial administrations offer tax incentives for clinics adopting AI-integrated devices. Diagnostics firms trial telerobotic ultrasound systems that connect local sonographers with off-site radiologists, further decentralizing care.
The South Korea mammography market increasingly emphasizes distributed service delivery. MFDS now streamlines approval for standardized DBT units to facilitate rural deployment. Combined with cloud-based AI and teleconsultation, this policy environment supports faster technology diffusion beyond Seoul.
Regulatory Landscape
Medical devices used for mammography in South Korea are supervised by the Ministry of Food and Drug Safety (MFDS) under the medical-device permission and review framework, with additional oversight for clinical use and imaging safety under Ministry of Health and Welfare (MOHW) rules covering diagnostic radiation generators. On July 18, 2025, a partial revision to the MOHW Rule on Safety Management of Diagnostic Radiation Generators took effect, tightening expectations around safety management and reinforcing routine QA obligations for facilities operating mammography systems.
Quality management for mammography performance is also supported by Korean Standards (KS), including KS C IEC 61223-2-10 for constancy testing, which keeps ongoing checks aligned with internationally recognized QA practices. For software-led platforms, MFDS pathways such as the Innovative Medical Device designation (introduced in 2017) are used to pursue priority review for AI software-as-a-medical-device, while coverage-relevant clinical validation is shaped by New Health Technology Assessment processes led by NECA and its nHTA committee for technologies seeking formal recognition in practice.
Value Chain Analysis
The value chain runs from global system manufacturers (including Hologic, GE HealthCare, Siemens Healthineers, Fujifilm, and Planmed) to local device and software participants, with domestic firms such as Medi-Future (established 2006) supporting the installed base and localization needs. Upstream inputs include detector components, X-ray tubes, and workstation hardware, while software suppliers provide PACS connectivity, cloud storage, and AI-CAD modules that are increasingly procured alongside DBT upgrades.
Downstream, hospitals and specialty breast clinics serve as the primary procurement and utilization nodes, and leading tertiary centers function as clinical validation environments that support licensing and algorithm development for AI-enabled workflows. Adjacent suppliers can also influence modality adoption, for example through contrast agent availability (such as Bayer Korea's Ultravist) that enables contrast-enhanced mammography procedures where implemented, adding procurement touchpoints beyond core imaging equipment (injectors, consumables, and protocol training) and broadening service and maintenance revenue for vendors and distributors.
Competitive Landscape
Market concentration is moderate. Global hardware leaders—Hologic, GE HealthCare, Siemens Healthineers—anchor high-end equipment portfolios. Domestic innovators such as Lunit and Samsung Medison differentiate with AI algorithms optimized for Korean dense-breast demographics. The locus of competition is shifting from hardware to holistic breast-health platforms that integrate imaging, analytics, and workflow orchestration.
In May 2024, Lunit acquired Volpara Health Technologies, expanding its installed base to 3,000 global sites and adding volumetric-density analytics to its platform [3]. Samsung Medison leverages 5G connectivity to deliver remote QA for rural clinics. Hologic continues strategic M&A, acquiring a breast-care rival for USD 310 million in 2024 to broaden its portfolio. Meanwhile, Bertis promotes its MASTOCHECK blood test, positioning as a complementary screen rather than a direct substitute.
White-space opportunities persist in rural service models, PACS optimization, and multimodal screening bundles. Compliance hurdles under the Digital Medical Products Act favor incumbents with established regulatory staff. As AI modules become table stakes, service contracts and data-management analytics emerge as the next competitive battleground.
South Korea Mammography Industry Leaders
-
Siemens AG
-
Fujifilm Holdings Corporation
-
Hologic Inc.
-
Planmed OY
-
GE Healthcare
- *Disclaimer: Major Players sorted in no particular order
Market Opportunities and Future Outlook
A key whitespace is expanding advanced diagnostic mammography beyond baseline screening, supported by formal recognition of new techniques. In March 2026, the MOHW recognized contrast-enhanced mammography (CEM) as a new medical technology after safety and efficacy review routed through NECA and the nHTA committee, which establishes a structured pathway for hospital adoption, protocol standardization, and related equipment bundles (CEM-capable mammography, injectors, and contrast supply).
Software-led differentiation is another practical opportunity as facilities manage higher image volumes and DBT data burdens while maintaining QA and diagnostic throughput. MFDS mechanisms such as the Innovative Medical Device designation, along with the track record of AI mammography tools (for example, Lunit's mammography AI approval in 2021), support faster commercialization cycles for AI-CAD and workflow tools integrated with mammography platforms. Policy debate and research activity around supplemental screening for dense breast tissue, cited at 83% prevalence in Korean women, reinforces demand for multimodal pathways (mammography plus adjunct technologies) and gives vendors room to package DBT, AI, and follow-up diagnostic workflows tailored to dense-breast populations.
Recent Industry Developments
- July 2026: Olive Healthcare and Hologic Korea enter into memorandum of understanding (MOU) to jointly validate the clinical utility of the breast lesion evaluation device Senoview with Hologic mammography systems. The collaboration aims to validateSenoview in conjunction with existing systems to streamline imaging workflows. Strengthens integrated hardware and software offerings to expand 3D mammography adoption in Korea.
- December 2025: Hologic Korea designates Yonsei With U Surgery Clinic as Center of Excellence to foster 3D mammography adoption and clinical training. The COE designation supports regional training programs and clinical exposure to next generation imaging. Establishes regional hubs to standardize 3D mammography practice and accelerate market expansion for Hologic platforms in South Korea.
- November 2025: Hologic Korea signs a COE agreement with Sungmo Doctor You Surgery Clinic to integrate advanced 3D mammography technology and foster clinical research collaboration. The arrangement broadens access to state of the art imaging and clinical studies across the network. Broadens clinical research and training network to drive adoption of 3D imaging across more sites.
Research Methodology Framework and Report Scope
Market Definition and Coverage
This market covers revenue earned in South Korea from mammography systems and related software that are used to screen and diagnose breast conditions in hospitals, clinics, and imaging centers, and it is measured in current USD.
Scope exclusions: We exclude breast ultrasound, MRI, biopsy and pathology tools, general radiography equipment, and service-only contracts that are not bundled with mammography system sales.
Segmentation Overview
- By Product Type
- Digital Systems
- Analog Systems
- Breast Tomosynthesis (3-D)
- Other Product Types
- By End User
- Hospitals
- Specialty Breast Clinics
- Diagnostic Imaging Centers
- By Technology
- 2-D Digital Mammography
- 3-D Digital Breast Tomosynthesis
- Others
Data Sources, Market Sizing, and Validation
Desk Research
Desk work starts with building a clean demand and policy context, since screening rules and reimbursement often shape purchase timing in imaging. We review public sources such as the Korea Disease Control and Prevention Agency screening guidance, Ministry of Health and Welfare notices, Health Insurance Review and Assessment Service reimbursement materials, OECD health statistics, and GLOBOCAN or peer reviewed cancer epidemiology literature for incidence and age cohort trends.
To keep the supply side realistic, we also use sources such as regulatory and device registration disclosures, hospital procurement and tender announcements, and financial disclosures and presentations from manufacturers with meaningful Korea exposure. Where available, we cross check import and export signals using an import and export shipment-level database, and we sanity check patent activity using a patent database to understand where capability upgrades may be moving. These desk sources are not exhaustive, and we relied on additional public documents and datasets to fill gaps, validate assumptions, and clarify the final scope.
Primary Interviews and Surveys
Primary work focuses on confirming what the desk sources cannot fully show, which is the real split between screening and diagnostic use, replacement cycles, and how quickly sites shift from 2D to digital and tomosynthesis. We speak with radiology department users, imaging administrators, distributors, and service partners to validate utilization patterns, typical pricing movement, and procurement triggers linked to national screening and accreditation requirements.
Distribution of primary research fieldwork respondents
| Company type | Respondent position |
|---|---|
| Top tier: 38% | CXOs: 13% |
| Mid tier: 46% | Functional/Unit leaders: 40% |
| Smaller Players: 16% | Managers: 47% |
Market-Sizing & Forecasting
Sizing is built using a top-down and bottom-up blend, with the main spine coming from a demand pool tied to South Korea screening eligible population, observed screening frequency, diagnostic follow up rates, and site level equipment utilization. Those volumes are then converted into revenue using a structured pricing ladder that reflects modality mix (2D, digital, and tomosynthesis), average system replacement timing, and the share of new installs versus upgrades.
To keep the totals grounded, we corroborate the model with selective bottom-up checks such as a roll up of visible installations at major care settings, channel checks on annual shipments, and sampled average selling price ranges for new systems and add-on components. Forecasting is carried out using scenario analysis supported by primary inputs, where screening participation, aging female population share, reimbursement stability, and capital budget cycles are treated as the main moving parts. When a bottom-up datapoint is missing for a smaller channel, we backfill using peer facility benchmarks and then re-test the output against expected penetration and replacement logic.
Data Validation & Update Cycle
Validation is done through several passes so the final number matches real world signals and does not drift due to one weak input. We compare the model output against independent checks such as screening program cadence, hospital capital spending direction, and trade flow or procurement visibility, and then outliers are reviewed before sign off.
If interview feedback conflicts with the desk picture, we re-contact respondents and revisit assumptions like modality share, replacement age, and pricing progression until the mismatch is explained. Reports are refreshed annually, and interim updates are triggered when there are material events such as reimbursement changes, guideline updates, or step changes in adoption of newer mammography formats. Right before delivery, an analyst runs a fresh review so clients receive the latest updated view.
Mordor Intelligence's South Korea Mammography Market Size Compared With Other Published Estimates
It is normal to see different market sizes for the same topic, because the boundaries can shift between equipment-only revenue and a wider definition that blends in software, services, or adjacent breast imaging. Timing also matters, since some estimates anchor to a different base year, apply a different currency conversion point, or use a long range forecast that smooths out short term procurement cycles.
Key gap drivers in this market usually come from how 2D, digital, and tomosynthesis are counted, and whether replacements are separated from new installations across hospitals versus specialty clinics. By tracking modality mix and refresh triggers at major care sites, Mordor Intelligence keeps the 2025 value tied to a defined equipment demand pool, instead of inflating totals with broader diagnostic imaging spend or multi-year bundled contracts.
Benchmark comparison
| Source | Market Size | Gaps in Research Methodology |
|---|---|---|
| Mordor Intelligence | USD 79.64 M (2025) | |
| Regional Consultancy A | USD 96.00 M (2025) | The estimate appears to include a wider breast imaging basket and applies higher average selling prices by treating tomosynthesis as the default across most placements, which lifts revenue in the base year. |
| Trade Journal B | USD 187.40 M (2026) | This figure is positioned as mammography equipment, but it uses a later base year and likely folds in longer replacement and upgrade cycles plus broader site coverage, which pushes the starting value upward. |
Taken together, the spread is mostly explained by boundary choices and timing, rather than a disagreement on the direction of demand. Our approach stays traceable to screening participation, utilization, replacement cadence, and modality pricing, so the total can be repeated and stress tested when assumptions change.
Key Questions Answered in the Report
How big is the South Korea Mammography Market?
The South Korea Mammography Market size is expected to reach USD 86.63 million in 2026 and grow at a CAGR of 8.78% to reach USD 131.94 million by 2031.
How fast is breast tomosynthesis growing in South Korea?
Breast tomosynthesis revenue is rising at a 10.05% CAGR, the fastest among product categories.
Who are the key players in South Korea Mammography Market?
Siemens AG, Fujifilm Holdings Corporation, Hologic Inc., Planmed OY and GE Healthcare are the major companies operating in the South Korea Mammography Market.
Which end-user segment is expanding quickest?
Specialty breast clinics post the highest growth at a 9.42% CAGR through 2031.