
Market Overview
| Study Period | 2020 - 2031 |
|---|---|
| Forecast Data Period | 2026 - 2031 |
| Base Year Market Size (2025) | USD 328.89 Million |
| Market Size (2026) | USD 346.39 Million |
| Market Size (2031) | USD 448.71 Million |
| Growth Rate (2026 - 2031) | 5.32 % |
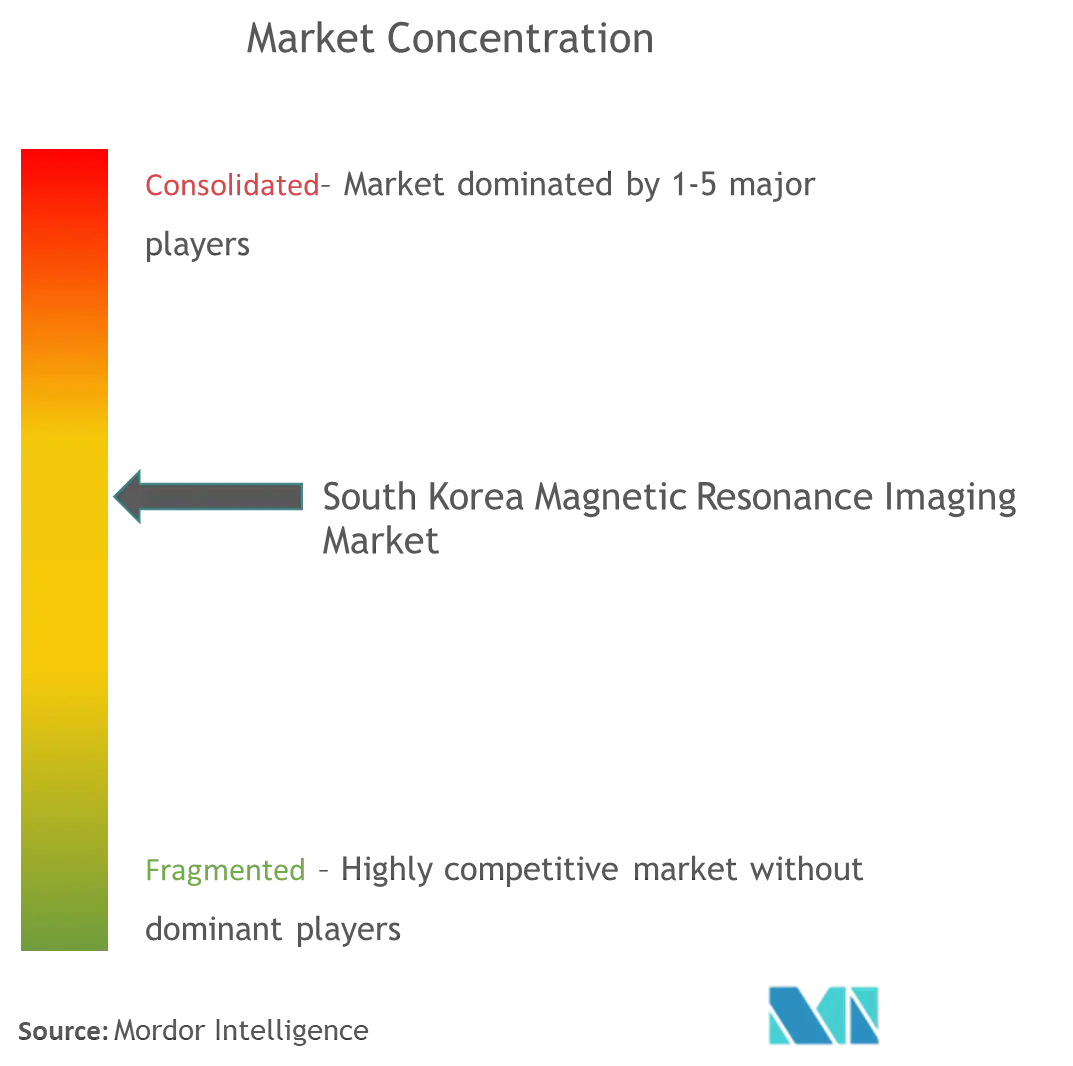
| Market Concentration | Medium |
Major Players
*Disclaimer: Major Players sorted in no particular order Image © Mordor Intelligence. Reuse requires attribution under CC BY 4.0. |
|
South Korea Magnetic Resonance Imaging Market Analysis by Mordor Intelligence
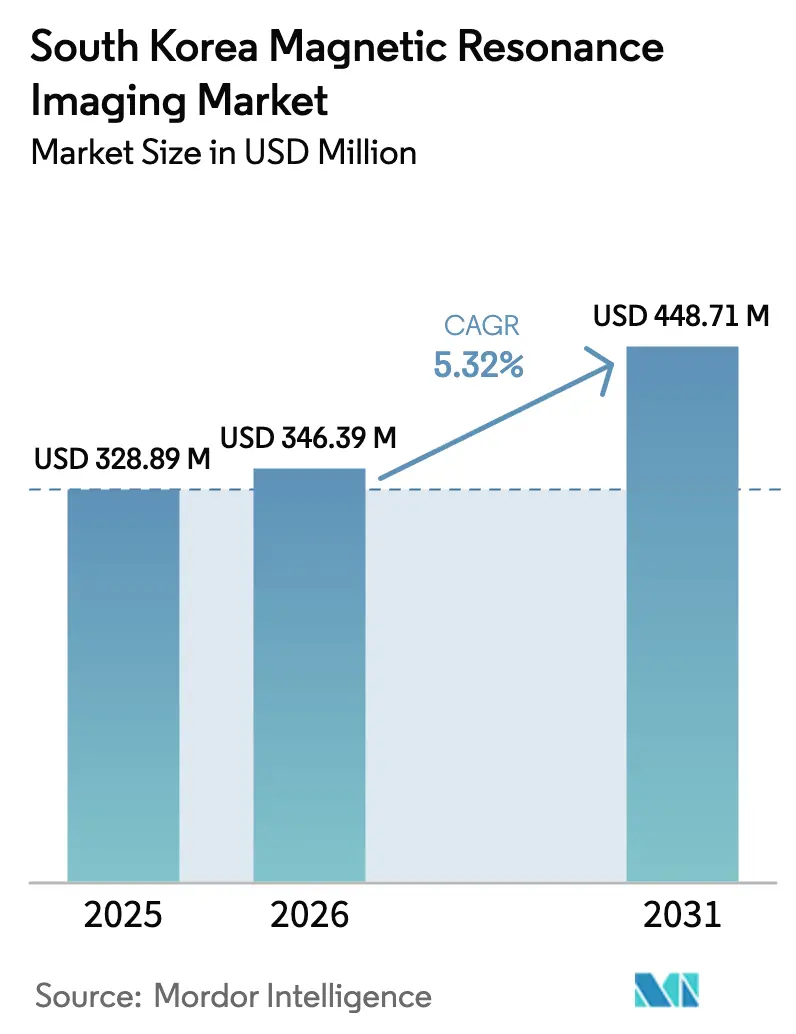
The South Korea MRI market size in 2026 is estimated at USD 346.39 million, growing from 2025 value of USD 328.89 million with 2031 projections showing USD 448.71 million, growing at 5.32% CAGR over 2026-2031. Steady digitization of healthcare, a surge in AI-enhanced diagnostic tools, and the government’s KRW 30 trillion (USD 22.9 billion) 2025 spending plan underpin demand. National Health Insurance coverage for 51.5 million residents guarantees a broad patient base, while hybrid and AI-assisted scanners shorten examination time and raise throughput. Closed high-field platforms remain the clinical workhorse, but open and very-high-field systems gain traction as patient-centered care and precision oncology expand. Capital-cost constraints and workforce shortages outside metro areas temper near-term growth yet open opportunities for point-of-care devices and service outsourcing. The South Korea MRI market continues to evolve through strategic alliances between global vendors and local AI start-ups that turn workflow efficiency into a competitive differentiator.
Key Report Takeaways
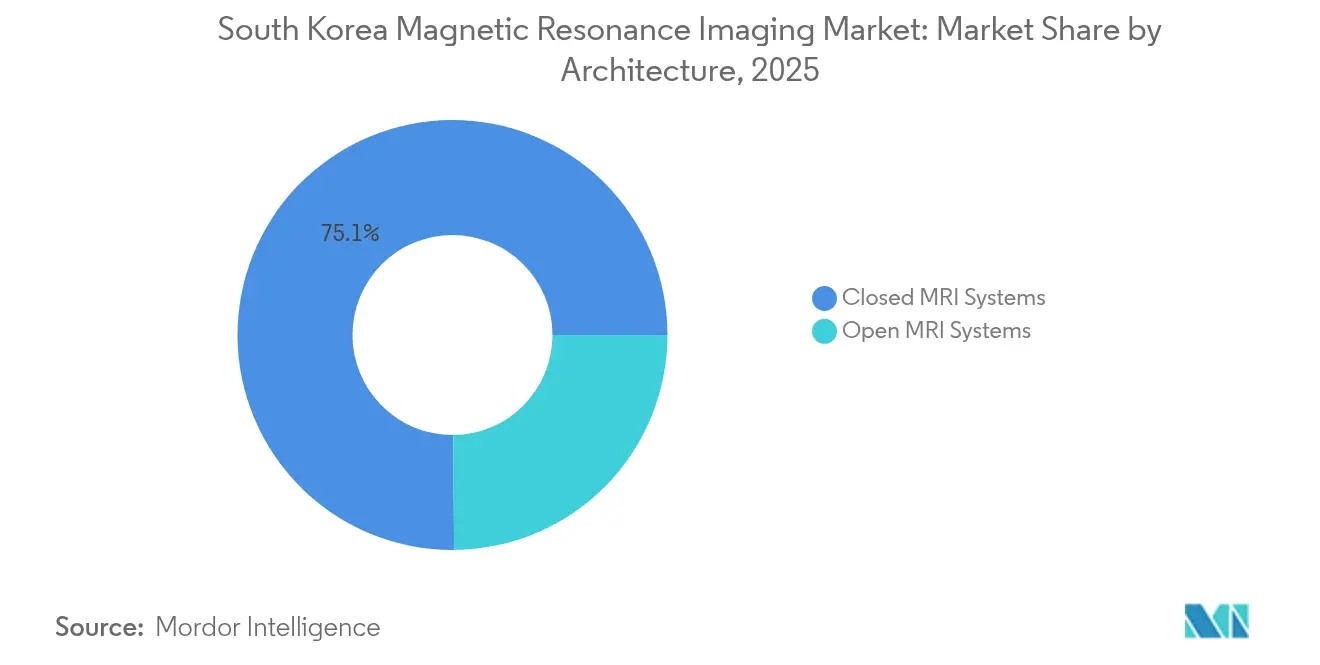
- By architecture, closed systems held 75.12% of the South Korea MRI market share in 2025, while open systems are projected to advance at a 5.94% CAGR to 2031.
- By field strength, 1.5 T scanners accounted for 55.63% of the South Korea MRI market size in 2025; 3 T and ≥ 7 T platforms are growing at 5.65% CAGR through 2031.
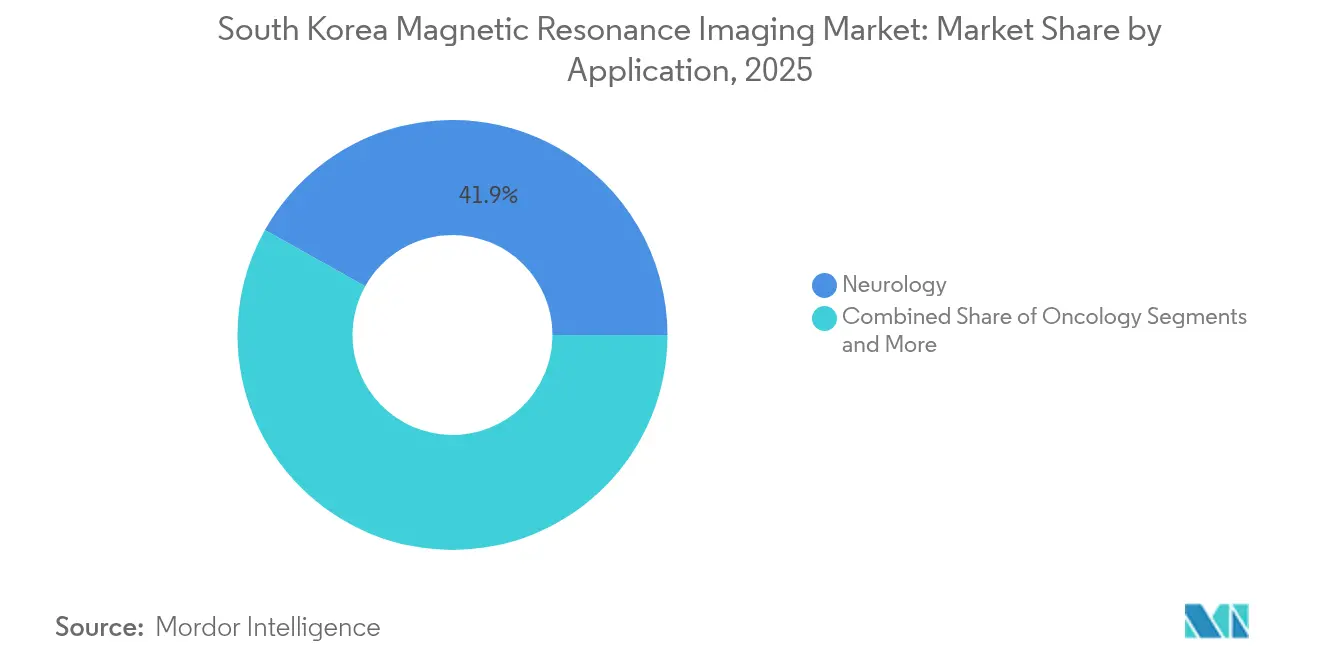
- By application, neurology contributed 41.88% revenue in 2025, whereas oncology is set to post the fastest 6.02% CAGR through 2031.
- By end user, hospitals captured 47.60% of the South Korea MRI market size in 2025; specialized clinics and imaging centers lead growth at 6.18% CAGR.
Note: Market size and forecast figures in this report are generated using Mordor Intelligence’s proprietary estimation framework, updated with the latest available data and insights as of 2026.
South Korea Magnetic Resonance Imaging Market Trends and Insights
Drivers Impact Analysis*
| Driver | (~) % Impact on CAGR Forecast | Geographic Relevance | Impact Timeline |
|---|---|---|---|
| Introduction of Hybrid MRI Systems | +0.8% | National, concentrated in Seoul-Busan corridor | Medium term (2-4 years) |
| Rising Burden of Chronic Diseases & Geriatric Population | +1.2% | National, with higher impact in rural areas | Long term (≥ 4 years) |
| Mandatory Cancer Screening Expansions under South Korea's NHI | +0.9% | National, standardized implementation | Short term (≤ 2 years) |
| Adoption of AI-Based Image Reconstruction in Tertiary Hospitals | +1.1% | Metropolitan areas, expanding to secondary cities | Medium term (2-4 years) |
| Local Manufacturing Incentives for Advanced Medical Devices | +0.6% | Industrial complexes in Chuncheon, Gyeonggi | Long term (≥ 4 years) |
| Emergence of Office-based Point-of-Care MRI Pods | +0.4% | Urban centers, pilot implementations | Long term (≥ 4 years) |
| Source: Mordor Intelligence | |||
Introduction of Hybrid MRI Systems
Hybrid MRI platforms combine magnetic resonance with PET or CT to deliver metabolic and anatomic insight in a single session, an approach prized in oncology treatment planning. The Korean ARPA-H program earmarks KRW 55 billion through 2029 for multimodal diagnostics, channeling early subsidy to tertiary centers in Seoul and Busan [1]. Samsung Medical Centre integrates hybrid suites into its smart-hospital blueprint, citing reduced patient transfers and faster decision cycles. Vendors emphasize streamlined workflow, citing 15-20 minute savings per oncology case and 6% lower resCAN rates. Capital intensity and specialty-staff requirements remain hurdles, though public-funding offsets and vendor-financing packages are narrowing the adoption gap for regional cancer centers.
Rising Burden of Chronic Diseases & Geriatric Population
South Korea became a super-aged society in 2025, with ≥ 20% of citizens aged 65 years or older. Chronic diseases compel earlier, image-guided diagnosis, pushing average MRI studies per 1,000 inhabitants up 7% year-on-year in rural provinces. The Community Care Act steers investment toward transitional home-medical services, prompting tertiary facilities to procure portable scanners for follow-up imaging. Abbreviated protocols—breast MRI in under 10 minutes and zero-contrast knee exams—align with geriatric comfort needs and throughput objectives. Vendors that tailor workflow to mobility-impaired seniors gain preference in provincial tenders.
Mandatory Cancer Screening Expansions under South Korea’s NHI
Revised reimbursement rules effective January 2025 add new MRI procedure codes for liver, pancreatic, and prostate cancer staging, granting 80%–90% cost coverage when scans follow standardized pathways. Hospitals upgrading to multi-parametric oncology packages report 12% revenue lift per scanner and 18% faster payback. Rural coverage gaps persist, yet mobile MRI clinics funded under the Essential Healthcare Recovery Plan schedule quarterly tours to 30 underserved counties, expanding addressable volume by an estimated 11%. Screening mandates also spur demand for AI-enabled lesion detection tools that counterbalance radiologist shortages during peak sessions.
Adoption of AI-Based Image Reconstruction in Tertiary Hospitals
Deep-learning algorithms such as SwiftMR trim scan times up to 50% and raise signal-to-noise ratios on legacy hardware. Five of the six major university hospitals now embed AI recon into neuro, spine, and prostate protocols, freeing capacity for 3–4 additional slots per day. FDA 510(k) approvals granted in 2024 accelerate cross-border deployments and joint validation studies with U.S. centers, enhancing vendor credibility. Remaining challenges involve algorithm-specific training, cybersecurity assurance, and reimbursement differentiation for AI-enhanced versus conventional scans, topics the National Health Insurance Authority is evaluating for the 2026 fee schedule.
Restraints Impact Analysis*
| Restraint | (~) % Impact on CAGR Forecast | Geographic Relevance | Impact Timeline |
|---|---|---|---|
| High Capital & Maintenance Costs | -0.9% | National, more pronounced in smaller facilities | Short term (≤ 2 years) |
| Shortage of Trained MRI Technologists Outside Metro Areas | -1.1% | Rural and secondary cities | Medium term (2-4 years) |
| Reimbursement Pressure on Low-Field Scans | -0.6% | National, affecting cost-sensitive segments | Short term (≤ 2 years) |
| Import-dependence for Super-conducting Magnets | -0.4% | National, supply chain vulnerability | Long term (≥ 4 years) |
| Source: Mordor Intelligence | |||
High Capital & Maintenance Costs
A new 1.5 T system costs USD 1.2–1.5 million, with service contracts consuming 8–12% of capital annually, straining budgets for non-tertiary hospitals [2]. The 2024 medical-residency walkout dampened elective revenue, prompting procurement delays and multi-year leasing over outright purchase. Helium-free magnet designs promise 20% lifecycle-cost savings yet carry a 6–9-month lead time amid global supply bottlenecks. Provincial consortiums leverage pooled purchasing to secure volume rebates, but smaller private clinics still struggle to reach required thresholds.
Shortage of Trained MRI Technologists Outside Metro Areas
South Korea produces roughly 300 new MRI technologists annually, far short of the 500 required to meet projected 2027 demand, leaving vacancy rates of 14% in rural centers [3]. The 2024 enrollment-expansion dispute triggered attrition as clinicians shifted to metropolitan posts or private tele-consult firms. Facilities without full-time technologists resort to part-time staffing, limiting operating hours by up to 40% and elongating patient queues. Government incentives now subsidize relocation stipends and distance-learning refresher courses, yet impact will materialize only from the 2026–2027 academic cohorts.
*Our forecasts treat driver/restraint impacts as directional, not additive. The impact forecasts reflect baseline growth, mix effects, and variable interactions.
Segment Analysis
By Architecture: Closed Systems Preserve Dominance While Open Platforms Gain Momentum
Closed scanners commanded 75.12% of the South Korea MRI market share in 2025, reflecting clinician preference for 1.5 T and 3 T magnets that deliver high-resolution studies across neuro-oncologic pathways. The South Korea MRI market size tied to closed architecture is projected to expand at a 5.08% CAGR, supported by AI-assisted reconstruction that reduces table time and lowers break-even volume thresholds. Siemens’ helium-light MAGNETOM Flow and GE’s SIGNA Prime illustrate vendor push toward sustainability and install-distance flexibility, trimming plant-room costs by 10–12%.
Open systems, although holding a modest 24.88% revenue share, are forecast to outpace overall market growth at 5.94% CAGR as claustrophobia mitigation and intra-operative applications rise. Musculoskeletal surgeons favor open vertical fields that allow joint-specific positioning during real-time guidance, while pediatric departments cite lower sedation rates. Korean start-ups are integrating lightweight gradient coils with AI noise-reduction algorithms, elevating open-system image quality to near-1.5 T closed standards. As patient-centric care models spread, open scanners create a new competitive axis centered on comfort and access rather than sheer magnet strength, ensuring that the South Korea MRI market does not remain monolithic around closed platforms.

By Field Strength: 1.5 T Remains the Workhorse as 3 T Research Uptake Accelerates
High-field 1.5 T instruments captured 55.63% of the South Korea MRI market size in 2025, prized for balanced cost and versatility in routine brain, abdomen, and cardiac exams. Facilities report 96% first-time-right rates for diagnostic neuro indications, while energy-efficient gradients cut power consumption by 15% versus 2022 models. The plateauing of 1.5 T adoption encourages vendors to bundle mid-life upgrades—software-based SNR boosts and 64-channel coil arrays—to defend installed-base revenue.
Very-high-field 3 T and ultra-high ≥ 7 T segments recorded a combined 5.65% CAGR, driven by functional neuro-imaging and advanced oncology staging protocols. Research consortia such as the Korean Brain Connectome Project secure MOHW grants that cover up to 40% of acquisition cost for 7 T scanners, stimulating clinical-research crossover. Canon’s Vantage Galan 3 T Supreme Edition promises 20% faster diffusion studies and AI motion correction, announcing its first Korean installation at Pusan National University Hospital in 2025. While helium logistics remain a concern for ≥ 3 T suites, vendor adoption of cryo-coolers requiring ≤ 7 liters of helium per year eases operational budgeting.
By Application: Neurology Dominates, Oncology Registers Fastest Expansion
Neurology generated 41.88% of 2025 revenue, cementing its lead through MRI’s unmatched demyelination detection and stroke triage capacity. Functional MRI protocols, once confined to research, now inform surgical planning for epilepsy and glioma cases, raising reimbursement tiers under the 2025 fee revision. Investments in AI based seizure-focus localization cut radiologist read time by 30% and drive broader usage among secondary hospitals.
Oncology, the fastest-rising segment with a 6.02% CAGR, gains impetus from mandated screening for liver, pancreatic, and prostate cancers. Breath-hold liver DWI sequences reduced motion artifacts by 18%, enhancing lesion detectability in hepatocellular carcinoma prevalent regions. Hybrid PET/MRI suites, combined with radiomics-based tumor response monitoring, position MRI as an indispensable tool in precision-medicine protocols. Cardiology, gastroenterology, and musculoskeletal applications round out the modality mix, benefiting from algorithmic post-processing that widens the clinical envelope without hardware upgrades, reinforcing the diversified revenue base within the South Korea MRI market.
By End User: Hospitals Lead While Specialized Centers Capture Growth Upside
Hospitals controlled 47.60% of 2025 system revenue, driven by emergency coverage mandates, broad modality portfolios, and research affiliations that favor high-field installations. The Essential Healthcare Recovery Fund earmarks KRW 10 trillion for hospital imaging modernization, financing replacement cycles for magnets older than eight years.
Specialized imaging centers and single-specialty clinics account for just under one-third of value yet post a 6.18% CAGR, reflecting urban consumer demand for shorter wait times and transparent pricing. These centers often deploy one-or-two-room footprints in commercial complexes, leveraging AI scheduling to maximize gantry uptime. Portable point-of-care pods debut in orthopedic and sports-medicine chains, demonstrating same-day ankle and knee assessments without referral delays. Academic and research institutes, though the smallest buyer group, influence vendor roadmaps through collaborative AI algorithm validation and early adoption of 7 T prototypes.
Geography Analysis
Metropolitan clusters dominate MRI penetration, with Seoul, Incheon, and Busan hosting 61% of installed scanners by 2025. University hospitals in the Seoul Capital Area routinely operate 24/7 imaging shifts, driving per-scanner utilization above 3,500 exams yearly. Government sponsorship of digital-health corridors positions Incheon’s Songdo Bio-Cluster as a test bed for AI-reconstructed MRI workflows, thus reinforcing vendor preference for early commercial launches in the region.
Growth potential resides in Chungcheong, Gangwon, and Jeolla provinces where scanner density lags the national average of 37 units per million residents by roughly 30%. Rural hospitals leverage mobile MRI trailers under public–private partnerships that achieve 85% capacity utilization within eight months of deployment. The Act on Integrated Support for Community Care incentivizes provincial councils to co-finance imaging hubs, shrinking travel distance for seniors by 28 km on average.
Medical tourism exerts a moderate pull; although cosmetic and orthopedic procedures dominate arrivals, tertiary hospitals package full-body MRI check-ups into premium wellness itineraries targeting patients from Southeast Asia and the Middle East. Geopolitical supply-chain reassessments encourage local magnet manufacturing near Chuncheon’s upcoming 550,000 m² industrial complex, expected online in 2028, which could rebalance import dependence in favor of domestic value-add. Regional disparity remains tied to technician availability, leading vendors to bundle remote-operation consoles that allow metro-based specialists to guide scans in provincial facilities, an emerging model that promises to level care quality across the South Korea MRI market.
Regulatory Landscape
The Ministry of Food and Drug Safety (MFDS) oversees medical devices under the Medical Devices Act. MRI systems are generally handled as Class II devices, with certification supported through the National Institute of Medical Device Safety Information (NIDS) or the Medical Device Information and Technology Assistance Center (MDITAC), depending on device characteristics and clinical claims.
Market entry typically follows a dual track that combines MFDS premarket assessment with Health Technology Assessment (HTA) for National Health Insurance (NHIS) reimbursement, coordinated with the Health Insurance Review and Assessment Service (HIRA). The January 2025 reimbursement revision that added additional MRI procedure codes for cancer staging shows how fee schedule and coding updates can speed adoption of advanced MRI protocols, provided hospitals can standardize workflows to match the prescribed pathways.
Value Chain Analysis
Foreign medical device manufacturers usually establish a presence in South Korea through direct subsidiaries, exclusive distributors, or a hybrid structure that separates regulatory responsibility from commercial operations. In practice, a local legal holder (KLH) often manages regulatory affairs, while a different entity handles sales execution. The distribution environment is crowded, with many regional distributors and some hospitals retaining closed or captive distribution relationships.
Pohang has developed as a specialized medical device production hub, with particular emphasis on cardiac ultrasound components, supported by infrastructure such as Pohang Technopark.
Competitive Landscape
International majors—Siemens Healthineers, Philips, GE HealthCare, and Canon Medical—collectively control an estimated 68% of annual sales, leveraging brand cachet, broad service networks, and R&D pipelines rich in helium-light magnets and AI toolkits. Siemens’ 2024 investment in superconducting-magnet capacity and its Korean R&D alliance with AI-cardiac firm Phantomics illustrate a dual play on component self-sufficiency and algorithmic differentiation. GE’s collaboration with provincial consortia to deploy compact 0.7 T point-of-care units extends reach into community clinics once deemed non-viable for conventional suites.
Local innovators inject competitive dynamism: AIRS Medical’s FDA-cleared SwiftMR algorithm retrofits multi-vendor fleets, winning service-contract add-ons even where hardware replacement is deferred. Samsung Ventures’ stake in Subtle Medical underscores domestic appetite for augmentation software that transcends OEM silos. Hyperfine pilots low-field bedside systems in emergency departments, potentially disrupting patient routing and follow-up imaging patterns.
Strategic moves in 2024–2025 revolve around ecosystem building rather than pure hardware. Philips signed a multi-year AI research deal with Mayo Clinic to refine cardiac MRI on implant-bearing patients, while Canon partnered with NVIDIA to accelerate reconstruction on the Vantage Galan 3 T. Competitive narratives highlight measurable throughput and cost metrics; for instance, Siemens publicizes a 20% reduction in site preparation costs for the MAGNETOM Flow versus prior 1.5 T models, shaping purchasing criteria beyond magnet strength alone. The South Korea MRI market’s moderate concentration favors suppliers that integrate hardware, software, and service into cohesive value propositions supportive of both metro megacenters and resource-strained provincial hospitals.
South Korea Magnetic Resonance Imaging Industry Leaders
-
Siemens AG
-
Canon Medical Systems
-
GE Healthcare
-
Fujifilm Holdings Corporation
-
Koninklijke Philips NV
- *Disclaimer: Major Players sorted in no particular order
Market Opportunities and Future Outlook
MRI systems are generally classified as Class II devices, and purchasing decisions tend to concentrate in tertiary centers such as Asan Medical Center and Samsung Medical Center, alongside regional hospital expansions including the Dongrae Bongseng Hospital Future Center in Busan. The KRW 30 trillion (USD 22.9 billion) 2025 government spending plan provides a direct demand base for advanced imaging infrastructure, while investments in AI-enabled workflows and multi-parametric oncology pathways continue to shape procurement priorities.
Siemens Healthineers is also expanding its cardiac ultrasound manufacturing capacity in Pohang through an August 2025 KRW 201 billion investment, with completion of the sixth venture building expected in 2027 and the effort connected to Pohang Technopark. Government-backed medtech manufacturing hubs in Pohang and North Gyeongsang Province support domestic capability for imaging components, service logistics, and training, and reference deployments in leading hospitals and academic centers point to broader uptake of AI-enabled imaging and tighter workflow integration across the country.
Recent Industry Developments
- June 2026: Dongrae Bongseng Hospital installed a 3.0-tesla Magnetom Vida MRI system as part of its Future Center opening on June 2, 2026. The installation adds high-field capacity at a regional hospital, expanding advanced imaging options in the metro-rural corridor. The shift points to faster high-field expansion and AI-ready workflows in regional centers, supporting service differentiation and higher throughput.
- March 2026: Ewha Womans University Seoul Hospital began operating the Magnetom Cima.X 3T MRI system on March 3, 2026. This deployment increases high-field MRI capacity at a major university hospital. It underscores adoption of advanced 3T platforms in flagship academic settings, strengthening Siemens’ high-end installed base and reference coverage.
- January 2026: Dongtan City Hospital designated as an Asia regional reference site for GE HealthCare following AI imaging center expansion on January 8, 2026. The designation builds GE’s AI-enabled imaging workflow footprint in South Korea. It supports follow-on demand for AI-based reconstruction and integration, and improves GE’s visibility across the market.
Research Methodology Framework and Report Scope
Market Definition and Coverage
This market covers revenue generated in South Korea from magnetic resonance imaging systems and related scanner sales into healthcare and research settings, including upgrades and replacements that are accounted as equipment revenue in USD.
Scope exclusions: We exclude service contracts, standalone software licenses, facility construction, and non-MRI imaging modalities.
Segmentation Overview
-
By Architecture
- Closed MRI Systems
- Open MRI Systems
-
By Field Strength
- Low-Field (< 1.5 T)
- High-Field (1.5 T)
- Very-High (3 T) & Ultra-High (≥ 7 T)
-
By Application
- Oncology
- Neurology
- Cardiology
- Gastroenterology
- Musculoskeletal
- Other Applications
-
By End User
- Hospitals
- Specialized Clinics & Imaging Centers
- Research & Academic Institutes
Data Sources, Market Sizing, and Validation
Desk Research
Desk work starts by mapping the installed base, utilization, and funding context that shapes MRI purchases in South Korea. We reference public health statistics and equipment disclosures, then align them with procurement signals and import patterns to avoid overcounting replacement cycles.
Common sources include OECD health data for imaging equipment density and use, Korea Disease Control and Prevention Agency publications for disease burden direction, National Health Insurance Service and HIRA references for reimbursement and coverage cues, and Ministry of Food and Drug Safety resources for device and regulatory context. We also review customs and trade releases where available, peer reviewed radiology journals for technology adoption patterns, and public company filings and investor materials to anchor pricing logic. Select paid subscriptions are used for company financial intelligence, patent lookups, and shipment level import-export checks when public series are incomplete. These examples are illustrative, and many other public and paid sources are used for data collection, validation, and clarification during the study.
Primary Interviews and Surveys
Primary inputs focus on what actually drives purchases and replacement decisions, since list prices and stated plans rarely match awarded deals. We spoke with hospital imaging leaders, radiology department managers, procurement teams, distributors, and service partners to verify field strength mix, tender timing, and typical discounting, which then tightens the ASP assumptions.
Feedback was also used to sanity check utilization trends, referral patterns, and the extent to which AI assisted workflows are changing throughput, which informs replacement and capacity additions across key provinces and major metro areas.
Distribution of primary research fieldwork respondents
| Company type | Respondent position |
|---|---|
| Top tier: 25% | CXOs: 13% |
| Mid tier: 57% | Functional/Unit leaders: 34% |
| Smaller Players: 18% | Managers: 53% |
Market-Sizing & Forecasting
The sizing logic starts with a top-down build that reconstructs annual MRI demand from the active installed base, expected replacement timing, and new additions tied to capacity expansion in hospitals and imaging centers. From there, market value is translated using typical ASP bands by field strength and system configuration, then adjusted for procurement discounting patterns that were confirmed through interviews.
To keep the model grounded, a selective bottom-up pass is used as a check, where sampled unit shipments, tender awards, and channel feedback are rolled up and matched back to the top-down totals. When gaps appear, they are handled transparently through conservative assumptions on unit splits and pricing, then re-tested with expert calls.
Key inputs include imaging equipment density and utilization direction, replacement cycle expectations for 1.5T and 3T systems, public and private hospital capex appetite, reimbursement breadth for MRI exams, and import and procurement timing signals. Forecasting relies mainly on scenario analysis, where unit growth and ASP movement are varied around a base case that reflects how buyers prioritize higher field strength upgrades versus budget driven replacements.
Data Validation & Update Cycle
Outputs are checked against independent signals such as equipment density trends, reported procurement activity, and expected replacement cadence, then reviewed for outliers at the field strength and end user level. If a variance looks too wide, we re-check assumptions, revisit the underlying source line, and re-contact experts to confirm whether a one-off purchase cycle or a policy shift is driving it.
Before sign-off, the model goes through a multi-step internal review so that math, scope boundaries, and pricing logic stay consistent across years. The report is refreshed annually, and interim updates are made when material events occur, followed by a final pre-delivery pass to reflect the latest available data.
Mordor Intelligence's South Korea Magnetic Resonance Imaging Mri Market Size Versus Other Published Estimates
Published market sizes for South Korea MRI can differ even when they appear to measure the same thing, because the counted revenues and year selection are not always aligned. In our work, most gaps come from what is treated as equipment revenue versus broader diagnostic imaging, and from whether the number reflects shipments, billings, or end user spending.
Tender announcements, import shipment trends, and field feedback on average selling prices are the evidence checks that keep Mordor Intelligence's estimate tied to scanner purchasing in South Korea rather than bundled service and software revenues. When another estimate uses wider modality coverage or assumes faster ASP inflation without validating discounts, the resulting totals can move up quickly even if unit growth stays modest.
Benchmark comparison
| Source | Market Size | Gaps in Research Methodology |
|---|---|---|
| Mordor Intelligence | USD 328.89 M (2025) | |
| Industry Publisher A | USD 367.73 M (2024) | This figure appears to sit inside a broader medical imaging context, so modality boundaries may be wider than MRI only, and year alignment differs from the 2025 base used in this study. |
| Regional Consultancy B | USD 1180.00 M (2026) | The total likely includes a wider revenue bucket beyond equipment sales, or uses an aggressive ASP progression that is not anchored to tender discounting and replacement driven demand patterns. |
Overall, the spread is mostly explained by scope and measurement choices, not by a radically different view of MRI unit growth. By keeping the model traceable to installed base dynamics, replacement timing, and price realities seen in procurement, the final number stays repeatable and easier to audit year to year.
Key Questions Answered in the Report
How big is the South Korea Magnetic Resonance Imaging Market?
The South Korea Magnetic Resonance Imaging Market size is expected to reach USD 346.39 million in 2026 and grow at a CAGR of 5.32% to reach USD 448.71 million by 2031.
Which product category leads sales in Korean imaging suites?
Closed 1.5 T and 3 T systems held 75.12% revenue in 2025 and remain the dominant choice for broad clinical versatility.
Who are the key players in South Korea Magnetic Resonance Imaging Market?
Siemens AG, Canon Medical Systems, GE Healthcare, Fujifilm Holdings Corporation and Koninklijke Philips NV are the major companies operating in the South Korea Magnetic Resonance Imaging Market.
What drives the jump in oncology-focused MRI usage?
National Health Insurance now reimburses expanded cancer staging procedures, pushing oncology MRI to the fastest 6.02% CAGR through 2031.