
Market Overview
| Study Period | 2020 - 2031 |
|---|---|
| Forecast Data Period | 2026 - 2031 |
| Base Year Market Size (2025) | USD 220.99 Million |
| Market Size (2026) | USD 237.84 Million |
| Market Size (2031) | USD 343.47 Million |
| Growth Rate (2026 - 2031) | 7.63 % |
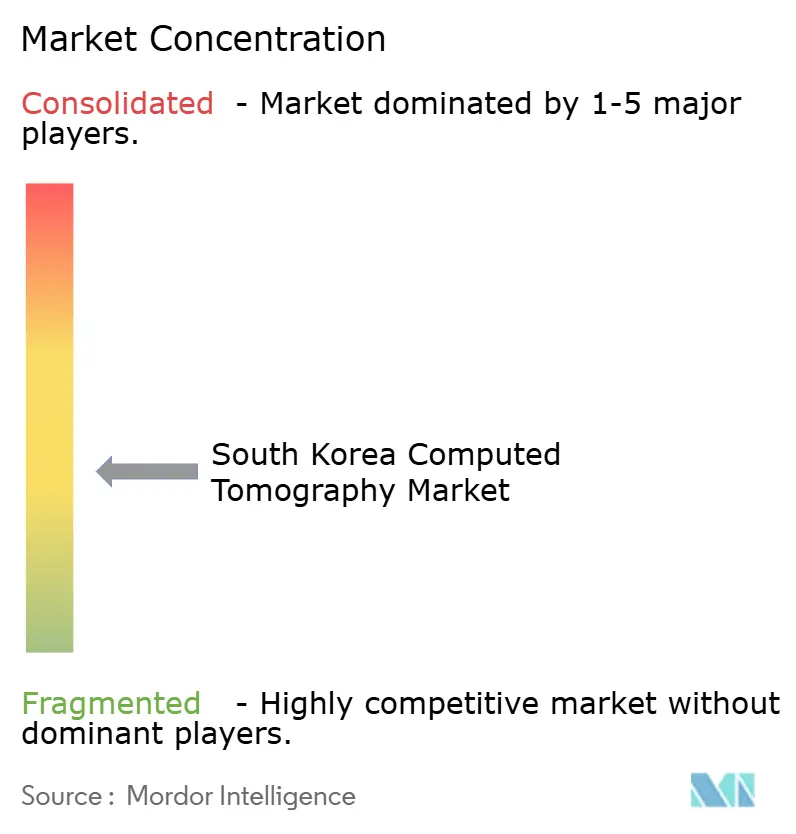
| Market Concentration | Medium |
Major Players *Disclaimer: Major Players sorted in no particular order Image © Mordor Intelligence. Reuse requires attribution under CC BY 4.0. | |
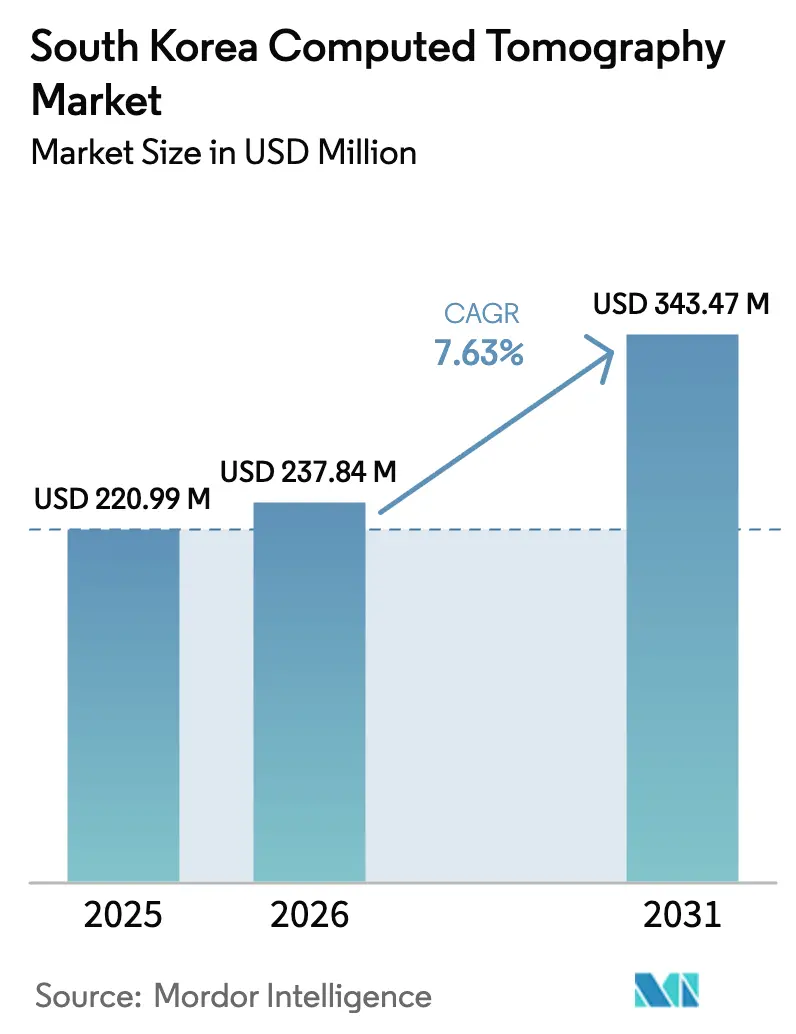
South Korea Computed Tomography Market Analysis by Mordor Intelligence
South Korea computed tomography market size in 2026 is estimated at USD 237.84 million, growing from 2025 value of USD 220.99 million with 2031 projections showing USD 343.47 million, growing at 7.63% CAGR over 2026-2031. The steady rise reflects national policies that channel KRW 10 trillion into hospital upgrades, generous NHIS reimbursement, and a CT scanner density of 44.5 units per million residents that surpasses the OECD average. A broad transition toward AI-enabled image-reconstruction platforms has already cut radiation dose in routine protocols by 75% while preserving diagnostic clarity. Mobile CT fleets that proved critical during COVID-19 outbreaks now support rural outreach programs, and large hospitals use 5G-linked teleradiology to balance workload across metropolitan hubs. Oncology continues to dominate procedure volume, yet neurology scans are expanding fastest as stroke centers proliferate and geriatric screening intensifies nationwide.
Key Report Takeaways
- By product type, high-slice systems led with 34.62% revenue share in 2025, whereas medium-slice scanners are projected to grow at 8.16% CAGR to 2031.
- By application, oncology accounted for 32.10% of the South Korea computed tomography market size in 2025; neurology is poised for the fastest 8.32% CAGR through 2031.
- By mobility, fixed installations held 65.08% of the South Korea computed tomography market share in 2025, while mobile units record an 8.54% CAGR on expanding rural deployments.
- By end user, hospitals represented 48.55% of 2025 revenue, but diagnostic imaging centers are growing at 8.42% CAGR on privatization and patient-convenience trends.
Note: Market size and forecast figures in this report are generated using Mordor Intelligence’s proprietary estimation framework, updated with the latest available data and insights as of 2026.
South Korea Computed Tomography Market Trends and Insights
Drivers Impact Analysis*
| Driver | (~) % Impact on CAGR Forecast | Geographic Relevance | Impact Timeline |
|---|---|---|---|
| Increasing prevalence of chronic diseases | +1.8% | Seoul–Incheon corridor and other urban clusters | Medium term (2-4 years) |
| Rising geriatric population & screening need | +2.1% | Nation-wide, acute in rural provinces | Long term (≥ 4 years) |
| Government NHIS expansion for CT procedures | +1.5% | Pan-national roll-out | Short term (≤ 2 years) |
| Rapid AI-driven workflow upgrades | +1.2% | Major tertiary hospitals in metropolitan areas | Medium term (2-4 years) |
| Carbon-ion and proton therapy planning | +0.6% | Seoul–Gyeonggi specialized cancer centers | Long term (≥ 4 years) |
| Private 5G networks enabling remote scans | +0.5% | Initially metropolitan; scaling to secondary cities | Medium term (2-4 years) |
| Source: Mordor Intelligence | |||
Increasing Prevalence of Chronic Diseases
The national burden of cancer, cardiovascular illness, and chronic lung disorders is shifting CT from episodic investigation to routine surveillance. The lung-cancer screening arm of the National Health Screening Program offers low-dose CT to smokers aged 55-74, and participation jumped 28% in 2025 after policy refinements that added never-smokers at elevated risk. Cardiac CT is now a first-line gatekeeper for stable chest pain, replacing invasive angiography in many centers and easing waiting lists for catheter labs. Oncology follow-up programs standardize thin-slice contrast protocols to detect sub-centimeter lesions that earlier scanners missed, fuelling steady hardware upgrades. Diagnostic imaging centers in suburban districts have responded by extending hours and adding dual-source CT suites dedicated to outpatient scans. These patterns ensure that the South Korea computed tomography market will remain integral to chronic-disease management nationwide.
Rising Geriatric Population & Screening Demand
South Korea crossed the “super-aged” threshold in 2025, and CT volumes mirror the demographic pivot. The Transitional-Age Screening Program now reimburses thoraco-lumbar CT for osteoporosis in women aged 66, normalizing CT as a preventive tool rather than a last-resort test. Emergency departments report a spike in head CT for falls and cerebrovascular events among seniors, while facial bone CT grew 3,118% over the past decade. Dose-reduction algorithms grounded in deep learning alleviate clinician concern about cumulative exposure, permitting frequent follow-up scans for chronic subdural hematoma and other age-linked conditions. Mobile CT caravans outfitted with 64-slice scanners now travel to provincial clinics on fixed schedules, closing the urban–rural imaging gap.
Government NHIS Expansion Covering CT Procedures
NHIS policy updates effective January 2025 cut patient copayments to 10% for most CT-based cancer checks and broadened reimbursement to include AI-assisted image reconstruction. The Health Insurance Review & Assessment Service simultaneously raised facility fees for CT, improving hospital ROI and hastening replacement of legacy single-slice units. Public hospitals immediately tendered for medium-slice platforms that embed smart-scan protocols to meet mandated radiation benchmarks. Vendors partner with provincial authorities to pilot bulk-procurement schemes that align payment with dose-performance metrics, ensuring rapid adoption even in smaller county hospitals.
Rapid AI-Based Workflow & Image-Quality Upgrades
Deep-learning reconstruction now reduces radiation by 75% while preserving lesion conspicuity on sub-millimeter sections. Clinical trials at Samsung Medical Center showed a 33% rise in referral rates after AI triage flagged incidental pulmonary nodules in out-patient scans, underscoring AI’s role in case-finding. High-performance GPUs embedded in new CT consoles accelerate iterative reconstruction, trimming average thorax scan time from 12 minutes to under 5. Hospital groups integrate AI dashboards into EMRs, allowing radiologists to batch-approve normal studies and focus on flagged cases. These gains drive green-lighting for capital projects even under the stricter 2025 Digital Medical Products Act because buyers can demonstrate improved productivity and patient safety.
Restraints Impact Analysis*
| Restraint | (~) % Impact on CAGR Forecast | Geographic Relevance | Impact Timeline |
|---|---|---|---|
| High upfront & lifecycle scanner costs | -1.4% | Pronounced in small hospitals and rural facilities | Short term (≤ 2 years) |
| Stringent MFDS regulatory oversight | -0.8% | Uniform across the country | Medium term (2-4 years) |
| Radiation-dose concerns among clinicians | -0.7% | National, heightened for pediatric follow-up | Medium term (2-4 years) |
| Market saturation in large urban clinics | -0.5% | Seoul–Incheon metropolitan area | Long term (≥ 4 years) |
| Source: Mordor Intelligence | |||
High Upfront & Lifecycle Costs of CT Scanners
Capital outlays remain the single biggest hurdle for district hospitals, where 23.6% of installed scanners are older than 10 years. New photon-counting CT systems cost up to USD 2.3 million, and service contracts can exceed USD 150,000 annually, straining operating budgets. Facilities often extend scan hours to amortize equipment faster, a practice that risks marginal indications creeping into routine use. Service-life uncertainty compounds the burden: software obsolescence now arrives in five-year cycles, forcing recurrent upgrade negotiations or the prospect of network isolation. The government’s depreciation allowance and low-interest borrowing schemes partly cushion the impact, yet smaller providers still hesitate to purchase leading-edge systems.
Stringent MFDS Regulatory & Reimbursement Review
The Ministry of Food and Drug Safety re-classified AI-embedded CT scanners as Class IV devices under the 2025 Digital Medical Products Act, requiring dossier submissions that include multi-center clinical validation and real-world post-market surveillance plans [1]. Approval timelines have lengthened to 12-18 months, delaying product launches and squeezing vendor marketing cycles. Simultaneously, the reimbursement gatekeeper demands cost-effectiveness evidence, pushing manufacturers to bundle AI software licenses with hardware under usage-based pricing. While patients ultimately benefit from higher safety thresholds, the regulatory load can stall refreshing of aging fleets, especially in non-profit provincial hospitals.
*Our forecasts treat driver/restraint impacts as directional, not additive. The impact forecasts reflect baseline growth, mix effects, and variable interactions.
Segment Analysis
By Product Type – Medium Slice Systems Drive Technology Transition
Medium-slice scanners commanded significant unit demand in 2025, and they are set to expand at 8.16% CAGR as hospitals seek high-throughput performance without premium-tier price tags. The South Korea computed tomography market size for medium-slice platforms is projected to climb steadily alongside outpatient imaging-center openings. Enhanced cooling systems and integrated dual-energy modes now allow 80-slice models to match diagnostic reach once limited to 128-slice equipment.
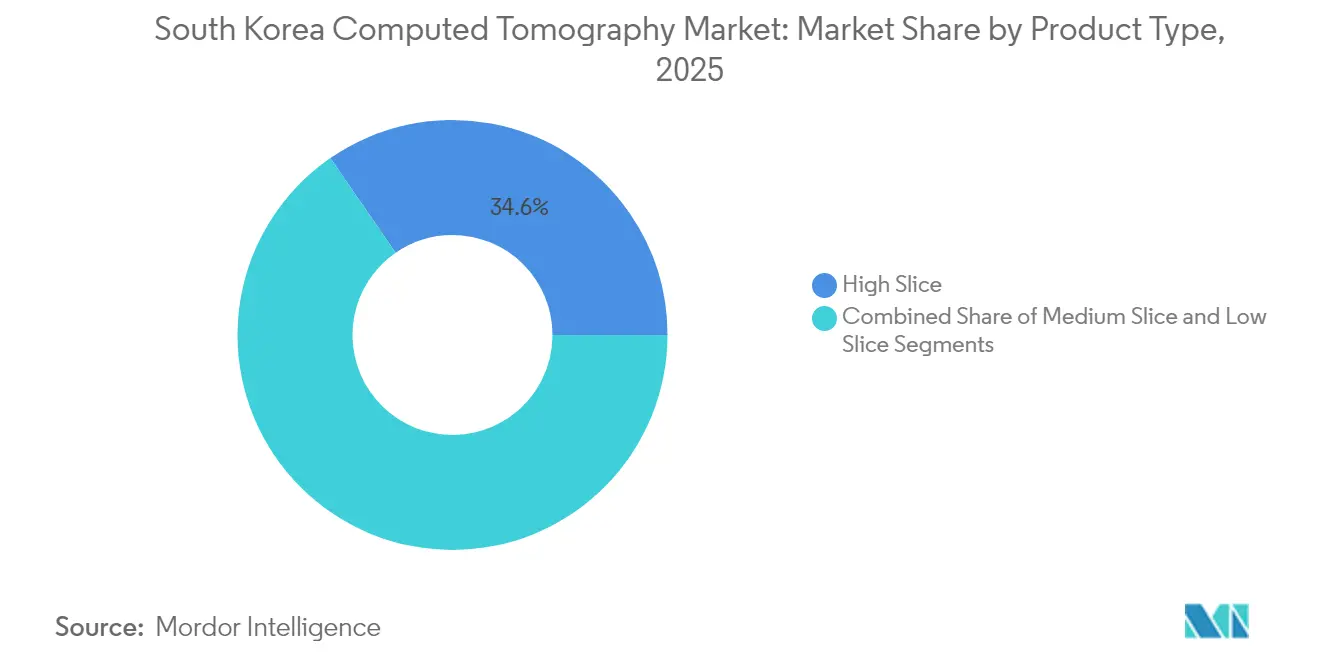
High-slice systems still capture 34.62% of revenue by enabling whole-heart imaging in a single beat and ultra-low-dose pediatric protocols. Their dominance is reinforced by tertiary hospitals that rely on multi-phase oncology staging and trauma algorithms requiring sub-second rotation times. Low-slice units remain viable for extremity studies and interventional suites but their share erodes as refurbished 64-slice devices undercut entry-level models. Competitive pricing from Siemens Healthineers’ Somatom Pro.Pulse lowers capital barriers, ensuring medium-slice scanners remain the workhorse segment of the South Korea computed tomography market .

By Application – Neurology Accelerates Amid Stroke-Care Expansion
Oncology preserved 32.10% revenue in 2025 as national screening mandates anchor CT in tumor detection, staging, and radiotherapy planning. The South Korea computed tomography market share for oncology will stabilize as PET-CT gains ground, yet absolute scan counts rise with a growing survivor population needing quarterly follow-ups .
Neurology outpaces every specialty at 8.32% CAGR, fueled by nationwide hyper-acute stroke centers that demand 24/7 CT perfusion and angiography. AI-powered large-vessel-occlusion detection assists junior residents during night shifts, trimming door-to-needle times. Cardiovascular indications maintain a reliable baseline, with coronary CT-angiography replacing treadmill tests in many health-check packages. Musculoskeletal requests climb on sports-injury management and geriatric fractures. Emerging fields such as CT-guided pain therapies and pediatric congenital-heart imaging keep broadening the clinical map for the South Korea computed tomography market.
By Mobility – Mobile Systems Gain Traction Through Pandemic-Proven Flexibility
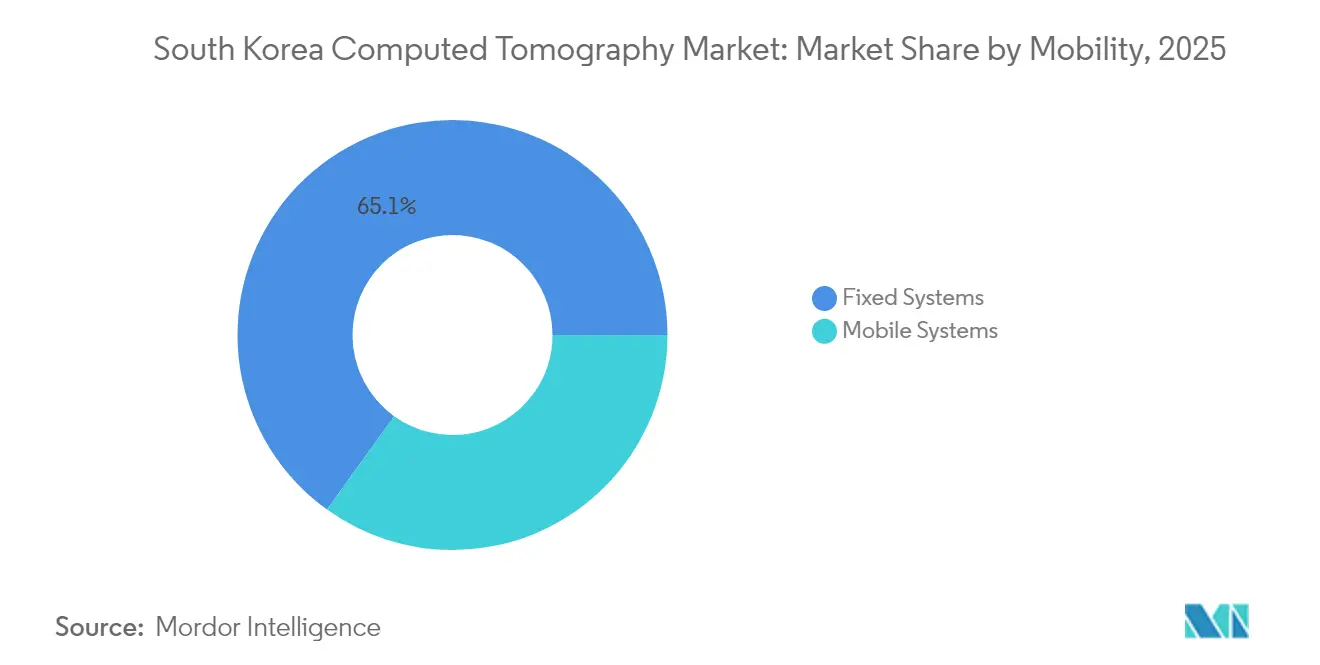
Fixed rooms remain the backbone, contributing 65.08% of revenue and handling poly-trauma, multi-phase oncology, and large-volume emergency loads. Their permanence facilitates radiation-shielding optimization and smooth integration with pneumatic-tube specimen systems.
Mobile CT posts an 8.54% CAGR as provincial governments fund truck-mounted units that visit county clinics on rotation schedules. During 2024, mobile scanners in Busan processed more than 6,000 chest CTs and cut patient transfer by 37%, validating the model’s economics. Remote control consoles let central radiologists protocol and read studies in real time over secure 5G links. Manufacturers are now releasing 128-slice mobile variants with battery-assist generators, extending service windows during power outages and disaster relief deployments.
By End User – Diagnostic Centers Capitalize on Privatization Trends
Hospitals commanded 48.55% revenue in 2025 because emergency, oncology, and inpatient pathways rely on in-house CT. Proton-therapy planning further entrenches large academic centers, which demand sub-millimeter isotropic datasets compatible with carbon-ion dose-calculation engines.
Diagnostic imaging centers exhibit 8.42% CAGR, boosted by consumer preference for shorter wait times and transparent pricing. Operators invest in AI-enhanced scheduling platforms that cut idle gantry time below 5% and support extended evening clinics. Other users—research institutes, veterinary hospitals, and device-trial sites—remain small in value but innovative in scope, piloting photon-counting detectors and novel contrast media. Their experiments shape future procurement standards for the South Korea computed tomography market.
Geography Analysis
The capital megaplex of Seoul, Incheon, and Gyeonggi generated well over half of 2025 CT revenue, reflecting dense population, multi-hospital clusters, and the earliest adoption of dual-source and spectral technologies. High-profile academic centers such as Asan Medical and Seoul National University Hospital act as reference sites, catalyzing peer adoption across the South Korea computed tomography market.
Secondary metros—Busan, Daegu, and Gwangju—now log double-digit scan growth as city councils co-fund equipment upgrades to retain patients who previously traveled to Seoul. Rural provinces, although starting from a smaller installed base, present the fastest percentage gains owing to KRW 10 trillion in central grants earmarked for regional hospital modernization. Mobile CT caravans bridge long travel distances, performing nearly 40% of annual scans in Gangwon’s mountainous districts.
Medical tourism adds an international layer: 606,000 foreign patients entered South Korea in 2024, a 144.2% rise year-on-year. Many select premium health-check packages that combine coronary CT-angiography with low-dose lung and abdomen studies, sustaining high-end scanner utilization in urban flagship clinics. Government targets of 700,000 inbound patients by 2027 should further widen the South Korea computed tomography market across hospitality-linked medical complexes.
Regulatory Landscape
Computed tomography systems in South Korea are regulated under the Medical Device Act and overseen by the Ministry of Food and Drug Safety (MFDS). Premarket review is routed through MFDS technical document assessment, with higher-risk configurations (including advanced CT platforms) placed into Class III/IV pathways that require MFDS approval and closer scrutiny for software-driven functions.
The regulatory controls increasingly focus on software, traceability, and manufacturing quality. MFDS operates Unique Device Identification (UDI) requirements and enforces Good Manufacturing Practice (GMP), including acceptance of Medical Device Single Audit Program (MDSAP) reports to support GMP inspection applications. With AI-enabled CT becoming more prevalent, the framework also incorporates digital medical device certification considerations, including cybersecurity-related requirements, which shapes vendor documentation, validation planning, and post-market surveillance commitments.
Competitive Landscape
Global multinationals dominate hardware revenue, yet competition hinges on AI differentiation more than detector rows. GE HealthCare introduced Revolution Vibe in 2025, bundling an AI-driven motion-correction suite and unlimited one-beat cardiac imaging—features calibrated to Korea’s high arrhythmia prevalence. Siemens Healthineers’ Somatom Pro.Pulse pursues mid-tier buyers with 20% lower power draw, aligning with energy-efficiency incentives from Korea Electric Power Corporation. Philips’ CT 5300, launched in late 2024, markets workflow orchestration that lets technologists pre-populate patient demographics through QR codes, easing EMR integration.
Domestic AI specialists Lunit and VUNO partner with OEMs to preload nodule-detection and bone-age modules at factory level, shortening validation cycles for MFDS approval. Lunit’s collaboration with Radiobotics blends Korean chest-X-ray analytics with European musculoskeletal expertise, bolstering export prospects.
Service-contract innovation intensifies: subscription models now bundle uptime guarantees with continuous AI-software updates, spreading costs across five-year terms. Hospitals evaluate vendors not just on gantry speed but on demonstrated reductions in repeat scans, report-turnaround improvements, and radiation-dose transparency. Such metrics frame purchasing committees’ scoring sheets, shaping the next growth phase of the South Korea computed tomography market.
South Korea Computed Tomography Industry Leaders
-
Canon Medical Systems Corporation (Toshiba Corporation)
-
GE Healthcare
-
Koninklijke Philips NV
-
Siemens Healthineers AG
-
Fujifilm Holdings Corporation
- *Disclaimer: Major Players sorted in no particular order
Market Opportunities and Future Outlook
A white-space opportunity is emerging in fleet renewal and productivity upgrades for smaller hospitals and provincial providers, where aging scanners and tighter budgets intersect with reimbursement mechanics that recognize AI-assisted reconstruction. NHIS updates effective January 2025 that reduced patient copayments for many CT-based cancer checks and broadened reimbursement to include AI-assisted reconstruction create room for vendors to package software licenses, service, and dose-performance reporting into subscription or usage-based models that fit HIRA facility-fee economics.
On supply and capability, Korea continues to attract medtech investment footprints that can be leveraged for faster service response, training, and localization of digital features. Siemens Healthineers announced an approximately USD 50 million, five-year investment plan (late 2024) tied to its Pohang production facility, and GE HealthCare operates a major ultrasound R&D and manufacturing hub in Seongnam that supports exports at scale; while these are not CT-dedicated disclosures, they indicate the depth of local infrastructure CT vendors can build on through shared field-service networks, digital platform deployment, and regional procurement engagement. At the same time, MFDS integrated device-information management and ongoing work aligned with IMDRF practices support more standardized lifecycle oversight, which favors offerings that can document traceability, cybersecurity controls, and real-world performance across multi-site hospital groups.
Recent Industry Developments
- March 2026: GE HealthCare's FDA 510(k) clearance for Photonova Spectra photon-counting CT system (Deep Silicon detector technology) expands the technology frontier in computed tomography. The development strengthens GE HealthCare's competitive differentiation and could affect image quality and radiation dose management in the market.
- June 2025: GE HealthCare and Kalbe inaugurated a CT-scanner production plant to reinforce supply chains for Asia, including South Korea. The expansion increases domestic manufacturing footprint and may shift pricing and availability dynamics in the Korea market.
- April 2024: Canon Medical Systems Korea installed Aquilion Exceed LB AI-powered CT simulation system with AiCE at Yeungnam University Medical Center. The deployment highlights AI software integration trends that influence procurement and dose reduction strategies in Korea.
Research Methodology Framework and Report Scope
Market Definition and Coverage
This market is defined as revenue generated in South Korea from computed tomography (CT) systems sold into healthcare settings, including equipment value tied to new installations and replacement purchases, captured in USD terms for the study period.
Scope exclusions: We exclude procedure and service revenues, contrast media, and standalone image viewing software that is not sold as part of the CT system purchase.
Segmentation Overview
- By Product Type
- Low Slice
- Medium Slice
- High Slice
- By Application
- Oncology
- Neurology
- Cardiovascular
- Musculoskeletal
- Other Applications
- By Mobility
- Fixed Systems
- Mobile Systems
- By End User
- Hospitals
- Diagnostic Imaging Centers
- Others
Data Sources, Market Sizing, and Validation
Desk Research
Desk research started with building the demand context for CT in South Korea, so the model is anchored to real care delivery signals and purchasing pathways. We reviewed public health and reimbursement context, where sources such as the Korea Disease Control and Prevention Agency (KDCA) and the Health Insurance Review and Assessment Service (HIRA) help clarify screening and utilization patterns that influence scanner needs.
On the supply side, we used import and export statistics and broader macro indicators to cross-check shipment direction and price ranges, using sources such as UN Comtrade, the World Bank, OECD health statistics, and peer-reviewed radiology literature for technology adoption and dose related trends. We also referenced company annual reports, investor materials, and credible press coverage, and we used paid subscriptions for company financials and intelligence plus patent databases to verify product cycles and launch timing. The desk sources mentioned above are illustrative only, and we also reviewed other public documents and datasets during data collection, validation, and clarification.
Primary Interviews and Surveys
Primary work focused on validating what the desk sources cannot fully show, especially replacement timing, tender behavior, and price realization by slice class and mobility type. We spoke with hospital radiology stakeholders, procurement teams, distributors, and service specialists across South Korea, so assumptions on install base mix, upgrade triggers, and purchasing cycles could be tightened and then checked back against the modeled totals.
Distribution of primary research fieldwork respondents
| Company type | Respondent position |
|---|---|
| Top tier: 36% | CXOs: 14% |
| Mid tier: 46% | Functional/Unit leaders: 35% |
| Smaller Players: 18% | Managers: 51% |
Market-Sizing & Forecasting
Market sizing was built using a top-down demand pool reconstruction that starts from the country installed base and replacement need, then applies expected procurement timing and mix shifts to arrive at annual system revenue. To keep the results grounded, we corroborated totals with selective bottom-up checks, such as sampled average selling price (ASP) by slice band multiplied by estimated annual unit placements, followed by channel checks on tender wins and delivery lead times.
Key inputs used in the model include CT installed base and age profile, public and private hospital budget cycles, slice mix shifts (for example, movement toward higher slice systems for oncology and cardiology), mobility demand for emergency and smaller facilities, and ASP progression based on configuration and local deal structure. Where unit level visibility was incomplete, gaps were handled by using conservative ranges from interview feedback, then stress testing against import trends and spending patterns. For forecasting, we ran scenario analysis around replacement backlog release, reimbursement stability, and procurement delays. The final trajectory was aligned to what primary respondents see as realistic adoption and pricing direction over 2026-2031.
Data Validation & Update Cycle
Validation was done through triangulation across independent signals, so one dataset does not dominate the outcome. We compared model outputs with checks such as implied units from value and ASP bands, replacement rate reasonableness versus installed base age, and visible procurement activity, then reviewed any large variances before sign off.
A second analyst review is used to re-check formulas, assumptions, and year to year continuity, and sources are revisited when a number breaks expected relationships. If a material change is observed, such as a reimbursement shift or a procurement pause, we trigger follow-up calls to reconfirm the related assumptions. Reports are refreshed annually, with interim updates for material events, and a final pre-delivery pass is completed so clients receive the latest updated view.
Mordor Intelligence's South Korea Computed Tomography Market Sizing Compared With Other Published Estimates
Published CT market values for South Korea can differ even when they look like they are describing the same equipment, because the scope and the counting rules are not always aligned. Differences usually come from what is treated as a CT system sale versus adjacent imaging devices, how prices are normalized into USD, and how replacement cycles are handled when hospitals delay upgrades.
The biggest gap driver is whether cone beam and other adjacent CT-like devices are included. Other gaps typically come from using a flat CAGR without validating ASP spread by configuration, mixing shipment values with domestic installations, or using an older currency conversion point that can shift the apparent market size in a single year.
Mordor Intelligence counts only clinical CT system revenues tied to hospital and diagnostic installations, then applies slice mix and replacement timing checks before finalizing the total.
Benchmark comparison
| Source | Market Size | Gaps in Research Methodology |
|---|---|---|
| Mordor Intelligence | USD 220.99 M (2025) | |
| Regional Consultancy A | USD 93.40 M (2024) | Often narrows the scope to selected slice categories and can miss higher slice installations plus mobile CT demand, and the value is sensitive to the currency timing used for conversion. |
| Trade Journal B | USD 212.98 M (2023) | Typically applies a single growth rate to extend history, with limited validation of replacement lag, tender driven purchasing cycles, and ASP dispersion by configuration and end user. |
The spread in the table is mostly explained by scope and by how replacement and pricing are treated year to year. When the model is tied to installed base renewal logic and checked against procurement signals, the final number stays traceable to clear variables, and it can be repeated and updated without changing the core steps each cycle.
Key Questions Answered in the Report
What is the current size of the South Korea computed tomography market?
The South Korea computed tomography market is valued at USD 237.84 million in 2026 and is projected to reach USD 343.47 million by 2031 at a 7.63% CAGR.
Which product category leads the market today?
High-slice CT scanners command the largest 34.62% revenue share, while medium-slice units are expanding fastest at 8.16% CAGR.
Why are neurology scans growing faster than other applications?
The nationwide rollout of hyper-acute stroke centers and AI-assisted large-vessel-occlusion detection is driving an 8.32% CAGR for neurology CT.
How is mobile CT adoption influencing rural healthcare?
Mobile scanners operating on provincial circuits have cut patient transfer by 37% and underpin the fastest growth within the mobility segment at 8.54% CAGR.
What role does government reimbursement play in CT uptake?
NHIS now covers 90% of many CT procedures, and updated facility fees have accelerated hardware renewal, supporting consistent market growth.
Which vendors are shaping the competitive landscape?
GE HealthCare, Siemens Healthineers, and Philips lead hardware sales, while domestic AI innovators such as Lunit provide software differentiation that influences purchasing decisions.