
Market Overview
| Study Period | 2020 - 2031 |
|---|---|
| Forecast Data Period | 2026 - 2031 |
| Base Year Market Size (2025) | USD 684.93 Million |
| Market Size (2026) | USD 720.42 Million |
| Market Size (2031) | USD 912.46 Million |
| Growth Rate (2026 - 2031) | 4.84 % |
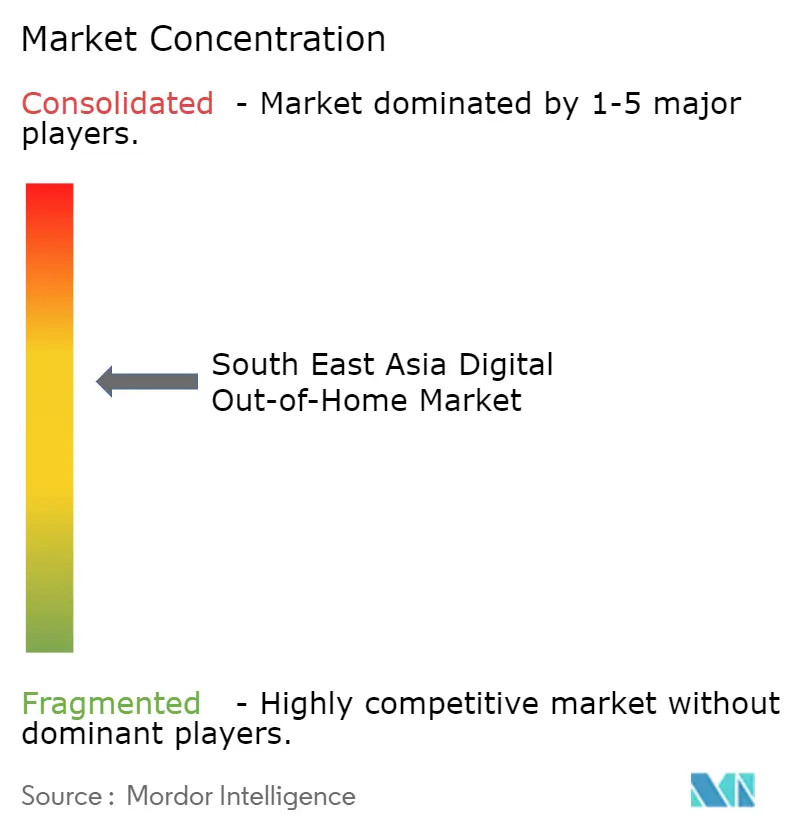
| Market Concentration | Medium |
Major Players_Market__company_logog.webp) *Disclaimer: Major Players sorted in no particular order Image © Mordor Intelligence. Reuse requires attribution under CC BY 4.0. | |
South East Asia Digital Out-of-Home Market Analysis by Mordor Intelligence
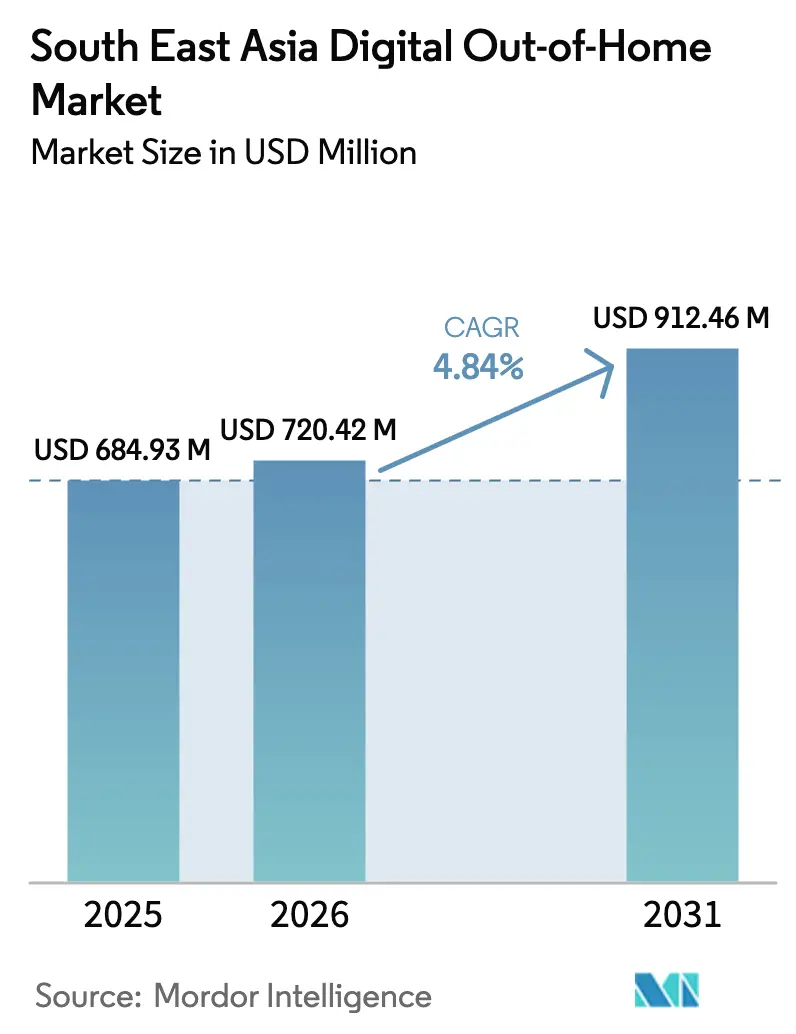
The Southeast Asia digital out-of-home market size was valued at USD 684.93 million in 2025 and is estimated to grow from USD 720.42 million in 2026 to reach USD 912.46 million by 2031, at a CAGR of 4.84% during the forecast period (2026-2031). Advertisers are shifting away from static billboards toward data-driven formats that allow real-time creative rotation, while airports and transit hubs absorb a larger share of regional budgets. Programmatic pipes shorten activation cycles from weeks to hours, enabling brands to trigger messages when weather changes or foot-traffic surges. Indonesia contributes the largest slice of revenue because Jakarta’s dense corridors host thousands of newly digitized panels, yet Vietnam is on a faster growth curve as elevator and transit screens proliferate in Hanoi and Ho Chi Minh City. Operators that integrate super-app purchase data can now link outdoor exposures to actual transactions, converting what was once a pure awareness channel into a performance engine.
Key Report Takeaways
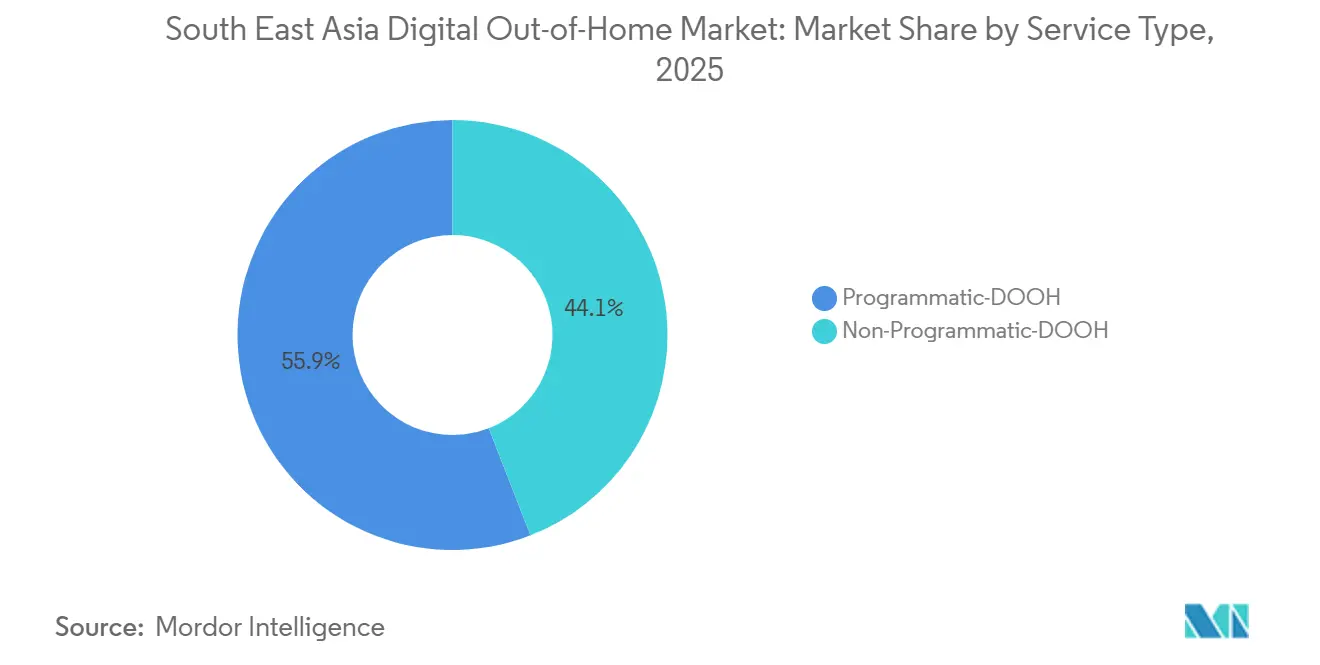
- By service type, non-programmatic formats held 55.91% of 2025 revenue, while programmatic inventory is forecast to post a 5.32% CAGR through 2031.
- By application, billboards accounted for 37.98% of the Southeast Asia digital out-of-home market share in 2025, whereas transit screens are projected to expand at a 5.67% CAGR to 2031.
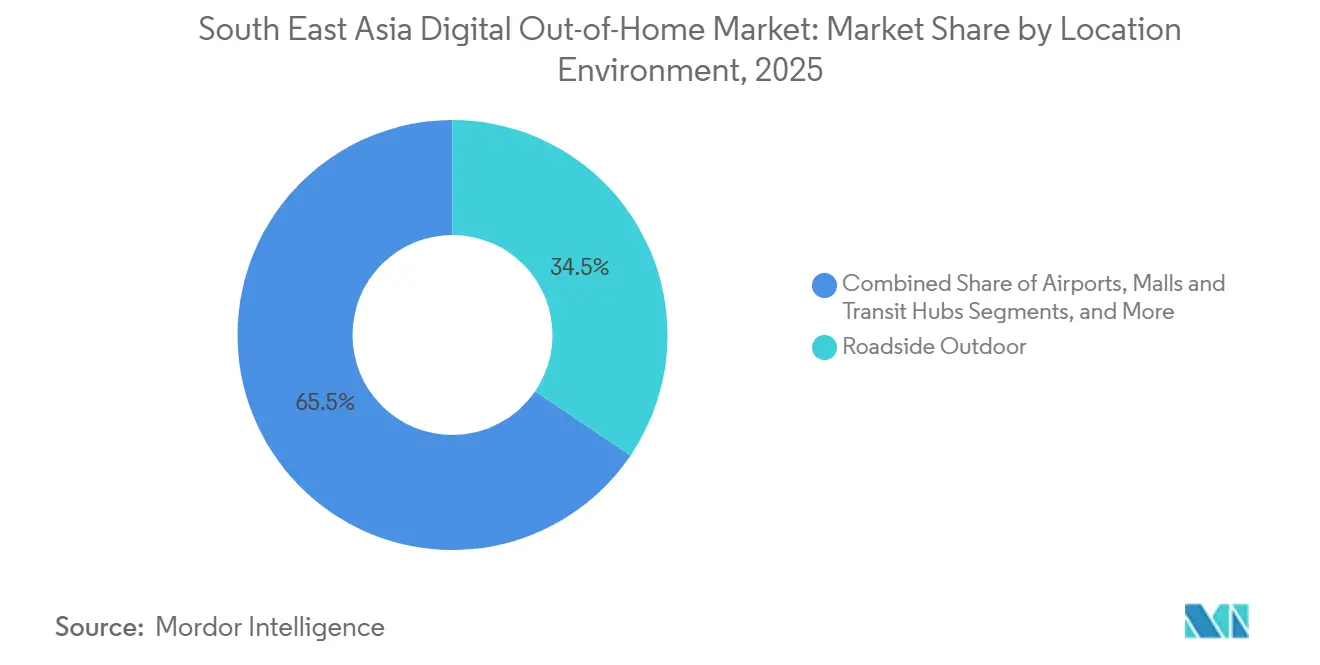
- By location environment, roadside placements captured 34.49% of spend in 2025, yet airport inventory is projected to grow at a 6.41% CAGR over the forecast window.
- By end-user, retail advertisers led with 21.04% of spend in 2025, while healthcare is on track for the fastest 5.23% CAGR through 2031.
- By Region, Indonesia retained 27.17% of regional revenue in 2025, whereas Vietnam is set to record the highest 6.11% CAGR to 2031.
Note: Market size and forecast figures in this report are generated using Mordor Intelligence’s proprietary estimation framework, updated with the latest available data and insights as of 2026.
Market Trends and Insights
Drivers Impact Analysis of South East Asia Digital Out-of-Home Market*
| Driver | (~) % Impact on CAGR Forecast | Geographic Relevance | Impact Timeline |
|---|---|---|---|
| Rapid Urbanisation and Transit-Hub Footfall Surge | +1.2% | Indonesia, Vietnam, Thailand, Philippines | Medium term (2-4 years) |
| Government Smart-City Investments in Digital Signage | +0.9% | Singapore, Malaysia, Thailand | Long term (≥ 4 years) |
| Explosion of Programmatic DOOH Buying Platforms | +1.0% | Singapore, Indonesia, Thailand | Short term (≤ 2 years) |
| Omnichannel Retail and Consumer-Brand Ad-Spend Uptick | +0.8% | High e-commerce markets across region | Medium term (2-4 years) |
| 3D Anamorphic Billboards Driving Premium Inventory | +0.5% | Singapore, Malaysia, Thailand | Short term (≤ 2 years) |
| Super-App Retail-Media Integration with DOOH | +0.6% | Entire region | Medium term (2-4 years) |
| Source: Mordor Intelligence | |||
Rapid Urbanization And Transit-Hub Footfall Surge
City populations are growing faster than infrastructure, funneling commuters into rail stations and bus interchanges that deliver long dwell times and clear sight lines for screens. In Jakarta, more than 30 million daily digital impressions originate from corridors such as Sudirman and Gatot Subroto, where inventory has been expanding above 60% annually. Vietnam’s economic boom raises both personal mobility and elevator-screen deployments, with one network reaching roughly 40 million users every day.[1] Bangkok’s upcoming Pink and Purple lines will add fresh captive audiences to VGI’s existing 4.5 billion annual transactions. Singapore’s Stellar Ace links platform walls, in-train screens, and exit gates across 95 stations to enable sequential storytelling. Because regional GDP momentum is set to hold above 6% in Vietnam and more than 5% in Indonesia through 2026, transit investments will keep widening the pool of addressable impressions.
Government Smart-City Investments In Digital Signage
Smart-city blueprints push digital signage into streetscapes by earmarking it for passenger-information kiosks and public Wi-Fi nodes that rely on ad support to cover costs. Singapore awarded a SGD 150 million (USD 118 million) contract for dynamic bus screens that rotate messages based on route data.[2] Kuala Lumpur and provincial Thai capitals gain similar backing through national digital-economy funds. Standardized brightness caps, resolution rules, and content-management protocols lower creative production costs across cities, encouraging multi-market buys. Jakarta’s stricter rules on traditional banners, adopted in 2015, effectively nudged operators toward digital formats that meet compliance thresholds. Because concession tenures span 10-15 years, the resulting inventory pipeline gives the Southeast Asia digital out-of-home market a stable growth floor.
Explosion Of Programmatic DOOH Buying Platforms
Demand-side platforms such as Vistar Media, Hivestack, and VIOOH compress campaign lead times and let brands swap artwork when weather, traffic, or purchase-intent signals change. Vistar logged a 182% sales jump in Southeast Asia during 2023 as advertisers embraced cost-per-thousand bidding tied to third-party verification.[3] A Plan B-Vistar tie-up plugged more than 500 screens in 7-Eleven stores into programmatic pipes that trigger offers at foot-traffic spikes. Although the latest State of Nation study shows half of all campaigns already contain a programmatic element, two-thirds still run on guaranteed deals, underscoring buyer appetite for inventory certainty during the transition phase. Middleware like Moving Walls’ LMX platform normalizes audience data across disparate owners, helping close measurement gaps that once deterred large advertisers. Global giant JCDecaux reported 45.6% programmatic revenue growth in 2024, confirming that automated trading is shifting from test budgets to mainstream allocations.
Omnichannel Retail And Consumer-Brand Ad-Spend Uptick
Retailers now combine outdoor priming with mobile retargeting and in-store promotions because evidence shows connected campaigns drive higher return on ad spend. A Trade Desk survey found omnichannel plans are 1.5 times more persuasive and 2.2 times less fatiguing than single-channel efforts, while adding a fifth channel produced a 30% cost-per-acquisition drop. Tiger Beer’s Singapore push blended programmatic DOOH, display ads, and grocery data to lift sales 1.32 times and achieve a 1,873% return. Brands can already purchase super-app Grab ad units that join ride-hail, food delivery, and retail media signals, while Jaya Grocer now links GrabAds exposures to scanned in-store purchases. Because e-commerce penetration sits between 59% and 68% in key markets, retail-media integration positions the Southeast Asia digital out-of-home market to absorb budgets that used to belong solely to search and social.
Restraints Impact Analysis of South East Asia Digital Out-of-Home Market*
| Restraint | (~) % Impact on CAGR Forecast | Geographic Relevance | Impact Timeline |
|---|---|---|---|
| High Capex and Ongoing Maintenance Costs | -0.7% | Indonesia, Vietnam, Philippines | Short term (≤ 2 years) |
| Fragmented Supply Limiting Unified Measurement | -0.5% | Singapore, Malaysia, Thailand, Indonesia, Vietnam, Philippines | Medium term (2-4 years) |
| Country-Specific Brightness and Content Limits | -0.3% | Singapore, Malaysia, Thailand | Long term (≥ 4 years) |
| Shortage of Skilled LED or IoT Technicians | -0.3% | Indonesia, Vietnam, Philippines, Thailand | Medium term (2-4 years) |
| Source: Mordor Intelligence | |||
High Capex And Ongoing Maintenance Costs
Fine-pitch indoor LEDs cost as much as USD 2,500 per square meter, while outdoor panels run USD 800-1,200 and still require another 20%-40% for installation. Supply-chain snags stretch driver-IC lead times past 20 weeks, forcing operators to lock working capital months before revenue flows. Kuala Lumpur International Airport’s recent 14 ft × 81 ft screen needed structural reinforcement and custom CMS integration, showing why premium sites remain the domain of deep-pocket incumbents. Humid tropical climates accelerate module degradation, adding quarterly service costs that can consume up to 15% of annual revenue. Singapore pads budgets further through mandatory professional-engineer certification for any structure above 4 m in height. Until financing costs fall or hardware prices decline, capital intensity will slow network rollouts in emerging cities.
Fragmented Supply Limiting Unified Measurement
Advertisers still juggle incompatible reach metrics, raising planning costs for cross-country flights. Only half of campaigns use any form of programmatic buying, and those that do mostly rely on guaranteed deals because real-time bidding lacks common impression standards.[4] Operators sometimes pay for manual head-count studies to secure buyer trust, as Plan B did in February 2024, underscoring the absence of turnkey data feeds. JCDecaux’s AI-driven metro analytics remain confined to Hong Kong, leaving Southeast Asian networks dependent on survey panels or mobile-location extrapolations that lack granularity. The open-source OMIG framework promises relief, yet adoption is voluntary and still competes with proprietary stacks from Hivestack and Vistar. Privacy statutes across the region further restrict device identifiers, hampering closed-loop attribution without explicit consent.
*Our forecasts treat driver/restraint impacts as directional, not additive. The impact forecasts reflect baseline growth, mix effects, and variable interactions.
South East Asia Digital Out-of-Home Market Segment Analysis
By Service Type:
Programmatic Momentum Outpaces Direct SalesNon-programmatic formats still delivered 55.91% of revenue in 2025, but automated pipes are forecast to grow faster as agencies migrate display and video workflows into outdoor. Vistar’s 182% jump in Southeast Asian billings and the steady rise of programmatic-guaranteed deals underline early demand for inventory certainty. Yet long-term contracts remain attractive for auto or tourism launches that require unbroken share-of-voice along marquee roadways. The Southeast Asia digital out-of-home market size for programmatic inventory is set for a 5.32% CAGR, drawing on first-party retail data links that fuel outcome-based buying.
Direct deals will keep a presence because premium airport façades and landmark billboards often bundle site exclusivity, content audits, and creative-approval windows that are hard to replicate inside open exchanges. Integration costs, APIs, CMS upgrades, data layers, still deter smaller owners, slowing the shift in secondary cities. As supply-side fragmentation recedes and verification widens, the Southeast Asia digital out-of-home market will likely mirror display advertising’s earlier swing from reservations to auctions.
By Application:
Transit Screens Ride Commuter WaveBillboards captured 37.98% of 2025 spend, yet many prime corridors are already saturated, and new permits face visual-pollution caps. Transit concessions offer untapped dwell time at gates, concourses, and train cars, which explains the application’s projected 5.67% CAGR through 2031. Operators such as VGI lock in multi-year rights that carve defensive moats around Bangkok’s BTS and Malaysia’s commuter rail.
The Southeast Asia digital out-of-home market share lead held by billboards will erode gradually as rail, bus, and convenience-store screens compound in volume and add programmatic triggers tied to passenger peaks. Street furniture and in-store kiosks provide hyperlocal reach for neighborhood retailers, although their fragmented ownership lengthens the path to unified measurement. Creative formats such as forced-perspective 3D enrich both billboards and transit walls, but commuter environments deliver predictable foot-traffic that brand planners prize for frequency control.
By Location Environment:
Airports Lift Premium YieldsRoadside panels still amassed 34.49% of 2025 revenue because motorists traverse ring roads and arterials daily. Yet airport networks post the strongest 6.41% CAGR forecast as cross-border travel rebounds. Changi Airport alone handled 67.7 million passengers last year, giving JCDecaux screens cost-per-thousand rates that top USD 45 in high-traffic zones. Kuala Lumpur International and Bangkok Suvarnabhumi offer similar premium tiers, and advertisers willingly pay because traveler demographics skew toward affluent decision-makers.
The Southeast Asia digital out-of-home market size held by airport media is small today but expands faster than other environments thanks to duty-free, luxury retail, and tourism boards that crave reach in a single high-value venue. Malls and transit hubs add blended foot-traffic indoors, securing mid-tier rates while weather-proofing screens. Secondary environments such as campuses or stadiums remain tactical, yet operators eye them for incremental inventory once measurement harmonizes.

By End-User Industry:
Healthcare Advertising AcceleratesRetail still commands 21.04% of spend, driven by store traffic campaigns and seasonal promotions. However, healthcare and wellness brands are allocating larger budgets at a 5.23% CAGR, aiming at commuters during morning peaks when message recall is high. Pharmaceutical players appreciate DOOH’s strict brand-safety context compared with social feeds, while fitness apps sponsor multi-screen bursts that coincide with health-check reminders.
Automotive, banking, and entertainment continue to underwrite marquee billboards and 3D anamorphic showcases but face plateauing growth. The Southeast Asia digital out-of-home market share held by healthcare will climb as ageing populations and preventive-care messaging gain urgency. Advertisers from telecom, consumer packaged goods, and education remain consistent but use data-driven buying to stretch budgets instead of boosting absolute spend.
Geography Analysis
Indonesia Digital Out-of-Home Market
Indonesia contributes 27.17% of regional revenue thanks to Jakarta’s 30 million daily impressions and swift static-to-digital conversions guided by supportive regulations. City Vision and Broadsign digitized more than 2,000 city-center panels, while super-apps Grab and Gojek enrich targeting with ride-hail data. E-commerce growth and rising smartphone adoption feed advertiser appetite, ensuring the Southeast Asia digital out-of-home market maintains Indonesia as its largest base.
Vietnam Digital Out-of-Home Market
Vietnam registers the highest 6.11% CAGR outlook, buoyed by 8% GDP expansion and elevator networks that now dominate commercial towers. Chicilon Media’s near-total share of high-rise lifts amplifies reach in Hanoi and Ho Chi Minh City, while government infrastructure drives more transit concessions. Strong electronics exports and fast-growing e-commerce volumes sustain media budgets, positioning Vietnam as the breakout market in the region.
ASEAN Digital Out-of-Home Market
Thailand, Singapore, and Malaysia round out the core. Thailand rebounded with 13% value growth last year, and VGI’s BTS exclusivity offers an unrivaled commuter footprint. Singapore’s mature regulations invite high CPM but also impose strict content codes that favor experienced operators. Malaysia’s 50 million-passenger airport volumes plus Big Tree Outdoor’s 7,500-panel network keep it a mid-scale yet strategically important market. The Philippines and the remainder of Southeast Asia stay smaller today but attract investment as mobile use and retail media networks widen.
Regulatory Landscape
Across Southeast Asia, DOOH deployments are governed by a patchwork of building-control, planning, and media-broadcast rules that varies by city, which makes compliance a practical gating factor for new screens and formats. Singapore is a useful reference point, where outdoor advertising displays require a licence from the Commissioner of Building Control under the Building Control (Outdoor Advertising) Regulations, and some sites also require Urban Redevelopment Authority (URA) approvals (for example, within the Central Area or on conservation buildings).
Singapore also regulates content delivery on public digital displays through the Infocomm Media Development Authority (IMDA) via the Broadcasting (Class Licence - Broadcasting to Digital Display Panels) Notification 2020, which shapes operating workflows for network operators and advertisers. Regulatory updates continue to affect permitting clarity, with the Building Control (Outdoor Advertising) (Amendment) Regulations 2026 scheduled to be gazetted on 1 October 2026 and to take effect on 2 November 2026, revising definitions to better delineate what falls under licensing for outdoor advertising structures, including digital displays.
Competitive Landscape
Global incumbents JCDecaux and Clear Channel defend airport and luxury roadside sites, yet regional champions such as VGI, Plan B Media, and Big Tree Outdoor leverage exclusive concessions to cement local moats. JCDecaux logged 6.1% year-over-year DOOH revenue growth in Q3 2025, and its VIOOH exchange now funnels automated demand into Singapore and Malaysia screens. Clear Channel integrates Broadsign to modernize its Singapore footprint and teamed with Scoot Airlines for branded transit flows.
Regional specialists scale through technology and data. Moving Walls’ AI-enabled LMX platform pairs post-campaign attribution with supply aggregation, winning group-agency alignments. Hivestack partners with oOh!media to expose AUD 635.6 million (USD 422 million) in Australasian inventory to Southeast Asian buyers, blending cross-border reach with local relevance. Big Tree Outdoor and Vistar opened more than 7,500 panels to cost-per-thousand bidding, underscoring how programmatic alliances redraw competitive lines.
Disruptors exploit retail-media data. GroupM and GrabAds combine transaction signals with ride-hail and delivery impressions, while Gojek’s GoScreen offers hyperlocal targeting that met 130% of impression goals during pandemic periods. Hardware vendors Daktronics and Shenzhen-based suppliers embed forced-perspective 3D features into façades, differentiating owners who can finance marquee upgrades. As the OMIG framework diffuses, measurement parity should shift rivalry toward creative quality, data access, and speed of activation rather than purely on screen count.
South East Asia Digital Out-of-Home Industry Leaders
-
JCDecaux Singapore Pte Ltd
-
Clear Channel Singapore Pte Ltd
-
Ooh!Media Digital PTY Limited
-
Hivestack Inc.
-
Moove Media Pte Ltd
- *Disclaimer: Major Players sorted in no particular order
South East Asia Digital Out-of-Home Market Companies Covered in this Report
- JCDecaux Singapore Pte Ltd.
- Clear Channel Singapore Pte Ltd.
- oOh!media Limited
- Hivestack Inc.
- Vistar Media Inc.
- Talon Outdoor Ltd.
- Moove Media Pte Ltd.
- SPHMBO Pte Ltd (Singapore Press Holdings)
- Plan B Media Public Co Ltd.
- VGI Public Co Ltd.
- Big Tree Outdoor Sdn Bhd
- TAC Media Sdn Bhd
- Moving Walls Pte Ltd.
- City Vision Outdoor Advertising PT
- Daktronics Inc.
- Mediatech Services Pte Ltd.
- Redberry Media Sdn Bhd
- SEAtronics Inc.
Market Opportunities and Future Outlook
The clearest opportunity areas are where the region is adding regulated, high-dwell-time inventory and where buyers can activate quickly with measurable outcomes. Singapore is a concrete example of transit-led DOOH expansion tied to public infrastructure programs: the Land Transport Authority awarded a SGD 150 million contract for dynamic bus screens, and Moove Media began rolling out these screens under its seven-year contract in January 2026, expanding the pool of impressions for time- and route-based messaging.
A second opportunity centers on compliance-led standardization that reduces friction for network buildouts and cross-asset buying. In Singapore, the Building Control (Outdoor Advertising) (Amendment) Regulations 2026 (gazetted 1 October 2026, effective 2 November 2026) update definitions for advertisements and signboards, improving transparency on what requires licensing, while IMDA's Broadcasting (Class Licence - Broadcasting to Digital Display Panels) Notification 2020 sets the operating frame for broadcast content obligations for digital display operators in public places and transport settings. For operators and DSP partners, clearer permitting and operating rules support larger, multi-location deployments and help sustain programmatic DOOH growth by reducing compliance ambiguity across premium corridors, transit assets, and mixed-use developments.
Recent Industry Developments in South East Asia Digital Out-of-Home Market
- July 2026: Moove Media signed an MOU with Mediacorp and SBS Transit to explore integrated, cross-platform advertising solutions and curated content delivery across the transit network. The collaboration pairs premium transit DOOH inventory with a major content publisher and a transport operator, supporting packaged buys and more consistent commuter experiences.
- July 2026: Clear Channel Singapore launched a CityLink DOOH network of 18 high-definition screens across the CityLink transit corridor, supported by Adactive Asia's AdSign platform and audience analytics. The rollout expands premium transit-walkway inventory and strengthens data-enabled selling propositions for brands targeting high-footfall commuter flows.
- October 2025: Maybank Singapore ran a 100% bus-wrap campaign across 65 vehicles, described as the first fully wrapped fleet approved in a decade. The approval signaled more flexible acceptance of large-format mobile advertising executions, enabling bolder creative formats within transit environments.
South East Asia Digital Out-of-Home Market Report Scope and Research Methodology
Market Definition and Coverage
For this study, the market covers spending on digital out-of-home advertising inventory across Southeast Asia, where ads are delivered through electronically controlled screens in outdoor and place-based venues and are sold as media time.
Scope exclusions: This sizing does not include non-advertising digital signage (informational screens), hardware installation revenue, or creative production fees unless they are bundled as part of the media buy.
Segments Covered in This Report
- By Service Type
- Programmatic-DOOH
- Non-Programmatic-DOOH
- By Application
- Billboard
- Transit
- Street Furniture
- Other Applications
- By Location Environment
- Roadside Outdoor
- Airports
- Malls and Transit Hubs
- In-Store and Indoor Venues
- Other Location Environments
- By End-User Industry
- Automotive
- Retail
- Healthcare
- Banking and Financial Services (BFSI)
- Media and Entertainment
- Other End-User Industries
- By Geography
- Singapore
- Malaysia
- Thailand
- Indonesia
- Philippines
- Vietnam
- Rest of South-East Asia
Data Sources, Market Sizing, and Validation
Desk Research
Desk research was used to map the addressable DOOH footprint and the demand pool behind it before any model was built. We relied on public and official sources that help quantify advertising activity and mobility, such as national statistics office publications in ASEAN countries, central bank and finance ministry materials, telecom and digital economy reports from regional regulators, and transport authority releases (airport, rail, and metro traffic). We also used trade body commentary where it provides out-of-home and advertising spend context.
To convert these signals into usable inputs, we reviewed operator and media owner disclosures, company annual reports, investor decks, and credible press coverage for screen rollouts, utilization levels, and rate-card direction. In a few places, paid subscriptions tracking company financials, shipment-level trade flows, and patent activity were used as cross-checks for scale and the timing of digitization investments. The sources listed here are illustrative only, and we used additional references to collect data, validate figures, and clarify open items.
Primary Interviews and Surveys
Primary work focused on confirming how much of OOH revenue is truly digital, how pricing changes by venue type, and how often inventory is sold via programmatic routes versus direct deals. We interviewed a mix of media owners, agencies, buyers, and venue partners across major ASEAN markets, so we could tighten assumptions around occupancy, audience delivery, and budgeting behavior where desk inputs were thin.
Distribution of primary research fieldwork respondents
| Company type | Respondent position |
|---|---|
| Top tier: 38% | CXOs: 21% |
| Mid tier: 41% | Functional/Unit leaders: 26% |
| Smaller Players: 21% | Managers: 53% |
Market-Sizing & Forecasting
Sizing starts with a top-down build that reconstructs the regional DOOH pool from advertising spend direction, OOH to DOOH conversion rates, and the practical supply of monetizable digital faces in key venues. Country totals are then shaped using inputs such as screen count additions and replacements, average playable ad loops, typical sell-through (occupancy) by transit and roadside locations, and price levels implied by posted rate cards and observed discounting. Where available, airport passenger throughput, metro ridership, and retail footfall trends were used as reality checks, since these directly affect audience delivery and pricing power.
After that, selective bottom-up approximations were used to pressure-test the totals. This included sampled ASP (effective CPM or slot pricing) multiplied by estimated impressions capacity, plus channel checks on agency spend splits across formats like billboards, street furniture, and transit. When company disclosures were incomplete, we closed gaps using peer benchmarks within the same city tier and venue class, then adjusted after follow-up calls.
Forecasts were generated using scenario analysis backed by year-by-year drivers, since policy changes, new screen permits, and major transit expansions can shift the curve quickly. The forward path was anchored on variables such as digitization pace, programmatic share growth, inflation and currency timing, and the expected rebound or slowdown in travel and retail activity. These assumptions were then validated through interview consensus.
Data Validation & Update Cycle
Results were validated through multiple checks so the final number stays tied to observable market behavior. We compared modeled DOOH revenue against independent signals such as reported OOH spend movement, major screen network expansion announcements, and demand-side feedback on booking lead times and occupancy patterns. Outliers were reviewed at the country level, then reworked if the implied pricing or utilization looked inconsistent with venue traffic and sales practice.
Before sign-off, a separate analyst review is completed to challenge assumptions, math, and country roll-ups, followed by re-contact triggers when a key input shifts materially. Reports are refreshed annually, and interim updates are made when major events occur, such as regulatory changes, large mergers, or step-change inventory launches. Right before delivery, an analyst performs a fresh pass so clients receive the latest updated view.
Mordor Intelligence's South East Asia Digital Out of Home Market Size Versus Other Published Estimates
Published market sizes for Southeast Asia DOOH can look far apart because the boundary is easy to stretch, and the underlying inputs are not always visible. In practice, differences come from what is counted as DOOH media versus digital signage, how indoor networks are treated, and whether the figures reflect net media revenue or broader ecosystem value.
Key gaps usually show up in how screen inventory is translated into monetizable supply, and then priced. Some estimates lean on aggressive utilization or assume rapid price lift without tying it back to venue traffic, agency buying patterns, or programmatic adoption. Currency conversion timing also matters in this region, since local pricing is often negotiated in local currency but reported in USD.
Benchmark comparison
| Source | Market Size | Gaps in Research Methodology |
|---|---|---|
| Mordor Intelligence | USD 684.93 M (2025) | |
| Regional Consultancy A | USD 756.44 M (2026) | Uses a later year and appears to apply a faster ramp in sell-through and pricing, with limited clarity on whether non-media signage networks and bundled services are removed before totaling. |
| Industry Association B | USD 650.00 M (2025) | Often reflects member-reported media spend, which can undercount independent operators and smaller city networks, and may exclude newer indoor and programmatic traded inventory that is not consistently captured. |
Screen rollout announcements and venue traffic indicators are the practical checks that keep Mordor Intelligence's estimate aligned to a monetizable DOOH demand pool, rather than a broad digital signage universe. Overall, the spread across publishers mainly tracks scope boundaries and how utilization and pricing are normalized across countries, which is why documenting those steps helps buyers compare like for like.
Key Questions Answered in the Report
What is the projected value of the Southeast Asia digital out-of-home market in 2031?
The market is forecast to reach USD 912.46 million by 2031.
Which country contributes the largest revenue today?
Indonesia leads with 27.17% of 2025 regional spending thanks to Jakarta's dense screen network.
Which environment will grow fastest over the next five years?
Airport screens are expected to post the highest 6.41% CAGR as passenger volumes recover and advertisers seek affluent traveler audiences.
How quickly is programmatic inventory expanding?
Programmatic formats are projected to grow at a 5.32% CAGR through 2031 as automated pipes and data integrations mature.
Why are healthcare brands increasing spend on outdoor screens?
Wellness and pharmaceutical advertisers value high commuter reach and strict brand-safety controls, lifting healthcares forecast CAGR to 5.23% through 2031.
What are the main obstacles to faster market expansion?
High upfront hardware costs and fragmented measurement standards slow new deployments and deter multi-country campaign buys.