
South America Wheat Market Analysis by Mordor Intelligence
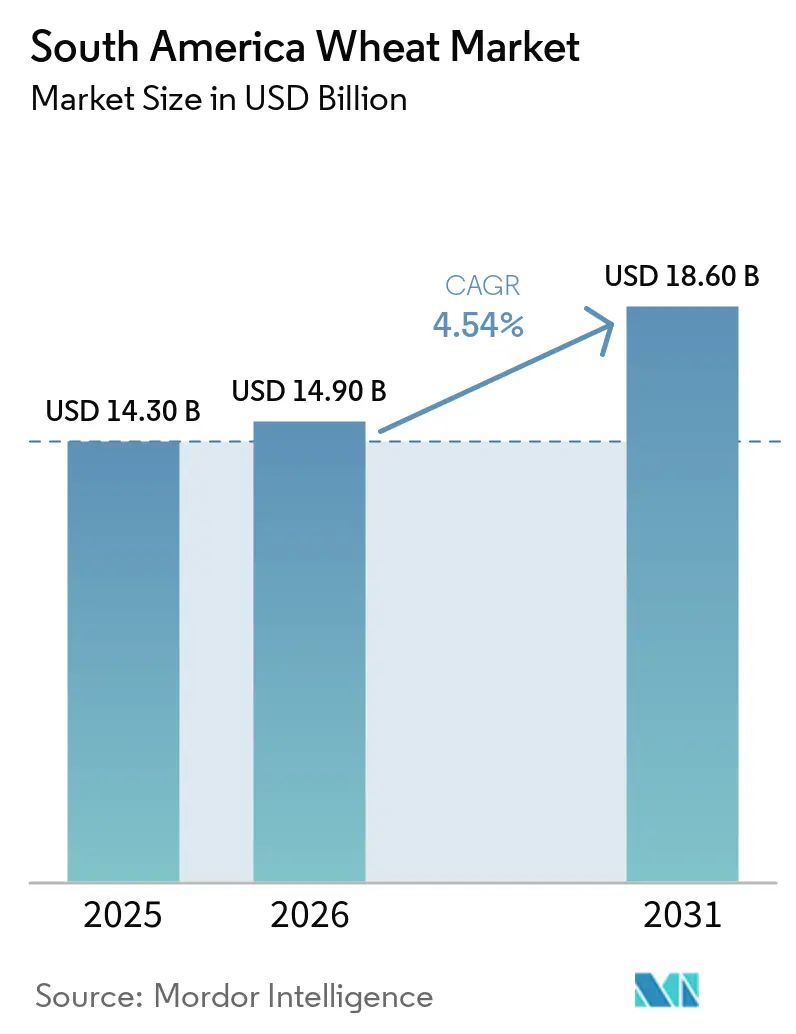
The South America wheat market size was USD 14.30 billion in 2025 and is projected to grow to USD 14.90 billion in 2026 and reach USD 18.60 billion by 2031, and is forecast to grow at a CAGR of 4.54% from 2026 to 2031. Brazil’s push for tropical wheat acreage, Argentina’s port and rail expansions, and Paraguay’s fast-growing export platform are redefining regional supply chains. Domestic bakery and pasta demand in Brazil is rising, Mercado Común del Sur (MERCOSUR) tariff preferences are intensifying intra-bloc trade, and new logistics corridors are lowering inland freight bills. Climate shocks, disease outbreaks, and smallholder financing gaps continue to widen yield variability, but multinationals still capture elevated origination margins. The South America wheat market is therefore evolving from a two-country axis into a three-country contest where logistics control and cultivar innovation matter as much as arable land.
Key Report Takeaways
- By geography, Brazil led the South America wheat market in 2025, accounting for 52.0%, and Paraguay is forecast to grow at a CAGR of 6.8% from 2026 to 2031.
Note: Market size and forecast figures in this report are generated using Mordor Intelligence’s proprietary estimation framework, updated with the latest available data and insights as of January 2026.
South America Wheat Market Trends and Insights
Drivers Impact Analysis*
| Driver | (~) % Impact on CAGR Forecast | Geographic Relevance | Impact Timeline |
|---|---|---|---|
| Increasing Domestic Wheat-Based Food Demand | +1.2% | Brazil, Argentina, Chile, urban Paraguay, and Uruguay | Medium term (2–4 years) |
| Government Push for Wheat Self-Sufficiency in Brazil | +0.9% | Brazil (Cerrado, South, Southeast) | Long term (≥ 4 years) |
| Port and Rail Upgrades Lowering Inland Freight Cost | +0.7% | Argentina (Rosario, Bahía Blanca), Brazil (Northern Arc), Paraguay (Villeta) | Medium term (2–4 years) |
| Mercado Comum do Sul (MERCOSUR) Tariff Preferences Stimulating Intra-Bloc Trade | +0.6% | Argentina, Brazil, Paraguay, Uruguay | Short term (≤ 2 years) |
| Adoption of Drought-Tolerant Cerrado Wheat Cultivars | +0.5% | Brazil (Cerrado), trials in Paraguay | Long term (≥ 4 years) |
| Carbon-Credit Premiums for Regenerative Wheat Farming | +0.3% | Argentina, Brazil, Paraguay | Long term (≥ 4 years) |
| Source: Mordor Intelligence | |||
Increasing Domestic Wheat-Based Food Demand
Urban income growth has lifted Brazil’s per-capita wheat intake from 58 kg in 2020 to 63 kg in 2025, bolstering flour, pasta, and biscuit factories[1]. Bakeries in São Paulo and Rio de Janeiro alone absorbed 4.2 million metric tons of flour in 2025, up 11% from 2023. Parallel demand is emerging in Argentina, where pasta exporters increased durum imports by 23% year-over-year to satisfy Chilean and Peruvian contracts. This sustained pull encourages acreage gains in Brazil’s Cerrado and Paraguay’s eastern departments, even though yield gaps remain 1.5-2.0 metric tons per hectare relative to temperate zones.
Government Push for Wheat Self-Sufficiency in Brazil
Brazil targets 4 million hectares by 2030, up from 2.8 million hectares in 2025, by subsidizing seed, crop insurance, and rural credit at 7.5% interest versus the 12% market rate [2]. Cerrado plantings rose 22% year-on-year in 2025, mostly in municipalities in Mato Grosso practicing double-cropping. Heat-tolerant cultivars such as BRS 264 yield 6 metric tons per hectare, doubling yields in Rio Grande do Sul. Freight remains a hurdle because wheat must travel up to 2,200 km to reach southern mills, adding USD 45–60 per metric ton to the haulage cost.
Port and Rail Upgrades Lowering Inland Freight Cost
Argentina’s Rosario complex added 2.5 million metric tons of throughput in 2025, trimming vessel waits to six days and slashing demurrage by USD 18 per metric ton. Brazil’s Northern Arc gained 4.2 million metric tons of new capacity during 2024-2025, creating a 2,400 km shorter Pacific route that saves USD 32 per metric ton to Asia-Pacific. Paraguay’s upgraded Villeta port now exports 1.8 million metric tons annually at a 22% lower logistics cost than previous truck-rail combinations[3]. These corridors redistribute trade flows toward land-locked producers and reduce dependence on the Santos and Buenos Aires gateways.
Mercado Comum do Sul (MERCOSUR) tariff preferences stimulating intra-bloc trade
Zero duty on wheat moving inside the bloc allowed 6.8 million metric tons of Argentine wheat to enter Brazil in 2025, a 14% jump over 2024. The January 2026 European Union (EU)–Mercado Común del Sur (MERCOSUR) accord introduces a 99,000-metric-ton quota at EUR 25 (USD 27.3) per metric ton, versus EUR 95 (USD 103.6) otherwise, motivating exporters to target Spain and Portugal. Cross-border joint-venture mills in Brazil’s border cities capitalize on the preference by blending Argentina high-protein wheat with local grains, adding 420,000 metric tons of flour capacity in 2025. Paraguay is replicating the model with a USD 48 million mill scheduled for 2027.
Restraints Impact Analysis*
| Restraint | (~) % Impact on CAGR Forecast | Geographic Relevance | Impact Timeline |
|---|---|---|---|
| Increasing Climate Variability | −0.8% | Argentina Pampas, Brazil Rio Grande do Sul, Paraguay Chaco | Short term (≤ 2 years) |
| Farm-Gate Price Volatility Linked to Chicago Board of Trade (CBOT) Futures | −0.5% | Argentina and Paraguay export zones | Short term (≤ 2 years) |
| Rising Wheat Blast Disease Outbreaks | −0.4% | Brazil Cerrado and Paraná, Paraguay Itapúa and Alto Paraná | Medium term (2–4 years) |
| Limited Rural Credit Access for Smallholders | −0.3% | Brazil Northeast and North, Paraguay smallholder belts, extra-Pampean Argentina | Long term (≥ 4 years) |
| Source: Mordor Intelligence | |||
Increasing Climate Variability
Late-season frosts cut Argentina’s 2024 harvest by 2.8 million metric tons and pushed Buenos Aires flour prices up 12%. Rio Grande do Sul lost 680,000 metric tons in 2025 after a 45-day drought. Rainfall outside historical norms now hits major producers every 2 to 3 years, exposing 1.8 million hectares without insurance coverage. The South America wheat market, therefore, carries a persistent weather premium, which complicates long-range hedging. Unless subsidized insurance expands beyond the current 28% of sown area, yield shocks will continue to inflate growers’ borrowing costs and curb technology upgrades.
Farm-gate price volatility linked to Chicago Board of Trade (CBOT) futures
Cash prices in Argentina and Paraguay show a 0.87 correlation with Chicago Board of Trade wheat, transmitting 34% futures swings to local income. Hedging costs are prohibitive because option premiums average 11% of contract value, above smallholder net margins. In 2025, Paraguayan exporters lost USD 31 million when prices slumped after news of Black Sea quotas, despite a tight regional balance. Structural price-taking status limits capital investment across much of the farm base. The absence of domestic futures markets in Brazil and Paraguay prolongs settlement delays and widens basis spreads during currency swings, adding up to USD 14 per metric ton in extra export risk.
*Our forecasts treat driver/restraint impacts as directional, not additive. The impact forecasts reflect baseline growth, mix effects, and variable interactions.
Geography Analysis
Brazil led the South America wheat market share, and accounted for 52% of regional consumption in 2025. Its deficit of 2 million metric tons is narrowing as Cerrado acreage rises, cutting millers’ freight bills and inventory costs. Paraguay is the fastest-growing contributor, expanding at a 6.8% CAGR through 2031, driven by land conversion and improved river logistics. Together, these two regions set the demand baseline and the supply growth engine that define the South America wheat market size landscape.
Argentina continued to be a significant exporter, maintaining substantial shipments in 2025, despite weather-related yield fluctuations that occasionally resulted in export restrictions. Chile depended on imports to meet a considerable portion of its demand, as high-value fruit crops limited the expansion of cereal cultivation. Uruguay and Bolivia played niche roles, either supplying or sourcing premium and specialty wheat that achieved higher prices in neighboring markets. Peru increased its durum wheat imports for pasta production, driven by a shift in urban diets toward convenience foods.
Regional growth is driven by advancements in infrastructure and cultivars, which reduce delivery costs and enhance climate resilience. Brazil's Northern Arc ports have significantly lowered Pacific freight costs, enabling access to inland regions previously considered logistically challenging. Paraguay's Villeta port has achieved notable cost reductions in exports, allowing growers to reinvest in practices such as no-till farming and precision seeding. These developments are anticipated to increase traded volumes and expand the addressable wheat market in South America over the next few years.
Regulatory Landscape
Wheat commercialization in South America is shaped by domestic sanitary and quality rules, along with MERCOSUR trade preferences. In Argentina, the Secretariat of Agriculture, Livestock, and Fisheries (SAGyP) and SENASA oversee compliance with marketing standards and food safety requirements aligned with the Argentine Food Code (CAA). MERCOSUR rules also support intra-bloc wheat trade (notably into Brazil) at zero duty, while wheat from outside the bloc faces higher tariff barriers in Brazil when volumes exceed defined thresholds.
Policy actions influence export economics and planting incentives. In June 2026, Argentina formalized a reduction in export duties on wheat and barley via Decree 423/2026, lowering the wheat export duty rate from 7.5% to 5.5%. In Brazil, regulatory oversight for imported agricultural and food products spans MAPA and ANVISA, with trade and product registration processes routed through SECEX under the Ministry of Development, Industry, Trade, and Services (MDIC). This routing affects how quickly millers can qualify new origins when domestic supply tightens.
Value Chain Analysis
The South America wheat value chain begins with seed genetics and agronomic inputs (fertilizer and crop protection) that feed farm production across Argentina, Brazil, and Paraguay. From there, wheat moves through on-farm storage and inland trucking, rail, and waterway legs, with origination executed by traders and cooperatives. Export and domestic distribution concentrate around a limited set of logistics gateways and corridors, including Argentina's Rosario complex, Brazil's Northern Arc port system, and Paraguay's river platform around Villeta, which are increasingly central for handling demurrage, turnaround times, and inland freight costs.
Trading houses and large grain handlers anchor price discovery, quality segregation (protein, moisture, contamination), and execution against miller specifications, while flour mills, bakeries, and pasta manufacturers anchor domestic demand, particularly in Brazil. A recurring constraint is logistics and storage, as Brazil's supply chain remains road-heavy with storage capacity below production, which keeps basis risk and seasonal bottlenecks elevated. Policy changes also flow through the chain quickly; Argentina's June 2026 export-duty reduction (Decree 423/2026) improves farm-gate netbacks and merchant export economics, while Brazil's structural import needs and compliance requirements (MAPA/ANVISA and SECEX processes) narrow sourcing options for Brazilian millers when they move beyond MERCOSUR origins.
Competitive Landscape
Bunge and Cargill sit at the top of the regional value chain, leveraging deep port ownership and rail links to load grain faster than rivals. Together, they originated roughly 42 million metric tons of South American wheat and coarse grains in 2025, anchoring contract positions with millers in Brazil and importers in Africa. Both firms invested a combined USD 605 million during 2024–2026 to expand the Rosario and Santarém corridors, trimming average vessel turnaround from 36 to 22 hours and capturing extra margin at demurrage-sensitive berths. Their trading speed, storage scale, and ocean-freight fleets help sustain the majority revenue share held collectively by the top five merchants.
Argentina accounts for a significant share of the installed flour-milling capacity and is expanding into organic and specialty flours, which command higher premiums over commodity wheat flour. The adoption of technology is driving differentiation across the value chain. Precision agriculture platforms, utilizing satellite imagery and soil sensors, enable top-performing producers to achieve notable yield improvements through variable-rate fertilizer application and optimized planting schedules. However, adoption remains limited due to high implementation costs, which exceed the budgets of smallholders.
Capital spending, digital logistics tools, and sustainability programs reveal how these players aim to expand market throughput and deepen farm ties over the next five years. Bunge’s February 2026 pledge of USD 280 million for additional Rosario capacity signals confidence in export growth from Argentina’s Pampas. Cargill and Archer Daniels Midland are layering carbon-credit services onto origination contracts, offering loan discounts that pull more hectares into certified regenerative farming. As port upgrades, data-driven agronomy, and green financing converge, the major traders are positioned to increase handled volumes and reinforce South America's central role in global wheat flows.
Market Opportunities and Future Outlook
The clearest opportunity in South America wheat is the shift from volume-only competition toward differentiated supply anchored in quality, traceability, and data-led logistics decisions. In April 2026, Embrapa launched the Wheat in Brazil digital platform to consolidate production-chain data, including imports, processing, and exports. The tool gives millers, traders, and policymakers a way to identify bottlenecks and prioritize investments across origination, storage, and corridors. Argentina's variety and profitability focus is also supported by the Wheat Evaluation Territorial Network (RET) managed by INTA and INASE, and by the Sembra Evolucion system, reported at 400,000 hectares of wheat under the system in the 2025/2026 season, which supports faster adoption of protected varieties and clearer commercial terms for seed innovation.
Infrastructure remains the key whitespace where execution can translate into delivered-cost competitiveness and corridor optionality. USDA highlighted in June 2026 that Brazil requires large-scale annual logistics investment (BRL 242 billion across road, rail, and waterways) to address structural bottlenecks, which aligns with the region's ongoing shift toward Northern Arc and inland-waterway solutions. Technology adoption on the farm and at the origination level is also broadening beyond large operators through precision platforms and satellite monitoring, including Cropwise referenced by Syngenta specialists in May 2026, targeting input efficiency and yield stability in climates and disease environments that have increased variability across recent seasons.
Recent Industry Developments
- June 2026: Argentina formalized a cut in wheat export duties under Decree 423/2026, reducing the rate from 7.5% to 5.5% effective June 2026. The change improves export economics for merchants and can lift farm-gate netbacks, supporting origination volumes through ports such as Rosario. It also reshapes how traders structure contracts and timing around export execution.
- February 2026: COFCO International imported China's first market-oriented wheat purchase from Argentina, with a cargo of about 70,000 metric tons. The transaction broadens Argentina's destination mix beyond its traditional regional and Atlantic markets and adds a new demand outlet for exportable surpluses. It also raises the importance of consistent quality segregation and documentation to meet destination requirements.
- September 2025: Argentina's National Advisory Commission on Agricultural Biotechnology (CONABIA) determined that certain genetically edited wheat lines developed by Neocrop Technologies with Buck Semillas (Argentina) and Campex Baer (Chile) are not classified as GMOs. The decision enables commercial validation in Argentina under conventional rules, accelerating the pathway for trait innovation such as higher fiber (amylose). Over time, this supports differentiated wheat offerings and seed-system investments tied to measurable end-use attributes.
Research Methodology Framework and Report Scope
Market Definition and Coverage
For this study, the market covers the value of wheat traded and consumed across South America as an agricultural commodity, aligned to regional production, imports, exports, and wholesale price signals that shape realized sales value.
Scope exclusions: Processed wheat products such as flour, pasta, and bread are excluded from the market value unless a source explicitly reports them inside its wheat scope.
Segmentation Overview
- By Geography
- Argentina
- Production Analysis (Area Harvested, Yield, and Production Volume)
- Consumption Analysis (Consumption Value and Volume)
- Import Market Analysis (Import Value, Volume, and Key Supplying Markets)
- Export Market Analysis (Export Value, Volume, and Key Destination Markets)
- Wholesale Price Trend Analysis and Forecast
- Regulatory Framework
- List of Key Players
- Logistics and Infrastructure
- Seasonality Analysis
- Brazil
- Production Analysis (Area Harvested, Yield, and Production Volume)
- Consumption Analysis (Consumption Value and Volume)
- Import Market Analysis (Import Value, Volume, and Key Supplying Markets)
- Export Market Analysis (Export Value, Volume, and Key Destination Markets)
- Wholesale Price Trend Analysis and Forecast
- Regulatory Framework
- List of Key Players
- Logistics and Infrastructure
- Seasonality Analysis
- Paraguay
- Production Analysis (Area Harvested, Yield, and Production Volume)
- Consumption Analysis (Consumption Value and Volume)
- Import Market Analysis (Import Value, Volume, and Key Supplying Markets)
- Export Market Analysis (Export Value, Volume, and Key Destination Markets)
- Wholesale Price Trend Analysis and Forecast
- Regulatory Framework
- List of Key Players
- Logistics and Infrastructure
- Seasonality Analysis
- Chile
- Production Analysis (Area Harvested, Yield, and Production Volume)
- Consumption Analysis (Consumption Value and Volume)
- Import Market Analysis (Import Value, Volume, and Key Supplying Markets)
- Export Market Analysis (Export Value, Volume, and Key Destination Markets)
- Wholesale Price Trend Analysis and Forecast
- Regulatory Framework
- List of Key Players
- Logistics and Infrastructure
- Seasonality Analysis
- Argentina
Data Sources, Market Sizing, and Validation
Desk Research
Desk work was used to set the factual base for wheat production, trade, and pricing, and then to map the policy and logistics context that can move volumes between countries. We referred to public sources such as FAOSTAT, USDA PSD, UN Comtrade, national statistics offices, and agriculture ministries in key producing countries, plus central bank or customs publications for trade and currency context.
To convert those inputs into a consistent value series, historical wholesale price references and trade unit values were reviewed alongside reputable press reporting and association websites, and then checked against company filings and investor materials where relevant. A paid subscription for company financials and intelligence, and an import and export shipment-level database, were used selectively to confirm exporter and importer activity patterns. These desk sources are illustrative only, and many additional public documents were used during data collection, cross-checking, and clarification.
Primary Interviews and Surveys
Our fieldwork covers South America and uses interviews and surveys with grain producers, traders, millers, importers, exporters, and food industry managers. Expert input tests crop outlooks, milling demand, import dependence, freight effects, quality premiums, and price assumptions. Responses help fill country-level gaps and triangulate the final model.
Distribution of primary research fieldwork respondents
| Company type | Respondent position |
|---|---|
| Top tier: 26% | CXOs: 15% |
| Mid tier: 49% | Functional/Unit leaders: 30% |
| Smaller Players: 25% | Managers: 55% |
Market-Sizing & Forecasting
Sizing started with a top-down reconstruction built from country-level wheat production and trade flows, then paired with wholesale price and trade unit value series to express the market in USD value. After forming the demand and supply pool, selective bottom-up checks were used to keep totals realistic, including sampled price times volume comparisons by country, and channel checks with traders and large buyers.
Key inputs in the model included harvested area and yield direction, import dependence in major consuming countries, exportable surplus from leading producers, seasonal price patterns around harvest and planting cycles, and currency movement that changes USD-denominated market value. Forecasts were developed using scenario analysis anchored to expected acreage and yield paths, policy and logistics developments, and likely price normalization discussed in primary calls. Where direct local price series were thin, gaps were handled using nearby market references and trade unit values, then re-tested with interview feedback before finalizing the series.
Data Validation & Update Cycle
Outputs were cross-checked against independent signals, including trade balances, implied per-ton values versus wholesale references, and year-over-year movement that should track known weather and policy impacts. Any large variance at a country level triggered a second pass on unit conversions, currency timing, and price assumptions, followed by peer review before sign-off.
The model is refreshed on an annual schedule, and interim updates are made when major events materially change supply, trade access, or prices. Before delivery, a final review pass is completed so clients receive the latest view aligned with the most recent public releases and validated expert feedback.
Mordor Intelligence's South America Wheat Market Size Compared Against Other Published Estimates
It is common to see different published values for South America wheat because each source can use a different market boundary, year basis, and pricing basis, and those choices shift the final USD number even when volume signals look similar.
Trade unit values, wholesale price references, and country production and trade balances are the checks that keep Mordor Intelligence's estimate aligned to the wheat commodity value pool, which is why figures that bundle wheat-based foods or use a different price concept can land higher or lower.
Benchmark comparison
| Source | Market Size | Gaps in Research Methodology |
|---|---|---|
| Mordor Intelligence | USD 14.30 B (2025) | |
| Global Consultancy A | USD 10.30 B (2024) | Uses an earlier base year and appears to mix the wheat commodity with downstream wheat-based products and end-use channels, which can change what is counted as market value and how prices are applied. |
| Trade Analytics Publisher B | USD 16.20 B (2035) | Covers a wider geography than South America and reports nominal wholesale price based value, so inflation and regional scope expansion can lift the reported figure versus a South America-only commodity boundary. |
Taken together, the spread mainly comes from geography boundaries and whether the value is tied to the wheat commodity or extended into processed products and different price bases. Using clear production, trade, and price inputs makes the sizing steps repeatable, and it also makes it easier to explain what is included when comparing estimates across sources.
Key Questions Answered in the Report
What is the forecast value of the South America wheat market by 2031?
It is anticipated to reach USD 18.60 billion, reflecting a 4.54% CAGR between 2026 and 2031.
Which country leads South American wheat exports today?
Argentina shipped 10.2 million metric tons in 2025, or 82.4% of regional exports.
Why is Paraguay gaining market share in Brazilian imports?
Upgraded river logistics cut freight by USD 28 per metric ton and deliver wheat five days faster than Argentine truck routes.
How are carbon credits affecting wheat farming economics?
Regenerative practices generated USD 14 to 22 per hectare in extra income during 2025, lowering break-even prices on marginal land.
Which new cultivar shows promise against wheat blast?
Embrapa’s BRS 420 averages 6.8 metric tons per hectare and improves disease resistance, with seed scale-up planned for 2026.