
Market Overview
| Study Period | 2021 - 2031 |
|---|---|
| Forecast Data Period | 2026 - 2031 |
| Historical Data Period | 2021 - 2024 |
| Market Size (2026) | USD 22.04 Billion |
| Market Size (2031) | USD 31.04 Billion |
| Growth Rate (2026 - 2031) | 7.09 % |
| Market Concentration | Medium |
Major Players *Disclaimer: Major Players sorted in no particular order Image © Mordor Intelligence. Reuse requires attribution under CC BY 4.0. | |
South America Vegetable Oil Market Analysis by Mordor Intelligence
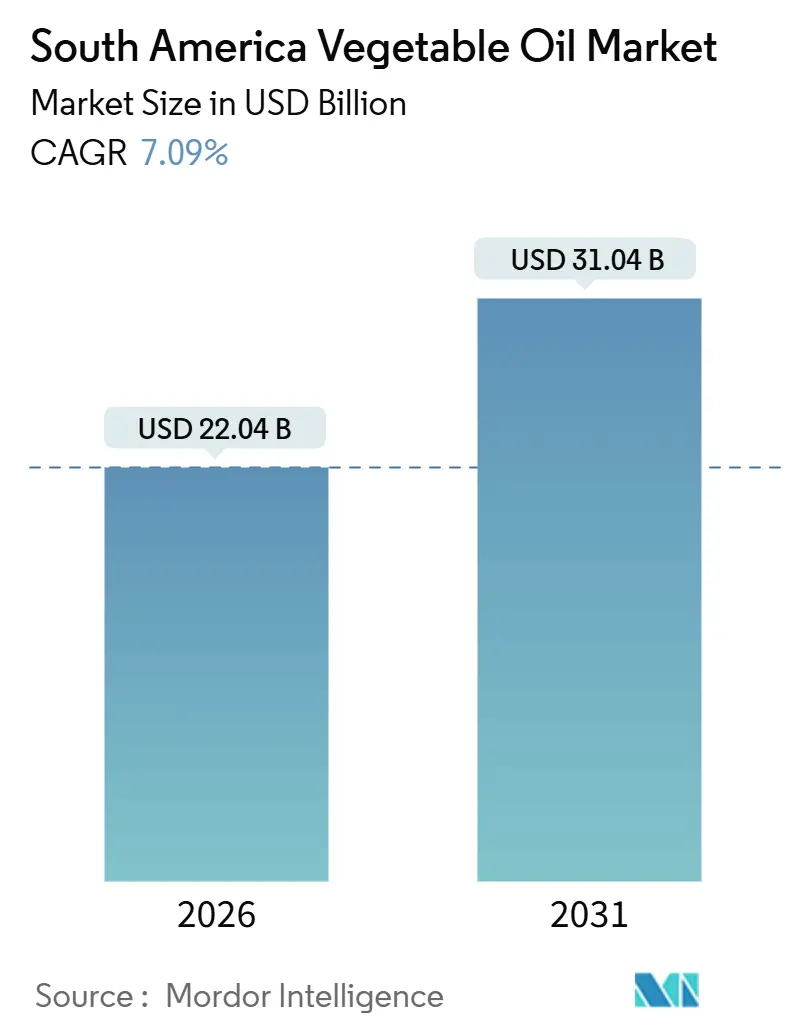
The South America vegetable oil market size is estimated at USD 22.04 billion in 2026, and is expected to reach USD 31.04 billion by 2031, at a CAGR of 7.09% during the forecast period (2026-2031). This trajectory reflects the region's dual role as a dominant global oilseed supplier and a rapidly maturing consumer base that prioritizes health-conscious cooking alternatives. Brazil's decision to elevate its biodiesel mandate from B14 to B15 in 2025 illustrates how policy levers directly convert agricultural surplus into industrial feedstock, tightening the link between crop yields and energy security [1]. Meanwhile, Argentina's export-tax reduction from 31% to 24.5% for soybean meal and oil has unlocked crush capacity that had been idled by fiscal disincentives, signaling a strategic pivot toward value-added processing over raw-bean shipments[2]. Retailers across Brazil, Chile, and Peru are now positioning fortified oils alongside plant-based proteins, blending health claims with convenience to expand household penetration. Extraction technologies such as enzyme-assisted pressing and membrane filtration are lifting oil recovery rates by up to three percentage points, giving early adopters a cost edge.
Key Report Takeaways
- By type, soybean oil led with 42.31% of the South America vegetable oil market share in 2025, whereas palm oil is forecast to grow at a 7.65% CAGR through 2031.
- By nature, conventional variants dominated with 93.52% revenue in 2025, while organic oils are advancing at an 8.44% CAGR to 2031.
- By end-use segment, the food-processing segment absorbed 43.12% of volume in 2025; industrial and biofuel uses are expanding at a 7.91% CAGR to 2031.
- By geography, Brazil accounted for 54.05% of 2025 revenue, and Argentina is poised to record the fastest 9.56% CAGR through 2031.
Note: Market size and forecast figures in this report are generated using Mordor Intelligence’s proprietary estimation framework, updated with the latest available data and insights as of January 2026.
Market Trends and Insights
Drivers Impact Analysis of South America Vegetable Oil Market*
| Driver | (~) % Impact on CAGR Forecast | Geographic Relevance | Impact Timeline |
|---|---|---|---|
| Rising demand for healthier cooking alternatives with unsaturated fats | +1.2% | Brazil, Argentina, Chile, and urban centers across South America | Medium term (2-4 years) |
| Growing consumer awareness of nutritional benefits including omega-3 and vitamin E | +0.9% | Brazil, Colombia, Argentina, with spillover to Peru and Chile | Medium term (2-4 years) |
| Expansion of food processing and packaged food industries | +1.5% | Brazil (dominant), Argentina, Colombia | Long term (≥ 4 years) |
| Technological improvements in extraction and refining processes | +0.8% | Brazil, Argentina (crushing hubs), Colombia (palm processing) | Long term (≥ 4 years) |
| Regulatory support for trans-fat reductions boosting demand for alternatives | +1.1% | Pan-regional (Brazil, Argentina, Peru, Paraguay, Uruguay, Chile, Colombia, Ecuador) | Short term (≤ 2 years) |
| Rising demand for organic and non-GMO oils | +0.7% | Brazil, Argentina (export-driven), Chile (domestic premium segment) | Medium term (2-4 years) |
| Source: Mordor Intelligence | |||
Rising Demand for Healthier Cooking Alternatives
Urban households in São Paulo, Buenos Aires, and Santiago are substituting saturated-fat sources with soybean, sunflower, and canola oils that deliver higher unsaturated-fat profiles. Brazil's Ministry of Health reported a 12% decline in trans-fat intake between 2020 and 2024, correlating with a significant volume increase in refined soybean oil sales through modern retail channels[3]. This shift is amplified by private-label offerings in hypermarkets that price heart-healthy blends competitively against traditional lard and palm-based shortenings. Retailers are also introducing fortified oils with added omega-3 and vitamin D, targeting middle-income consumers who previously lacked access to functional foods. The trend extends beyond retail; foodservice operators in Brazil and Argentina are reformulating menus to comply with front-of-pack warning labels that flag high saturated-fat content, indirectly boosting demand for liquid vegetable oils in commercial kitchens.
Growing Consumer Awareness of Nutritional Benefits
Pan American Health Organization campaigns across South America have spotlighted omega-3 fatty acids and vitamin E as preventive nutrients for cardiovascular disease, prompting a year-on-year increase in canola and sunflower oil imports into Chile and Peru during 2024, according to the Pan American Health Organization. Social-media influencers and government-backed nutrition programs are disseminating messages that link polyunsaturated fats to reduced inflammation and improved cognitive function, creating a halo effect for premium-priced oils. Argentina's National Institute of Food Technology published guidelines in 2024 recommending daily intake thresholds for omega-6 and omega-3 ratios, which food processors are now printing on labels to differentiate products according to the National Institute of Food Technology. This awareness is not confined to affluent segments; even rural cooperatives in Brazil are marketing cold-pressed oils with nutritional claims, leveraging local trust networks to penetrate underserved markets.
Expansion of Food Processing and Packaged Food Industries
Brazil's food-processing sector generated significant revenue during 2024, expanding year-on-year as manufacturers scaled production of ready-to-eat meals, bakery goods, and dairy alternatives that require substantial vegetable-oil inputs. Snack manufacturers in Argentina and Colombia are reformulating recipes to replace palm oil with sunflower or soybean oil in response to European Union deforestation regulations that threaten market access for non-certified palm derivatives. The rise of plant-based protein analogs, such as soy burgers and chickpea patties, has created a parallel demand stream for emulsifying agents derived from refined oils. Confectionery producers are also adopting fractionated palm oil and interesterified blends to achieve desired melt profiles without hydrogenation, a shift that requires tighter collaboration between oilseed crushers and ingredient formulators.
Technological Improvements in Extraction and Refining Processes
Enzyme-assisted aqueous extraction and supercritical CO₂ methods are gaining traction in Brazil and Argentina, enabling processors to achieve 95% oil recovery from soybeans versus 92% with conventional hexane solvent systems. Membrane filtration technologies introduced in 2024 allow continuous removal of phospholipids and free fatty acids without chemical degumming, reducing wastewater by 40% and cutting refining costs by 8-12%. Cargill's 2024 biodiesel-facility upgrade in Brazil incorporated enzymatic transesterification, which operates at lower temperatures and yields higher-purity glycerol as a co-product for pharmaceutical applications. Cold-press equipment with nitrogen blanketing is being deployed by organic-certified mills in Argentina to preserve tocopherol content and extend shelf life, addressing export-market demands for minimally processed oils. These innovations compress payback periods for capital investments, making automation economically viable even for mid-sized cooperatives.
Restraints Impact Analysis of South America Vegetable Oil Market*
| Restraint | (~) % Impact on CAGR Forecast | Geographic Relevance | Impact Timeline |
|---|---|---|---|
| Fluctuations in raw material crop yields due to weather and climate variability | -1.3% | Argentina, southern Brazil, Paraguay (drought-prone), northern Brazil (excess rainfall) | Short term (≤ 2 years) |
| Competition from alternative lipid sources including animal fats and synthetic oils | -0.6% | Brazil, Argentina (beef-tallow availability), Chile (emerging precision fermentation) | Medium term (2-4 years) |
| Stringent food safety and labeling regulations | -0.5% | Pan-regional, with stricter enforcement in Chile, Peru, Uruguay | Short term (≤ 2 years) |
| Adverse impacts of pests and diseases on oilseed crops | -0.9% | Brazil (Asian soybean rust epicenter), Argentina (corn-stunt spillover to rotations) | Short term (≤ 2 years) |
| Source: Mordor Intelligence | |||
Fluctuations in Raw Material Crop Yields Due to Weather and Climate Variability
La Niña episodes in 2024 and early 2025 reduced soil moisture across Argentina and southern Brazil, cutting Argentine soybean output to 48.5 million metric tons versus a potential 52 million metric tons under neutral conditions, according to the USDA Foreign Agricultural Service. Conversely, northern Brazil experienced above-average rainfall that delayed planting and increased fungal pressure, compressing harvest windows and elevating drying costs. El Niño transitions create opposite risks: excessive heat in Argentina can abort pod formation, while flooding in Rio Grande do Sul disrupts logistics and spoils stored beans. These swings translate directly into crush margins; when bean prices spike, processors either curtail runs or pass costs to buyers, dampening demand from price-sensitive foodservice operators. Climate modeling suggests La Niña frequency may increase through 2030, necessitating investments in drought-tolerant soybean varieties and precision irrigation, capital outlays that smaller farms struggle to finance.
Competition from Alternative Lipid Sources
Beef tallow from Brazil's and Argentina's cattle industries offers a lower-cost feedstock for biodiesel blending, capturing a significant portion of industrial fat demand in 2024 and exerting downward pressure on vegetable-oil prices, according to the USDA Foreign Agricultural Service. Precision-fermentation startups in Chile and Brazil are piloting microbial oils that replicate palm-oil fatty-acid profiles without land-use concerns, attracting venture funding. While these alternatives remain subscale, their presence in ingredient catalogs signals to buyers that vegetable oils must compete on sustainability credentials and price stability. Animal-fat availability fluctuates with livestock cycles, but during periods of high cattle slaughter, tallow floods biodiesel auctions and undercuts soybean-oil bids. Synthetic-biology platforms are also targeting omega-3 production via algae fermentation, potentially displacing fish oil and canola oil in nutraceutical applications by 2028.
*Our forecasts treat driver/restraint impacts as directional, not additive. The impact forecasts reflect baseline growth, mix effects, and variable interactions.
South America Vegetable Oil Market Segment Analysis
By Type:
Soybean Dominance Anchors Crush EconomicsSoybean oil held 42.31% of market share in 2025, underpinned by Brazil's and Argentina's combined 227 million metric tons of bean production and entrenched crushing infrastructure that processes meal for export alongside oil for domestic biodiesel. Palm oil, despite a smaller base, is forecast to grow at a 7.65% CAGR through 2031, driven by Colombia's 1.88 million metric tons of sustainable-certified output and Agropalma's expansion across 45,000 hectares in Brazil's Pará state. Rapeseed oil remains a niche play, concentrated in Chile and southern Argentina, where cooler climates favor canola cultivation; volumes are modest but command premiums in health-food channels due to favorable omega-3 profiles. Sunflower oil production in Argentina reached approximately 4 million metric tons in 2024, serving both domestic frying applications and European export markets that prize its light flavor and high smoke point.
Peanut oil occupies a specialty segment in confectionery and gourmet cooking, with limited acreage in Argentina and Brazil constraining supply growth. Coconut oil is almost entirely imported from Asia, used primarily in personal-care formulations and premium bakery fats. Olive oil production is emerging in Argentina's Mendoza and La Rioja provinces, targeting export markets in North America and Europe, where South American origin commands curiosity value; however, volumes remain below 30,000 metric tons annually and face quality-consistency challenges. The "Other Types" category captures minor oils, cottonseed, sesame, flaxseed that serve artisanal and organic niches. Enzyme-assisted extraction technologies introduced in 2025 are improving recovery rates for soybean and sunflower oils by 3 percentage points, directly enhancing crush margins and incentivizing capacity expansions.


By Nature:
Conventional Scale Meets Organic PremiumsConventional oils commanded 93.52% of the market in 2025, reflecting the dominance of large-scale monoculture systems optimized for herbicide-tolerant soybean and hybrid sunflower varieties. Organic oils, though marginal at present, are accelerating at 8.44% CAGR through 2031, propelled by the USDA's 2024 organic-equivalency agreement with Brazil that halved certification timelines and unlocked North American retail channels. Argentine producers are converting 15,000-20,000 hectares annually to organic protocols, motivated by 40-50% price premiums and long-term contracts with
European buyers prioritize non-GMO sourcing. Organic acreage faces agronomic headwinds, yields trail conventional by 20-30%, pest pressure intensifies without synthetic insecticides, and weed management relies on mechanical cultivation that raises labor costs. Intercropping legumes and cover crops can restore soil nitrogen, but extension services to train farmers in these practices remain underfunded in rural Brazil and Paraguay. Retailers in Chile and Colombia are dedicating premium shelf space to organic cooking oils, often co-merchandised with plant-based proteins to reinforce health positioning and capture millennial spending.

By End-User:
Food Processing Leads, Biofuel SurgesThe food processing industry absorbed 43.12% of the vegetable oil volume in 2025, driven by Brazil's food processing sector, which expanded year-on-year as manufacturers scaled up production of ready-to-eat meals, bakery goods, snacks, and dairy alternatives. Industrial and biofuel applications are climbing at 7.91% CAGR through 2031, reflecting Brazil's B15 biodiesel mandate and Argentina's export-tax reforms that restored crushing economics. Foodservice operators, restaurants, catering chains, and institutional kitchens represent a stable mid-tier segment; however, front-of-pack warning labels in Chile, Peru, and Uruguay are prompting menu reformulations that favor liquid oils over solid fats. Personal care and cosmetics applications leverage coconut, olive, and specialty oils for emollients and surfactants, a niche that grows in tandem with premium beauty brands entering South American markets.
Retail channels, supermarkets, hypermarkets, convenience stores, and online platforms distribute bottled oils directly to households, a segment that benefits from private-label penetration and promotional pricing. Within food processing, bakery and confectionery sub-segments consume oils for dough conditioning, frying, and cream fillings, while snacks and savory products require high-stability oils that withstand repeated heating cycles. Ready-to-eat and prepared foods demand emulsifying and texturizing agents derived from refined oils, and dairy and non-dairy alternatives use vegetable fats to replicate mouthfeel in plant-based cheeses and yogurts. Online retail stores are capturing incremental share as e-commerce penetration in Brazil and Argentina accelerates, offering subscription models for bulk oil purchases that appeal to cost-conscious urban households.
Geography Analysis
Brazil Vegetable Oil Market
Brazil secured 54.05% of the South America vegetable oil market in 2025, anchored by a record 175 million metric tons of soybean production in the 2025/26 season. The country's biodiesel mandate escalated from B14 to B15 in 2025, directly converting an additional 500,000 metric tons of soybean oil into renewable diesel and tightening domestic supply-demand balances. Agropalma's 45,000-hectare palm-oil estate in Pará state holds RSPO certification and supplies sustainable feedstock to European buyers, illustrating how environmental credentials unlock premium pricing. However, Asian soybean rust costs growers USD 2.8 billion per harvest cycle, and La Niña-induced drought in southern states periodically disrupts logistics, injecting volatility that favors vertically integrated players.
Argentina Vegetable Oil Market
Argentina is forecast to grow at a 9.56% CAGR through 2031, propelled by export-tax reductions from 31% to 24.5% for soybean meal and oil that restored competitiveness to crushing infrastructure and enabled the country to process 42 million metric tons annually. Aceitera General Deheza expanded crushing capacity in 2024, while Vicentin navigated financial restructuring challenges that temporarily curtailed operations. Sunflower oil production reached approximately 4 million metric tons in 2024, serving both domestic frying applications and European export markets that prize its light flavor and high smoke point. Corn stunt disease devastated the 2023 maize crop, prompting farmers to rotate into soybeans in 2024 and 2025, which temporarily boosted oilseed area but heightened monoculture risks and soil-nutrient depletion.
South America Vegetable Oil Market
Colombia, Chile, Peru, and the rest of South America collectively represent smaller shares but are pivotal for palm-oil sustainability certifications and niche organic segments. Colombia produced 1.88 million metric tons of palm oil in 2024, with Fedepalma coordinating RSPO certifications that grant access to European and North American buyers demanding deforestation-free supply chains. Chile relies on imports for most vegetable oils but is cultivating canola in southern regions and enforcing front-of-pack warning labels that penalize saturated fats, indirectly boosting demand for liquid oils. Peru's palm-oil expansion in Amazon regions has attracted sustainability scrutiny, prompting producers to pursue RSPO certification to maintain export eligibility. The EU-Mercosur trade agreement, expected to enter force in 2026, will impose deforestation-free certifications for palm and soy exports, elevating compliance costs but creating opportunities for certified producers to command premium pricing.
Regulatory Landscape
In Brazil, edible vegetable oil compliance is governed by ANVISA sanitary requirements (including RDC No. 481/2021 and IN No. 87/2021, which define identity and quality parameters for oils and fats). The Ministry of Agriculture and Livestock (MAPA) oversees vegetal product defense activities covering inspection, registration, and certification for domestic and imported vegetal products. In 2025, Brazil issued Decree No. 12.709 to update the federal framework for inspection and monitoring of products of vegetal origin, reinforcing a self-control approach by economic agents and changing how processors structure traceability, controls, and audit readiness.
Argentina regulates edible oils under the Argentine Food Code (CAA), Chapter VII, which sets product standards and quality indices (for example acidity and peroxide values) for commercialized oils. Both Brazil and Argentina also use Codex Alimentarius guidance, including CODEX STAN 210, to harmonize essential composition and quality factors. This feeds into product specifications for refiners and packers operating across South American trade corridors.
Value Chain Analysis
The value chain begins with oilseed cultivation, with soybean-led production in Brazil and Argentina and palm concentrated in Colombia. It then moves through origination and storage via cooperatives and traders, followed by crushing, refining, and blending into bottled edible oils or industrial inputs, including biodiesel feedstock. Multinational processors and traders, such as Bunge, Cargill, ADM, and Wilmar, alongside large regional groups like AMAGGI and Aceitera General Deheza, integrate origination, crushing, and logistics to secure throughput and manage basis risk. Smaller mills and organic-certified operators tend to emphasize identity preservation and differentiated quality.
Downstream, distribution splits between bulk supply to food processors and foodservice, and packaged retail channels across supermarkets, convenience, and e-commerce. Logistics is a recurring swing factor in South America, since drought-linked low water levels on river systems and Amazon corridor disruptions can delay beans and oil movement. For instance, the April 2025 Miritituba shipment blockage related to protests and the March 2025 truck backlogs at Porto Velho, which involved multi-day unloading waits, increased demurrage and shifted incentives toward storage, multimodal transshipment, and tighter proximity between crushing assets and export or consumption corridors.
Competitive Landscape
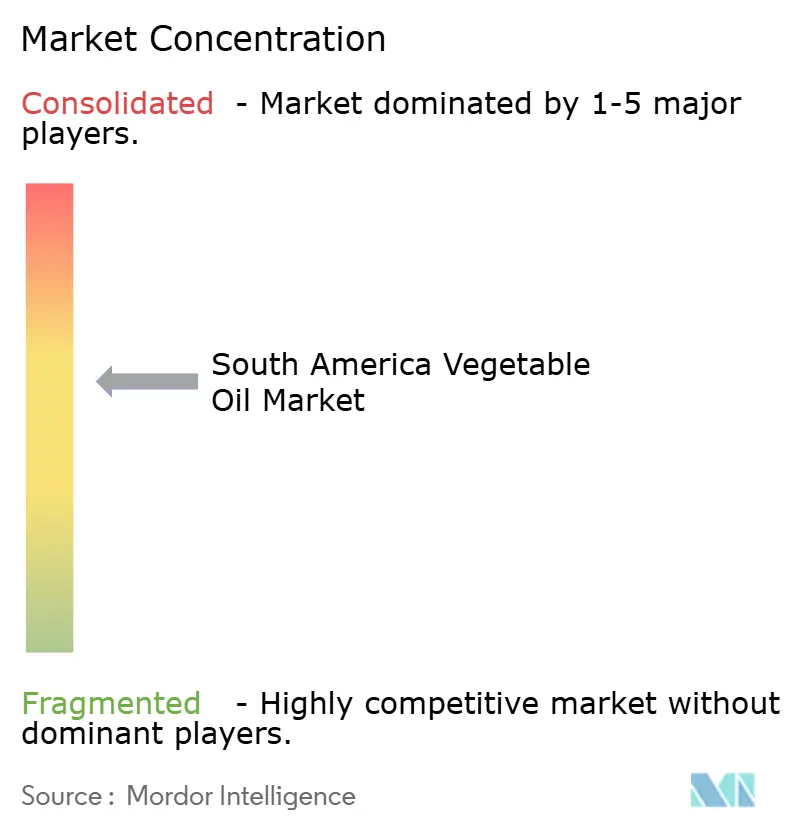
The South America vegetable oil market exhibits moderate concentration, as multinational traders such as Bunge Limited, Cargill Incorporated, ADM, and Wilmar International Limited operate crushing and refining assets alongside entrenched regional processors such as Aceitera General Deheza, Vicentin, and AMAGGI. Bunge's USD 200 million crushing-plant expansion in Mato Grosso and USD 300 million soy-processing investment in Rio Grande do Sul during 2024-2025 underscore a capital race to capture biodiesel feedstock demand before smaller rivals can scale. Cargill's USD 150 million biodiesel-facility upgrade in Brazil and ADM's USD 1.2 billion acquisition of Sojaprotein in 2024 illustrate how vertical integration, from origination through refining, compresses supply-chain costs and locks in margin stability.
Regional players leverage proximity to production zones and established farmer relationships; AGD expanded crushing capacity in Argentina in 2024, while AMAGGI invested in soybean-processing facilities and logistics infrastructure in Mato Grosso. However, Vicentin's financial restructuring challenges highlight liquidity risks for mid-sized processors operating in volatile commodity markets. Opportunities center on organic and non-GMO certifications, where the USDA's 2024 organic-equivalency agreement with Brazil halved audit timelines and unlocked North American retail channels.
Smaller cooperatives in Argentina and southern Brazil are converting acreage to organic protocols, motivated by 40-50% price premiums and long-term contracts with European buyers. Technology adoption, enzyme-assisted extraction, supercritical CO₂ refining, and membrane filtration differentiate players by lifting oil recovery rates and reducing wastewater, with early adopters capturing 8-12% cost advantages. Palm-oil producers in Colombia, including Manuelita and Diana Corporación, are pursuing RSPO certifications to access European markets that mandate deforestation-free supply chains, a compliance pathway that smaller estates struggle to finance. Precision-fermentation startups in Chile and Brazil attracted USD 45 million in venture funding during 2024, signalling emerging competition from microbial oils that replicate palm-oil fatty-acid profiles without land-use concerns.
South America Vegetable Oil Industry Leaders
-
Sime Darby Plantation Berhad
-
Cargill, Incorporated
-
Bunge Limited
-
Wilmar International Limited
-
Agropalma S/A
- *Disclaimer: Major Players sorted in no particular order
South America Vegetable Oil Market Companies Covered in this Report
- Bunge Limited
- Cargill, Incorporated
- Wilmar International Limited
- Archer Daniels Midland Company (ADM)
- Louis Dreyfus Company B.V.
- Aceitera General Deheza S.A. (AGD)
- Agropalma S/A
- Olam International
- COFCO Corporation
- CHS Inc.
- Musim Mas Group
- Sime Darby Plantation Berhad
- Alianza Team S.A.
- Manuelita
- Diana Corporación
- ASR
- Palmas del Cesar
- Vicentin
- AMAGGI Group
- SLC Agrícola
Market Opportunities and Future Outlook
Biofuels-linked demand and investment in processing capacity are expanding the outlets for soybean and other vegetable oils beyond traditional food uses. ANP data indicating soybean oil accounts for 76% of Brazil's biodiesel feedstock mix highlights an industrial pull-through, while new projects increasingly position vegetable oils for higher-value fuel applications, including SAF and HVO. In this environment, crushers and refiners that can document certified, low-carbon, and deforestation-aligned supply are competing for offtake from fuel value chains and premium export channels.
There is also room to win on multi-seed flexibility and differentiated oil offerings, supported by processing capacity and capability moves already underway. LDC started operations in January 2026 of a specialized milling line at its Timbues complex in Argentina for camelina, carinata, canola, and sunflower. In March 2026, Frisia Cooperativa Agroindustrial agreed to acquire LDC's soybean crushing plant in Ponta Grossa, Brazil, signaling renewed emphasis on processing assets and higher utilization. These steps complement ongoing adoption of higher-efficiency extraction and refining approaches, including membrane filtration and enzymatic processing, which opens space for suppliers to propose improved yield economics, cleaner-label positioning, and tailored fatty-acid profiles for food processing, retail blends, and industrial customers.
Recent Industry Developments in South America Vegetable Oil Market
- July 2026: Bunge signed a five-year agreement to supply 300,000 metric tons per year of certified soybean oil to Acelen Renewables for its Bahia biorefinery. The deal ties South American crushing output more directly to SAF and HVO supply chains and increases the value of certification and traceability for soybean oil volumes.
- May 2026: Cargill disclosed plans to double capacity at its biodiesel plant in Porto Nacional, Tocantins. The move strengthens integrated demand for vegetable oil feedstocks inside Brazil and supports higher utilization for upstream crushing and refining networks serving fuel and food markets.
- February 2026: Cargill announced a BRL 60 million investment to modernize its soybean crushing facility in Ponta Grossa, Parana. Upgrades at an established crushing site improve throughput and operating efficiency, reinforcing the role of in-region processing capacity in meeting both domestic consumption and industrial offtake needs.
South America Vegetable Oil Market Report Scope and Research Methodology
Market Definition and Coverage
For this methodology, the South America vegetable oil market is measured as the value of vegetable oils sold for edible and non-edible uses across South American countries, counted at the point of commercial sale within the region.
Scope exclusions: We exclude animal and marine fats, as well as non-oilseed inputs that do not result in a vegetable oil product.
Segments Covered in This Report
- By Type
- Palm Oil
- Soybean Oil
- Rapeseed Oil
- Sunflower Oil
- Peanut Oil
- Coconut Oil
- Olive Oil
- Other Types
- By Nature
- Conventional
- Organic
- By End-Use Segment
- Foodservice
- Industrial and Biofuel
- Personal Care and Cosmetics
- Animal Nutrition
- Food Processing Industry
- Bakery and Confectionery
- Snacks and Savory Products
- Ready-to-Eat and Prepared Foods
- Dairy and Non-Dairy Products
- Others
- Retail
- Supermarkets/Hypermarkets
- Convenience/Grocery Stores
- Online Retail Stores
- Other Distribution Channels
- Geography
- Brazil
- Argentina
- Colombia
- Chile
- Peru
- Rest of South America
Data Sources, Market Sizing, and Validation
Desk Research
Desk research was used to frame the supply and demand context and to set guardrails around the model inputs before the market math was built. We relied on public agriculture and trade statistics to understand edible oil availability, country trade dependence, and how fast key oils move in and out of South America.
Examples of the sources we referred to include FAO statistics and commodity outlooks, USDA ERS and USDA FAS oilseeds and oils datasets, UN Comtrade trade tables, national statistics offices and central bank price series for major countries, and customs and port releases where published. We also reviewed company annual reports, investor presentations, and credible industry news to sense-check capacity additions, crush trends, and pricing behavior. Where needed, a paid database subscription was used for company financials and news screening, and another subscription was used for shipment-level import and export checks. These desk research sources are illustrative and not exhaustive, and many other references were used for data collection, validation, and clarification.
Primary Interviews and Surveys
We interview processors, refiners, distributors, foodservice buyers, and biofuel users in South American markets. Respondents help clarify domestic sales that are not visible in trade data, local price differences between crude and refined oils, channel volumes, and the assumptions used to reconcile country estimates.
Distribution of primary research fieldwork respondents
| Company type | Respondent position |
|---|---|
| Top tier: 30% | CXOs: 20% |
| Mid tier: 50% | Functional/Unit leaders: 30% |
| Smaller Players: 20% | Managers: 50% |
Market-Sizing & Forecasting
Market sizing started with a top-down reconstruction of regional vegetable oil demand using production, crush and refining indicators, import and export flows, and country-level consumption proxies. That quantity total was then translated into value using observed price bands by oil type.
Once the total was created, we corroborated it with selective bottom-up approximations based on sampled volume movements and typical average selling prices by oil type and channel, then adjusted where the two views did not align. Key inputs used in the model include vegetable oil production and consumption series, net trade by major oil categories, the mix shift between soybean, palm, sunflower, rapeseed, and olive oils, and the split between food processing, foodservice, household use, and industrial and biofuel-linked demand. Pricing was handled by anchoring to regional market price signals and then applying oil-type spreads (especially for premium oils) so the value outcome stayed consistent with what buyers and sellers reported.
For forecasting, scenario analysis was used around a central case because feedstock availability, biofuel policy pull, and exchange rate movements can change outcomes quickly. Where bottom-up checks had missing coverage for smaller channels, we filled gaps using calibrated ratios from comparable countries and then re-tested the totals with interview feedback.
Data Validation & Update Cycle
Outputs were checked through a simple triangulation routine so the final number did not depend on one dataset or one assumption. Analysts compare the value trend with independent signals such as oilseed crush direction, net trade shifts, and visible price movements, and then investigate any year that breaks the expected pattern.
Before sign-off, the model is reviewed in steps, with a second analyst rechecking formulas, units, and currency conversions, followed by targeted re-contact when a key assumption shows high variance. Reports are refreshed annually, and interim updates are made when material events occur, such as policy changes affecting biofuel demand or major supply disruptions. Right before delivery, a last pass is completed to ensure the latest public releases are reflected.
Mordor Intelligence's South America Vegetable Oil Market Size Versus Other Published Estimates
Published market values for South America vegetable oil often do not match because publishers pick different country coverage, product inclusions, and pricing rules, and then they do not always align the base year and conversion timing. Differences also show up when one estimate mixes edible oils with wider fats categories, or when industrial and biofuel-linked demand is treated as an add-on instead of being modeled consistently.
The biggest gap driver is scope mixing between vegetable oils and wider edible oils and fats baskets, where Mordor Intelligence keeps the count to vegetable oils and then applies oil-type pricing spreads and end-use splits that are checked against regional production and net trade signals.
Benchmark comparison
| Source | Market Size | Gaps in Research Methodology |
|---|---|---|
| Mordor Intelligence | USD 22.04 B (2026) | |
| Industry Publisher A | USD 5.25 B (2023) | This figure is for edible oils and fats in South and Central America, which can be narrower in geography and can include category definitions that do not match a vegetable-oils-only scope, thereby lowering the comparable total. |
| Regional Publisher B | USD 15.58 B (2025) | This estimate uses a Latin America scope and a different base year, and the value can shift depending on whether premium oils and industrial uses are priced and included the same way as mainstream edible oils. |
Overall, the spread is explained mainly by what is counted as vegetable oil, which countries are included, and how prices are normalized across oil types and years. By keeping the model tied to observable production and trade movements, and then validating splits and pricing with field feedback, the final total stays traceable to inputs that can be rechecked and updated in a repeatable way.
Key Questions Answered in the Report
How large is the South America Vegetable Oil market today?
The South America vegetable oil market size is estimated at USD 22.04 billion in 2026 and is projected to reach USD 31.04 billion by 2031.
What is the growth outlook through 2031?
The market is forecast to expand at a 7.09% CAGR between 2026 and 2031, led by policy-driven biofuel demand and shifting dietary preferences.
Which country contributes the most revenue?
Brazil generated 54.05% of regional value in 2025, supported by record soybean output and a nationwide B15 biodiesel mandate.