
Market Overview
| Study Period | 2021 - 2031 |
|---|---|
| Forecast Data Period | 2026 - 2031 |
| Base Year Market Size (2025) | USD 1.53 Billion |
| Market Size (2026) | USD 1.56 Billion |
| Market Size (2031) | USD 1.74 Billion |
| Growth Rate (2026 - 2031) | 2.18 % |
| Market Concentration | Medium |
Major Players *Disclaimer: Major Players sorted in no particular order Image © Mordor Intelligence. Reuse requires attribution under CC BY 4.0. | |
South America Soup Market Analysis by Mordor Intelligence
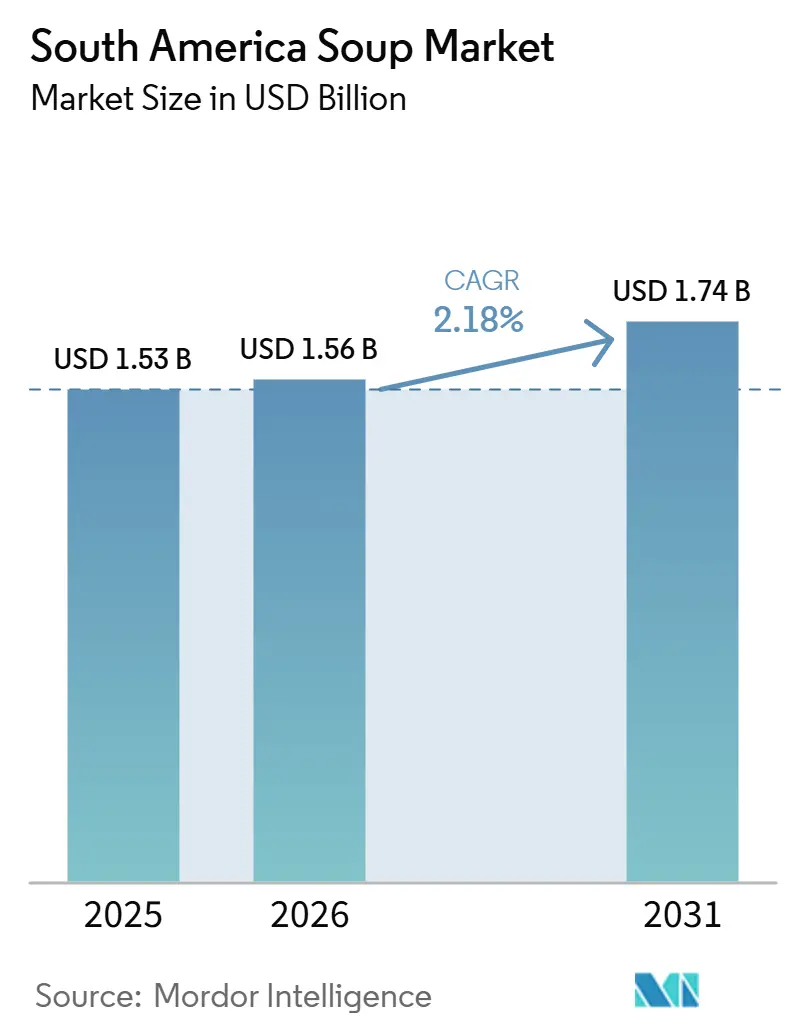
The South America soup market size is expected to grow from USD 1.53 billion in 2025 to USD 1.56 billion in 2026 and is forecast to reach USD 1.74 billion by 2031 at 2.18% CAGR over 2026-2031. Improved cold-chain logistics, rapid urbanization, and a preference for single-serve meal formats are supporting steady category gains even as front-of-pack sodium warnings moderate volume growth. At the same time, chilled soup sales are accelerating as retailers dedicate more refrigerated space to premium low-preservative recipes, while shelf-stable broth faces scrutiny under sodium regulations in Argentina, Brazil, Chile, and Peru. Multinationals and regional specialists are refining flavor profiles, packaging, and distribution tactics to protect share, yet cost pressures linked to grain and meat inflation are squeezing margins. Manufacturers that pair localized flavors, such as Argentine locro, Chilean cazuela, Colombian ajiaco, and Peruvian chupe, with clean-label formulations and aseptic packaging stand to capture disproportionate growth as the region's 76% of workers who bring meals to the office seek convenient, culturally resonant options that align with wellness goals.
Key Report Takeaways
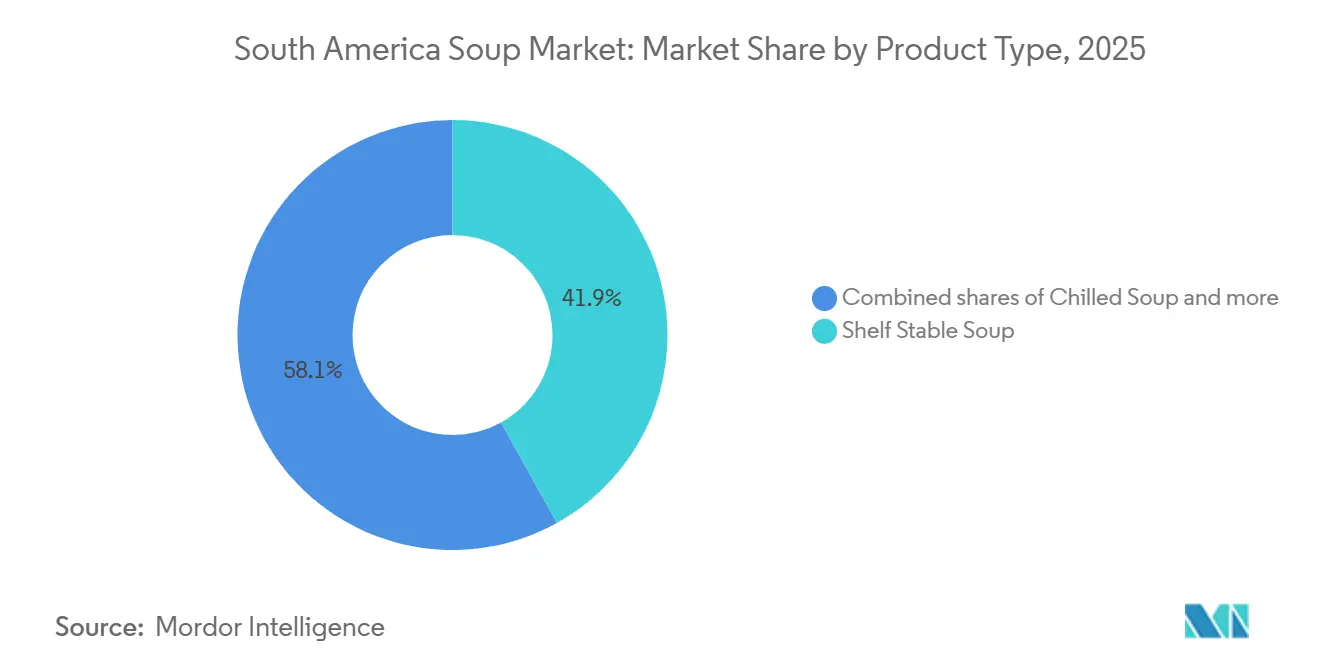
- By product type, shelf-stable formats led with 41.92% revenue share in 2025, while chilled soup is projected to post a 2.85% CAGR to 2031.
- By diet type, vegetarian recipes accounted for 53.81% of the soup market share in 2025 and will expand at a 2.55% CAGR through 2031.
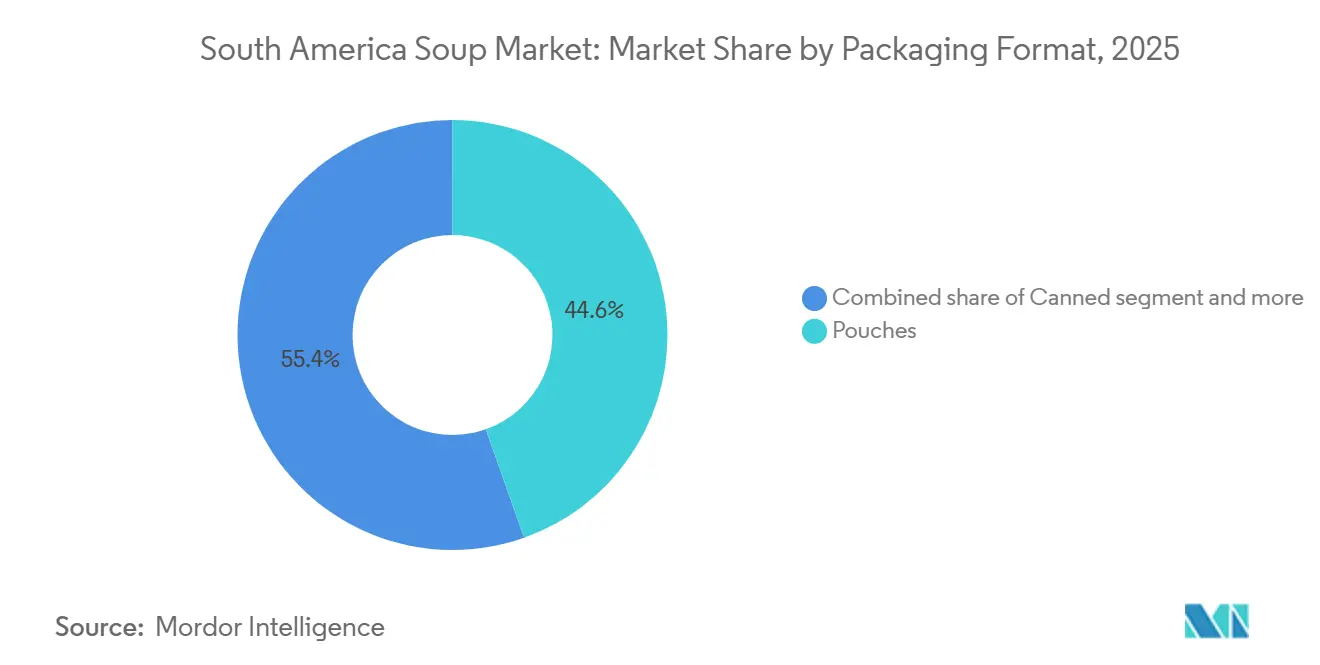
- By packaging, pouches held 44.59% of 2025 sales, whereas canned soup is slated for a 2.68% CAGR after the adoption of lighter steel and BPA-free linings.
- By distribution channel, supermarkets and hypermarkets controlled 50.73% of revenue in 2025; online grocery is forecast for a 3.12% CAGR to 2031.
- By geography, Brazil generated 9.36% of 2025 turnover and will record the fastest 3.95% CAGR, supported by a BRL 6 billion manufacturing expansion by Nestlé during 2023-2025.
Note: Market size and forecast figures in this report are generated using Mordor Intelligence’s proprietary estimation framework, updated with the latest available data and insights as of 2026.
Market Trends and Insights
Drivers Impact Analysis of South America Soup Market*
| Driver | (~) % Impact on CAGR Forecast | Geographic Relevance | Impact Timeline |
|---|---|---|---|
| Urbanization and hectic lifestyles boost demand for ready-to-eat soups | +0.6% | Brazil, Colombia, Chile, urban centers São Paulo, Bogotá, Santiago | Short term (≤ 2 years) |
| Heightened health awareness propels the consumption of nutritious soups | +0.5% | Brazil, Argentina, Chile, FOPL-regulated markets | Medium term (2-4 years) |
| Growing enthusiasm for plant-based and vegetarian soups | +0.4% | Brazil, Argentina, Chile, metropolitan areas | Medium term (2-4 years) |
| Innovative packaging and formats enhance market allure | +0.3% | Brazil, Argentina, and modern retail hubs | Medium term (2-4 years) |
| Localized flavors cater to regional taste preferences | +0.2% | Argentina, Chile, Colombia, Peru, and regional strongholds | Long term (≥ 4 years) |
| Rise of modern retail and supermarkets broadens soup availability | +0.4% | Peru, Colombia, Brazil, expanding retail footprint | Short term (≤ 2 years) |
| Source: Mordor Intelligence | |||
Urbanization And Hectic Lifestyles Boost Demand For Ready-To-Eat Soups
Rapid urbanization across South America is compressing meal-preparation windows, and ready-meal orders on iFood surged 28.5% in the first half of 2025, from 23 million to 29.5 million, while stores specializing in marmitas jumped 41.4% to 10,435 outlets. That acceleration reflects a structural shift: the majority of the Brazilian workers now bring meals to the office, primarily to save money and eat healthier, yet time constraints push many toward shelf-stable or chilled soup pouches that require minimal heating. In Colombia, packaged-food retail is projected to climb from USD 13.7 billion in 2023 to USD 18.7 billion by 2028, driven by discounters such as D1 and ARA embedding e-commerce fulfillment into their expansion strategies[1]. Urban households in São Paulo, Bogotá, and Santiago are adopting hybrid shopping patterns, bulk purchases at hypermarkets supplemented by on-demand delivery for perishables, and soup brands that offer single-serve pouches or microwaveable bowls capture impulse purchases during evening commutes. This driver contributes an estimated 0.6 percentage points to the 2025-2030 CAGR, with peak impact in the next two years as metro-area penetration deepens.
Heightened Health Awareness Propels Consumption of Nutritious Soups
Front-of-pack labeling regulations in Brazil (RDC 429/2020), Argentina (Law 27,642), Chile (Law 20,606), and Peru (Law 30021) now mandate octagonal warnings for excess sodium, saturated fat, and sugar, and a Pan American Health Organization study found that soups carry a median sodium density of 6.0 mg per kilocalorie, 67% meet PAHO's mg/kcal target, yet only 31% to 54% comply with the mg per 100 g threshold [2]. In Argentina, ANMAT provisions 11362/2024 and 11378/2024 revealed that 11.2% of soup products exceed national sodium limits, with instant soup non-compliance at 10%, forcing brands to reformulate or risk delisting from health-focused retail chains[3]. Manufacturers are responding by launching preservative-free lines, Verdureira's 100% natural soups, ready in 3 minutes, boosted the company's winter sales by 13% in June 2024, and by fortifying broths with legume proteins and Andean grains such as quinoa to appeal to wellness-focused millennials. This driver adds approximately 0.5 percentage points to the forecast CAGR, with medium-term impact as reformulation cycles mature.
Growing Enthusiasm for Plant-Based and Vegetarian Soups
Vegetarian soup captured 54.11% of 2024 revenue and will grow at a 2.64% CAGR through 2030, outpacing non-vegetarian variants as Latin American consumers adopt flexitarian diets for health, environmental, and cost reasons. Plant-based food sales in the region are accelerating, and younger cohorts in Chile and Brazil view meat reduction as a lifestyle statement rather than a dietary restriction, creating demand for lentil, chickpea, and black-bean soups that deliver protein without animal inputs. Ingredient suppliers are capitalizing on this shift: BENEO expanded its legume-protein plant to serve South American manufacturers seeking clean-label, high-fiber formulations, while Tate & Lyle introduced modified starches in Brazil that improve mouthfeel in vegetable-based broths without adding sodium or fat. Retailers are amplifying the trend by dedicating shelf space to "plant-forward" sections, and private-label vegetarian soups now account for a rising share of supermarket assortments because they offer 15% to 20% lower price points than branded equivalents, appealing to the 53% of Latin American consumers who resort to cheaper alternatives amid persistent inflation. This driver contributes roughly 0.4 percentage points to the CAGR, with medium-term impact as distribution widens beyond metropolitan areas.
Innovative Packaging and Formats Enhance Market Allure
Packaging innovation is reshaping shelf appeal and convenience: SIG introduced carton packs with extended shelf life for ambient soups, while active-packaging technologies, such as oxygen scavengers and antimicrobial films, extend freshness without refrigeration, addressing cold-chain gaps in rural Brazil and northern Argentina. University of Buenos Aires researchers are piloting nano-packaging that embeds silver nanoparticles into polymer films to inhibit microbial growth, a breakthrough that could enable fresh-ingredient soups to remain stable for 90 days at room temperature. Pouches held 45.09% of 2024 packaging-format revenue because they are lighter, cheaper to ship, and easier to store than cans, yet canned soup will expand at a 2.76% CAGR as manufacturers adopt lighter-weight steel and BPA-free linings to satisfy sustainability mandates and consumer health concerns. Modified-atmosphere packaging is also gaining traction for chilled soups, which will post a 2.94% product-types CAGR as retailers allocate more refrigerated space to premium, preservative-light formulations that command 30% to 40% higher margins than shelf-stable equivalents. This driver adds approximately 0.3 percentage points to the forecast CAGR, with medium-term impact as capital investments in packaging lines mature.
Restraints Impact Analysis of South America Soup Market*
| Restraint | (~) % Impact on CAGR Forecast | Geographic Relevance | Impact Timeline |
|---|---|---|---|
| Home-cooked meal preference curbs packaged soup demand | -0.3% | Argentina, Peru, rural and suburban areas | Medium term (2-4 years) |
| Health-conscious consumers shun packaged soups due to "processed food" stigma | -0.4% | Brazil, Chile, Argentina, FOPL-regulated markets | Short term (≤ 2 years) |
| Price fluctuations in raw materials pinch manufacturers' profit margins | -0.3% | Argentina, Brazil, agricultural commodity exporters | Short term (≤ 2 years) |
| Fresh-ingredient soups face shelf-life and preservation hurdles | -0.2% | Brazil, Colombia, and regions with cold-chain gaps | Long term (≥ 4 years) |
| Source: Mordor Intelligence | |||
Home-Cooked Meal Preference Curbs Packaged Soup Demand
Cultural attachment to home cooking remains strong in Argentina and Peru, where multi-generational households often prepare large batches of traditional soups such as locro and chupe on weekends, then portion them for weekday consumption. It was observed that 35% of consumers no longer view brand heritage as a key purchase driver, and only 1 in 5 CPG companies achieved 5% or higher growth in 2024, suggesting that packaged soups struggle to displace entrenched meal routines. Economic pressures amplify this restraint: 53% of Latin American consumers resort to cheaper brands or private labels, and many opt to cook from scratch using bulk vegetables and grains purchased at wet markets, which offer 30% to 40% lower prices than pre-packaged equivalents. Manufacturers counter this headwind by launching "meal-starter" kits that include pre-chopped vegetables, seasoning sachets, and broth concentrates, positioning them as time-savers rather than full replacements for home cooking.
Health-Conscious Consumers Shun Packaged Soups Due to "Processed Food"
Front-of-pack labeling regulations in Brazil, Argentina, Chile, and Peru now mandate octagonal warnings for excess sodium, and ANMAT's 2024 audit revealed that 11.2% of soup products exceed national thresholds, reinforcing consumer perceptions that packaged soups are nutritionally inferior to fresh alternatives. A PAHO study found that while 67% of soups meet the organization's mg/kcal sodium target, only 31% to 54% comply with the mg per 100 g benchmark, and instant soup non-compliance stands at 10%, prompting health-conscious shoppers to scrutinize ingredient lists and opt for fresh or minimally processed options. That skepticism is compounded by social-media campaigns highlighting ultra-processed foods' links to chronic disease, and Brazilian consumers increasingly associate canned or powdered soups with artificial additives, even when formulations have been reformulated to meet clean-label standards. Brands are responding by launching preservative-free lines, Verdureira's 100% natural soups boosted winter sales by 13% in June 2024, and by fortifying broths with functional ingredients such as turmeric and ginger to signal wellness benefits.
*Our forecasts treat driver/restraint impacts as directional, not additive. The impact forecasts reflect baseline growth, mix effects, and variable interactions.
South America Soup Market Segment Analysis
By Product Type:
Chilled Soup Gains Momentum Despite Shelf-Stable DominanceInnovative packaging technologies are accelerating chilled soup's 2.85% CAGR through 2031, even as shelf-stable soup retains 41.92% of 2025 revenue. Modified-atmosphere packaging and active films, such as oxygen scavengers, extend chilled soup's freshness to 21 days without preservatives, enabling retailers to stock premium, restaurant-quality broths that command 30% to 40% higher margins than ambient equivalents. Dry soup and frozen soup occupy narrower niches: dry soup appeals to budget-conscious rural households seeking long shelf life and minimal storage requirements, while frozen soup targets urban consumers with reliable cold-chain access and willingness to pay premiums for convenience. Seara, a JBS subsidiary, launched its Seara Protein frozen ready-meal line in August 2025, featuring soups with approximately 30 grams of protein per serving, tapping into Brazil's fitness-focused demographic that prioritizes macronutrient density over traditional comfort-food profiles.
SIG Combibloc's carton packs for ambient soups illustrate how packaging innovation can extend shelf-stable soups: the format combines lightweight portability with extended shelf life, reducing logistics costs and enabling distribution to remote areas where canned goods dominate. Dry soup remains popular in Argentina and Peru, where households stockpile non-perishable staples during economic uncertainty, yet its growth is constrained by the perception that powdered broths lack the authenticity of liquid or chilled alternatives. Frozen soup faces the steepest adoption barriers; only 40% of Brazilian households own freezers with dedicated compartments, and power outages in northern regions spoil inventory, but manufacturers are partnering with modern retailers to install point-of-sale freezers that showcase premium frozen soups alongside ice cream and ready meals, normalizing the category for middle-income shoppers.

By Category:
Vegetarian Soup Captures Majority ShareVegetarian soup's 53.81% share in 2025 and 2.55% CAGR through 2031 reflect a structural shift toward plant-based diets, driven by health, environmental, and cost considerations. BENEO's legume-protein plant expansion in South America enables manufacturers to formulate lentil, chickpea, and black-bean soups with 8 to 12 grams of protein per serving, rivaling non-vegetarian broths' nutritional profiles without animal inputs.
Non-vegetarian soup retains a loyal base among consumers who prize traditional recipes such as Argentine beef-and-vegetable locro or Chilean chicken cazuela, yet its growth is tempered by front-of-pack warnings on saturated fat and sodium. ANMAT's 2024 audit found that 11.2% of soup products exceed national sodium limits, and meat-based broths are disproportionately flagged. Ingredient innovation is also blurring category boundaries: Tate & Lyle's modified starches improve mouthfeel in vegetable broths, replicating the richness of meat-based stocks without adding sodium or fat, and manufacturers are fortifying vegetarian soups with Andean grains such as quinoa to appeal to wellness-focused millennials.
By Packaging Format:
Pouches Lead, Canned Soup ReboundsPouches commanded 44.59% of 2025 packaging-format revenue because they are lighter, cheaper to ship, and easier to store than cans, yet canned soup will expand at 2.68% CAGR through 2031 as manufacturers adopt lighter-weight steel and BPA-free linings to address sustainability and health concerns. Cans' resurgence reflects their unmatched shelf life, 24 to 36 months, and their suitability for emergency stockpiling, a behavior that intensified during the COVID-19 pandemic and persists in inflation-prone markets such as Argentina, where households maintain 3- to 6-month inventories of non-perishable staples. Other packaging formats, including glass jars and Tetra Pak cartons, occupy niche positions: glass appeals to premium consumers who associate it with artisanal quality, while Tetra Pak's aseptic cartons enable ambient distribution of fresh-tasting soups without refrigeration, a capability that SIG Combibloc is commercializing across Brazil and Colombia.
Pouches' dominance is reinforced by their compatibility with single-serve formats, which align with urbanization trends: 76% of Brazilian workers bring meals to the office, and many prefer 300- to 400-milliliter pouches that fit into lunchboxes and require minimal heating. Canned soup's growth is concentrated in rural areas and among older consumers who trust the format's durability and are less swayed by sustainability messaging. Other formats, such as frozen soup in rigid plastic trays, remain marginal because they require dedicated freezer space and are vulnerable to cold-chain disruptions, yet Seara's August 2025 launch of its Seara Protein frozen ready-meal line signals that manufacturers see long-term potential in frozen formats as cold-chain infrastructure improves.
By Distribution Channel:
Online Retail, Fastest GrowingSupermarkets and hypermarkets held 50.73% of 2025 distribution revenue, yet online retail will clock a 3.12% CAGR through 2031 as digital grocery penetration deepens and last-mile delivery platforms expand. Kraft Heinz's January 2025 partnership with AB InBev's BEES platform targets 1 million new points of sale across Colombia, Mexico, and Peru, leveraging BEES's route-to-market capabilities to reach independent grocers and kiosks that lack direct relationships with multinational suppliers. Convenience and grocery stores occupy a middle ground, offering proximity and extended hours that appeal to time-pressed urban consumers, yet their limited shelf space constrains assortment breadth, forcing them to stock only top-selling SKUs and private-label equivalents. Other distribution channels, including foodservice, institutional catering, and direct-to-consumer subscriptions, remain nascent in South America, though Mexidona's 2024 retail-distribution expansion in Brazil demonstrates that startups can bypass traditional channels by partnering with specialty health-food stores and online marketplaces.
Supermarkets and hypermarkets are defending their dominance by launching private-label soup programs that offer 15% to 20% lower prices than branded equivalents, capturing most Latin American consumers who resort to cheaper alternatives. Convenience stores are adding 105 outlets annually in Peru and embedding quick-commerce fulfillment, enabling 30-minute delivery of ambient soups to urban households. Other channels, such as vending machines stocking cup soups in office buildings, remain experimental, yet Ajinomoto's April 2025 launch of cup-ramen in Colombia signals that manufacturers see opportunity in on-the-go formats that bypass traditional retail entirely.
Geography Analysis
Brazil Soup Market
Brazil's 9.36% share in 2025 relies on its 3.95% CAGR through 2031, the fastest among South American geographies, driven by Nestlé's BRL 6 billion (~USD 1.2 billion) investment wave between 2023 and 2025. ANVISA's RDC 429/2020 front-of-pack labeling regulation, implemented in 2023, compelled manufacturers to reformulate high-sodium soups or accept octagonal warnings, and a 12-month post-implementation analysis found that reformulation incentives are driving innovation in clean-label broths fortified with legume proteins and Andean grains. Verdureira's June 2024 launch of 100% natural soups, ready in 3 minutes and preservative-free, boosted the company's winter sales by 13%, illustrating how local startups are capturing market share from multinational incumbents by aligning with wellness trends. Brazil's ready-meal market is growing approximately 15% annually, and 76% of workers bring meals to the office, creating sustained demand for single-serve soup pouches that fit into lunchboxes and require minimal heating.
Argentina and Andean South America Soup Market
Argentina, Colombia, Chile, and Peru each face distinct dynamics. Argentina's wheat and maize prices spiked 210% to 230% year-on-year in 2024, driven by drought and export restrictions, compressing manufacturers' margins and forcing price hikes that alienate cost-sensitive consumers; ANMAT provisions 11362/2024 and 11378/2024 revealed that 11.2% of soup products exceed national sodium thresholds, prompting retailers to delist non-compliant SKUs. Chile's Law 20,606 mandates front-of-pack warnings, and a PAHO study found that only 31% to 54% of soups meet the mg per 100 g sodium benchmark, driving reformulation and premiumization. Peru's modern retail channel grew in the first half of 2025, and U.S. soups and broths became the leading import supplier in 2024, suggesting that premium, low-sodium imports are capturing wallet share from domestic offerings.
South America and the Caribbean Soup Market
Rest of South America, encompassing smaller markets such as Uruguay, Paraguay, and the Guianas, lags in infrastructure and purchasing power, yet it offers niche opportunities for ambient soups with extended shelf life. Manufacturers targeting these geographies prioritize dry soup and canned formats over chilled or frozen variants, reflecting intermittent electricity and limited cold-chain access. Quala's presence in Ecuador, Venezuela, and the Dominican Republic demonstrates that regional players can profitably serve secondary markets by tailoring product portfolios to local tastes and price sensitivities. Localized flavors, such as Ecuadorian locro de papa or Venezuelan sancocho, resonate with consumers who prize authenticity, and manufacturers that source indigenous ingredients from contract farms secure cost advantages over importers reliant on spot markets.
Regulatory Landscape
Packaged soups sold across South America fall under national sanitary surveillance systems that cover product registration or notification, labeling, and permitted ingredients. Key agencies include ANVISA (Brazil), SENASA (Argentina), INVIMA (Colombia), and SENASAG (Bolivia). A central compliance driver for soups is front-of-pack nutrition disclosure and sodium management, consistent with the report's focus on octagonal warnings and reformulation pressure in Brazil, Argentina, Chile, and Peru.
Within Mercosur, Technical Subgroup SGT No. 3 supports harmonization of packaged-food labeling and nutrition-table presentation. In Brazil, ANVISA continued to update the compliance perimeter in 2025, including Instrução Normativa IN No. 368 (June 2025) affecting categories subject to registration or notification, and changes to conditions of use for food additives and processing aids (December 2025). This reinforces the need for country-specific checks even when regional labeling formats converge.
Competitive Landscape
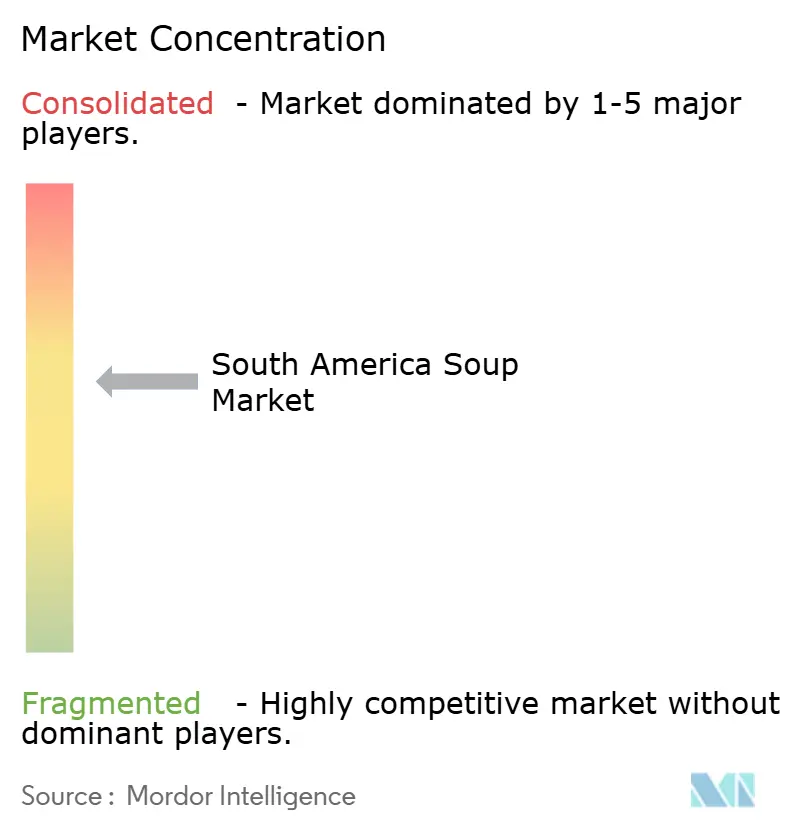
The South America soup market scores moderate concentration, reflecting fragmentation across multinational giants, regional specialists, and local startups. Campbell, Nestlé, Unilever, Kraft Heinz, and General Mills command the largest shares through extensive distribution networks and brand heritage, yet they face mounting pressure from agile entrants such as Quala, which posted a surge in operating profit during 2024, and Brazilian startups Mexidona and Verdureira, both of which launched preservative-free soup lines that captured health-conscious millennials.
Strategy patterns bifurcate multinationals' leverage scale to absorb raw-material volatility. Brazilian food inflation pushed beans up 3.52%, meat up 2.97%, and oils up 2.21% in September 2024, while smaller players differentiate through localized flavors, such as Argentine locro or Chilean cazuela, and premium positioning that commands 50% to 70% higher prices than mass-market offerings. Opportunities cluster around three axes: functional soups fortified with probiotics or collagen to appeal to wellness-focused consumers, single-serve frozen formats targeting urban households with reliable cold chains, and subscription models that bypass traditional retail.
Kraft Heinz's January 2025 partnership with AB InBev's BEES platform exemplifies technology-driven share gains: the alliance targets 1 million new points of sale across Colombia, Mexico, and Peru by leveraging BEES's digital route-to-market capabilities to reach independent grocers and kiosks. University of Buenos Aires researchers are piloting nano-packaging that embeds antimicrobial agents into polymer films, a breakthrough that could enable fresh-ingredient soups to remain stable for 90 days at room temperature and disrupt the shelf-stable-versus-chilled trade-off. Regulatory compliance also creates competitive moats: manufacturers that reformulate to meet ANVISA, ANMAT, and ISP sodium thresholds secure shelf space in health-focused retail chains, while non-compliant brands face delisting. ANMAT's 2024 audit found that 11.2% of soup products exceed national limits.
South America Soup Industry Leaders
-
Campbell Soup Company
-
Nestlé S.A.
-
Unilever PLC
-
Ajinomoto Co., Inc.
-
Nissin Foods Holdings Co., Ltd.
- *Disclaimer: Major Players sorted in no particular order
South America Soup Market Companies Covered in this Report
- Campbell Soup Company
- Nestlé S.A.
- Unilever PLC
- The Kraft Heinz Company
- General Mills, Inc.
- Conagra Brands, Inc.
- Baxters Food Group Ltd.
- Hain Celestial Group, Inc.
- Ajinomoto Co., Inc.
- Nissin Foods Holdings Co., Ltd.
- Premier Foods plc
- Amy’s Kitchen, Inc.
- CSC Brands, L.P.
- Quala
- Ottogi Co., Ltd.
- Hormel Foods Corporation
- Toyo Suisan Kaisha, Ltd.
- B&G Foods, Inc.
- Pacific Foods (Danone)
- BCI Foods Inc.
Market Opportunities and Future Outlook
Sodium-warning regimes and front-of-pack labeling in Brazil and Argentina are tightening the space for reformulated, lower-sodium soups, broths, and bouillons that retain convenience while reducing warning exposure. Unilever's 2026 Knorr relaunch of bouillon cubes in Brazil with a lower-sodium recipe shows how brands are renovating portfolios around this compliance and health-driven purchase filter, a shift that can extend to soup concentrates, meal bases, and single-serve formats.
Route-to-market modernization is also broadening growth lanes beyond traditional ambient soup. Kraft Heinz's partnership with AB InBev's BEES platform (January 2025) targets expanded reach into independent points of sale across Colombia and Peru, improving availability for shelf-stable soups and meal solutions in fragmented retail. In parallel, convenience-led demand is pulling soup brands toward ready-meal and hybrid offerings, consistent with Unilever's partnership approach in Brazil (Prato Fino + Knorr), which broadens usage occasions while relying on local manufacturing and distribution capabilities.
Recent Industry Developments in South America Soup Market
- June 2026: Nestle announced a BRL 7 billion investment plan in Brazil through 2028, including capacity expansion at the Garoto factory in Vila Velha. Although the effort is broader than soups, the scale of capital allocation supports local manufacturing and procurement that feed packaged-food categories such as soups, broths, and meal solutions, and it raises the bar on supply reliability and innovation cadence.
- January 2025: Kraft Heinz partnered with AB InBev's BEES platform to expand digital route-to-market coverage, targeting 1 million additional points of sale across Colombia, Mexico, and Peru. The partnership improves access for shelf-stable soups and meal formats in small retailers and kiosks, strengthening distribution advantages versus smaller brands with less developed indirect sales networks.
- March 2024: Campbell Soup Company completed its acquisition of Sovos Brands for about USD 2.33 billion, adding brands spanning soups, sauces, and frozen meals. The deal broadens Campbell's capability set in premium and convenience-led categories, and it raises the competitive benchmark for innovation and brand building that South America-focused players consider when shaping portfolios and partnerships.
South America Soup Market Report Scope and Research Methodology
Market Definition and Coverage
For this report, the market covers packaged soup sold across South America, counted in value terms at manufacturer or brand level prices, across retail and e-commerce routes. It includes common formats such as canned and pouched soups, plus chilled and frozen offerings where they are commercially sold.
Scope exclusions: Restaurant made soups and fresh, unbranded soups sold loose at delis or foodservice counters are excluded from this sizing.
Segments Covered in This Report
- Product Type
- Dry Soup
- Shelf Stable Soup
- Chilled Soup
- Frozen Soup
- Category
- Vegetarian Soup
- Non‑Vegetarian Soup
- Packaging Format
- Canned
- Pouches
- Others
- Distribution Channel
- Hypermarkets/Supermarkets
- Convenience/Grocery Stores
- Online Retail Stores
- Other Distribution Channels
- Geography
- Brazil
- Argentina
- Colombia
- Chile
- Peru
- Rest of South America
Data Sources, Market Sizing, and Validation
Desk Research
Desk research was used to set the demand context and to avoid building the model on one narrow data point. We leaned on public sources such as UN Comtrade trade statistics, national statistics agencies for consumer spending and food price indices, FAOSTAT for agriculture and input context, and national food and beverage associations for category definitions and channel notes. In addition, customs and tariff schedules were reviewed to separate soup mixes and ready soups where codes overlap in practice.
We also reviewed company filings, investor presentations, and reputable press to understand portfolio exposure, pricing actions, and distribution changes by country. Where public financial disclosure is limited, we supplemented with a paid subscription for company financials and intelligence, along with an import/export shipment-level database to check directionally for cross-border movements of packaged soups and mixes. These desk sources are illustrative only, and many other references were used for data collection, cross-checking, and clarification during the research process.
Primary Interviews and Surveys
Interviews and surveys cover soup manufacturers, distributors, retailers, foodservice specialists, and packaging or procurement experts within South America. Respondents provide checks on retail channel shares, pack prices, product mix, stock movement, and missing country data. Where responses conflict with secondary evidence, experts are re-contacted before the findings are used to adjust assumptions and triangulate the model.
Distribution of primary research fieldwork respondents
| Company type | Respondent position |
|---|---|
| Top tier: 30% | CXOs: 20% |
| Mid tier: 45% | Functional/Unit leaders: 30% |
| Smaller Players: 25% | Managers: 50% |
Market-Sizing & Forecasting
Sizing was built using a top-down approach where packaged food spending and category mix signals were used to reconstruct the soup value pool by country, and then rolled up to South America. To keep the outputs grounded, we cross-checked totals with selective bottom-up approximations, such as sampled brand and format price points multiplied by estimated unit movement, followed by channel checks with trade feedback.
Key model inputs included average retail price progression by format (canned vs pouches vs chilled/frozen), inflation and food CPI movement, urbanization and convenience food adoption, modern retail penetration, and the pace of e-commerce grocery growth. Because the category is sensitive to pricing and substitution, scenario analysis was used for forecasting, and then refined through primary feedback on likely promotion intensity, pack-size changes, and expected recovery or slowdown by country. When company or channel information was missing for smaller markets, gaps were handled by applying validated proxies from similar countries, and then re-tested against import patterns and shelf presence checks.
Data Validation & Update Cycle
Validation was done through multiple passes so the final numbers do not rely on a single assumption. Our team compared model outputs against independent signals like trade direction, observed price points, and category availability by channel, and then flagged outliers for review. Where variance was high, respondents were re-contacted to confirm whether the issue was definition related, timing related, or driven by pricing shocks.
Before sign-off, the full model is reviewed by another analyst to check arithmetic, logic, and consistency across countries and years. Reports are refreshed annually, and interim updates are done when material events occur, such as sharp currency moves, major tax changes, or notable shifts in retail pricing. Right before delivery, a final check is performed so the latest public updates are reflected in the numbers.
Mordor Intelligence's South America Soup Market Size Compared Against Other Published Estimates
Published soup market numbers for South America can differ quite a bit, even when the topic sounds identical at first glance. The gaps usually come from how each source defines soup, whether it includes adjacent convenience meals, and how prices and currencies are treated for the base year.
Ready meals that are eaten like soup but sold as complete meal kits are outside Mordor Intelligence's scope, which is one reason its 2025 value looks lower than figures that fold those products into soup. Differences also show up when one estimate uses retail shelf prices including taxes, another uses manufacturer values, or when 2024 is used as the base year and then projected forward with a higher inflation assumption than what retailers and distributors confirm in interviews.
Benchmark comparison
| Source | Market Size | Gaps in Research Methodology |
|---|---|---|
| Mordor Intelligence | USD 1.53 B (2025) | |
| Global Consultancy A | USD 3.81 B (2024) | Uses a broader basket that can blend soup with fresh and commercial foodservice uses, and it can also reflect retail values that embed taxes and higher channel markups, which lifts the total versus manufacturer-level counting. |
| Market Analytics Group B | USD 0.65 B (2024) | Covers a wider LATAM region definition but appears to size a narrower packaged subset in practice, which can undercount chilled and frozen formats and miss parts of modern retail beyond the tracked channels. |
The table shows that most of the spread is explained by what gets grouped into soup and which price layer is used to value the category. By keeping the counting rules tied to observable packs, channels, and country-level pricing checks, we can keep the estimate repeatable and easier to reconcile when new data points emerge.
Key Questions Answered in the Report
What is the current South America Soup Market size?
The South America Soup Market is projected to register a CAGR of 2.18% during the forecast period (2026-2031)
Which product type dominates the South America soup market?
Shelf-stable soup commands 41.92% of 2025 revenue, reflecting South America's infrastructure realities including intermittent electricity in peri-urban areas and limited cold-chain access.
Which packaging format is growing fastest and why?
Canned soup will expand at 2.68% CAGR through 2031, despite pouches holding 44.59% of 2025 revenue. Cans' resurgence reflects their unmatched 24- to 36-month shelf life and suitability for emergency stockpiling