| Study Period | 2017 - 2030 |
| Base Year For Estimation | 2024 |
| Forecast Data Period | 2025 - 2030 |
| Market Size (2025) | USD 8.78 Billion |
| Market Size (2030) | USD 11.94 Billion |
| CAGR (2025 - 2030) | 6.33 % |
| Market Concentration | Medium |
Major Players*Disclaimer: Major Players sorted in no particular order |

South America Seed Market Analysis
The South America Seed Market size is estimated at 8.78 billion USD in 2025, and is expected to reach 11.94 billion USD by 2030, growing at a CAGR of 6.33% during the forecast period (2025-2030).
South America has emerged as a significant player in the global seed industry, accounting for 11.1% of the global seed market in 2022. This growth is driven by its abundant natural resources and diverse climatic conditions. The region's seed industry is experiencing a notable shift toward hybrid seed varieties, with farmers increasingly adopting these advanced seeds to maximize productivity and profitability. This transition is supported by compelling performance metrics, as hybrid seeds demonstrate the ability to increase yields by 10-15% compared to traditional varieties. The region's agricultural sector is leveraging its natural advantages while embracing modern seed technology to strengthen its position in global agriculture.
The industry is witnessing significant technological advancements in seed biotechnology and development, particularly in genetic enhancement and trait development. A notable example is the March 2023 collaboration between Corteva Agriscience and Bunge to develop amino acid-enhanced soybeans, demonstrating the industry's commitment to innovation in seed technology. Companies are increasingly focusing on developing seeds with enhanced nutritional profiles and improved agronomic traits. The advancement in plant breeding techniques has enabled the development of seeds with multiple beneficial traits, including disease resistance, stress tolerance, and improved yield potential.
Protected cultivation represents an emerging trend in the South American seed market, though it currently accounts for only 0.01% of the total market as of 2022. This minimal penetration is primarily attributed to the high initial investment requirements and limited governmental support for greenhouse infrastructure development. However, the sector is witnessing gradual transformation with the introduction of new technologies and cultivation methods. Companies are developing specialized seed varieties optimized for protected cultivation environments, as evidenced by Rijk Zwaan's introduction of new disease-resistant varieties in 2023, including their clubroot-resistant cauliflower hybrid.
The industry is experiencing significant consolidation through strategic partnerships and acquisitions, aimed at strengthening research capabilities and expanding product portfolios. A significant development in this direction was BASF's acquisition of ASL, a leading melon breeding company, in January 2023, which enhanced their position in the specialty seed segment. These strategic moves are reshaping the competitive landscape and driving innovation in seed development. Companies are increasingly focusing on building comprehensive research and development capabilities while expanding their geographical presence through such strategic initiatives.
South America Seed Market Trends
Oilseeds dominate South America row crops seed market, with soybean as the major contributor, driven by high export demand from oil processing as well as food and beverage industries
- In South America, row crops dominated the acreage under cultivation, accounting for more than 95% of the cultivated area in 2022. The major row crops cultivated in the region are soybean, corn, wheat, pulses, alfalfa, and rice. In 2022, oilseeds held a major share of 44.1% in the row crops segment. Additionally, the area under row crops increased by 16.7% from 2017 to 2022 due to increased wheat, corn, and soybean acreages. Globally, South America is the largest producer of soybeans, and the area under soybeans was 61.7 million hectares, with a production of 196.8 million metric tons in 2021. The major area under soybean is due to increased export value, high global demand from oil processing industries, availability of arable land compared to other major producing countries, and higher profit margins.
- Brazil is the major country cultivating different field crops, such as corn and soybeans. It accounted for 53% of the region’s area used to cultivate row crops in 2022. The higher area under row crops is due to the increased demand from food and beverage industries and the high demand for bio-fuel generation using corn. Furthermore, corn is the major crop cultivated in the region. It accounted for 27.6% of South America’s area for row crops in 2022. There was a 34.1% increase in the cultivated area for corn from 2017 to 2022 as it was one of the most consumed crops globally, and due to an increase in demand from corn-based oil-generating industries.
- The demand for oil generation, the high export potential of oilseeds, especially soybean, and the increasing demand for bio-fuel generation in the global market are increasing the area of cultivation for field crops during the forecast period.

Understand The Key Trends Shaping This Market
Download PDF
Disease resistant and herbicide-tolerant are the popular traits in South America corn and wheat cultivation due to the significant impact of diseases on crop productivity and agricultural sustainability in the region.
- Corn and wheat are the major cereal crops grown in the South American region. These highly profitable crops are used for domestic consumption and export to other countries. In the region, especially in Brazil, herbicide-tolerant corn seeds are extensively cultivated. These seeds are tolerant to glyphosate, which helps control broad-spectrum weeds and improves yields and quality. Major companies like Bayer, Limagrain, and Corteva Agriscience offer such herbicide-tolerant varieties, with Dekalb being a popular brand from Bayer. In addition to herbicide tolerance, farmers in the region prefer corn varieties that are more adaptable to different growing conditions. These seeds serve dual purposes: grain, fodder, and resistance to early rots and leaf diseases.
- Wheat is another major staple cereal grain widely cultivated in South America. Farmers in the region mainly cultivate wheat cultivars resistant to diseases like Septoria, Fusarium, and rust to minimize crop losses and ensure productive tillers and panicles. In 2020, Argentina's government approved the cultivation of genetically modified (GM) wheat, and in 2020, Brazil also approved GM wheat cultivation. The HB4 drought-tolerant varieties, developed by Bioceres company, covered 55,000 hectares in Argentina and accounted for 0.85 of the total wheat cultivated area in 2021.
- Other popular wheat traits in the region include high tillering capacity, adaptability to various climatic conditions, and high milling quality. Therefore, with increasing export demand and advancements in breeding technology, such as the development of transgenic varieties, the demand for wheat and corn cultivars with multiple traits is projected to increase during 2023-2030.

OTHER KEY INDUSTRY TRENDS COVERED IN THE REPORT
- Chili is experiencing the fastest growth in cultivation area among vegetables in the region, driven by rising prices and consumption of chili
- Disease resistance and herbicide-tolerant traits dominate the market, driven by the rise in weed populations and the increasing prevalence of diseases in these crops
- Transgenic breeding dominated in row crops due to high approval rates of GM crops whereas hybrid breeding dominated vegetables due to improved traits.
- Disease resistant is the primary trait preferred in onion and lettuce cultivation to combat diseases such as pink root, bolting, and others.
- Disease resistance is a highly preferred trait in tomato, pumpkin, and squash cultivation due to its ability to combat prevalent diseases such as leaf curl virus in tomatoes and floral diseases in pumpkins and squash
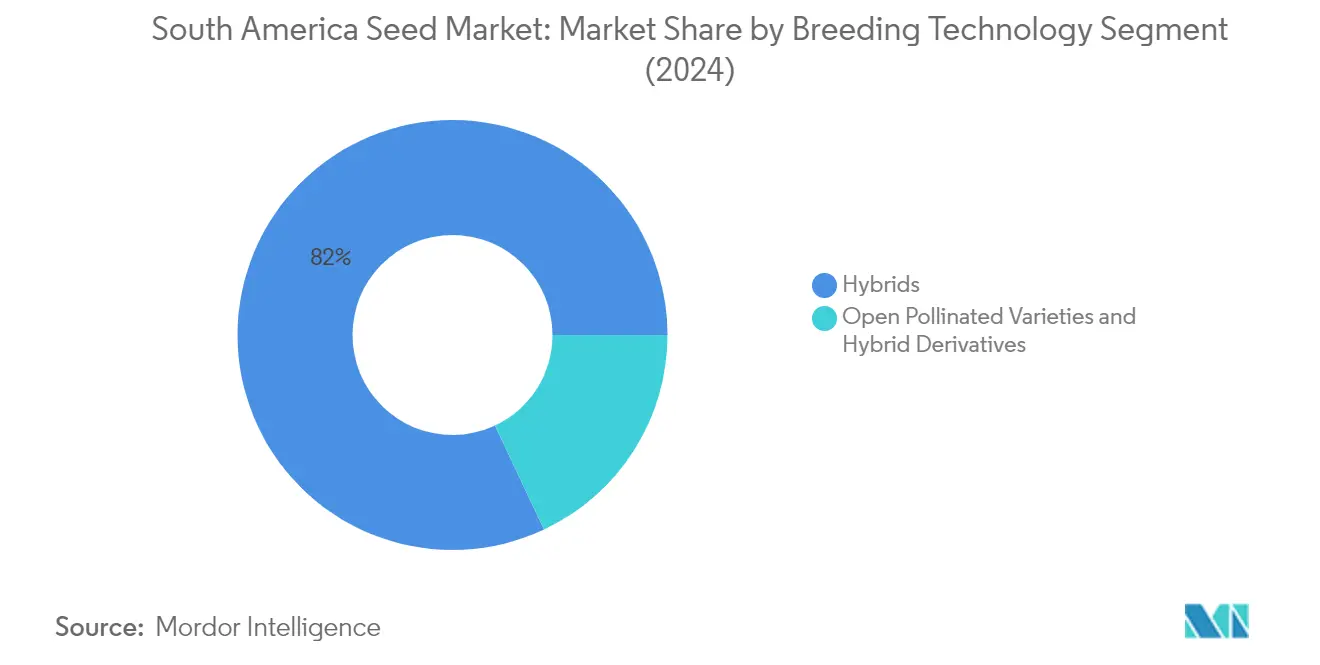
Segment Analysis: Breeding Technology
Hybrids Segment in South America Seed Market
The hybrid seeds segment, comprising both transgenic and non-transgenic varieties, dominates the South American seed market, accounting for approximately 82% of the market share in 2024. This significant market position is primarily driven by the widespread adoption of transgenic hybrids, particularly in major crops like corn, soybean, and alfalfa. The segment's dominance is further strengthened by the high penetration of insect-resistant and herbicide-tolerant traits, which together represent over 97% of the transgenic hybrid seeds market. Brazil and Argentina lead the adoption of hybrid seeds in the region, particularly in row crops, where farmers prefer these varieties for their superior yields, disease resistance, and adaptability to various growing conditions.
Hybrids Segment in South America Seed Market
As both the largest and fastest-growing segment, hybrid seeds are projected to maintain their market leadership with an estimated growth rate of around 7% during 2024-2029. This robust growth trajectory is supported by continuous technological advancements in plant breeding techniques, increasing adoption of genetically modified crops, and growing demand for high-yielding varieties. The segment's growth is particularly driven by the expanding use of stacked trait technologies that combine multiple beneficial characteristics such as insect resistance and herbicide tolerance. Additionally, increasing investments in research and development by major seed companies to develop improved hybrid varieties adapted to local growing conditions and resistant to emerging pests and diseases further support this growth momentum.
Remaining Segments in Breeding Technology
The open-pollinated varieties and hybrid derivatives segment represents the alternative to hybrid seeds in the South American market. This segment primarily serves small-holding farmers and organic producers who prefer traditional varieties for their lower cost and ability to save seeds for subsequent seasons. The segment maintains its relevance in certain crop categories, particularly in vegetables and indigenous varieties, where farmers value genetic diversity and local adaptation. While this segment faces increasing competition from hybrid varieties, it continues to play an important role in maintaining biodiversity and supporting traditional farming practices across the region.
Segment Analysis: Cultivation Mechanism
Open Field Segment in South America Seed Market
The open field cultivation segment dominates the South American seed market, commanding approximately 99.99% of the market share in 2024. This overwhelming dominance is primarily attributed to the traditional farming practices prevalent across the region and the significantly lower initial investment requirements compared to protected cultivation methods. The segment's strength is particularly evident in major agricultural countries like Brazil and Argentina, where extensive land availability and favorable climatic conditions support open-field farming. Row crops, including corn, soybeans, and wheat, constitute the majority of open-field cultivation, with about 81.6% of seeds used in South America being hybrid seeds due to their superior performance in varying weather conditions and enhanced resistance to diseases and insects.
Protected Cultivation Segment in South America Seed Market
The protected cultivation segment is emerging as the fastest-growing segment in the South American seed market, projected to grow at approximately 7.3% during 2024-2029. This growth is primarily driven by increasing investments in vertical farming infrastructure, particularly in urban centers of Brazil, and the rising demand for year-round fresh produce. The segment is witnessing significant technological advancements, with new greenhouse structures being established in regions like São Paulo and Minas Gerais. Major seed companies are responding to this trend by developing specialized varieties suited for protected cultivation, particularly for high-value crops like vegetable seeds such as tomatoes and leafy vegetables. The segment's growth is further supported by improved technologies available in the region and the increasing focus on quality produce with minimal pesticide usage.
Segment Analysis: Crop Type
Row Crops Segment in South America Seed Market
Row crops continue to dominate the South American seed market, accounting for approximately 95% of the total cultivated area in 2024. This commanding position is driven by major crops like soybean, corn, wheat, pulses, alfalfa, and rice. The segment's dominance is particularly notable in Brazil, which accounts for about 53% of the region's row crop cultivation area. The higher share of row crops is attributed to increased demand from food and beverage industries, rising requirements for biofuel generation using corn, and the availability of vast arable land compared to other major producing countries. Additionally, the adoption of genetically modified seeds, particularly in Brazil and Argentina where GM adoption rates reach nearly 100% for crops like soybeans and corn, has further strengthened the segment's position.
Wheat Segment in South America Seed Market
The wheat segment is emerging as the fastest-growing category in the South American seed market, projected to expand at approximately 8% through 2024-2029. This remarkable growth is primarily driven by increasing export opportunities to African countries that traditionally relied on Russian and Ukrainian wheat supplies. The segment's expansion is further supported by the development of new drought-tolerant varieties, improved disease resistance traits, and the introduction of advanced breeding technologies. The growth is particularly notable in Argentina, where farmers are increasingly adopting both transgenic and non-transgenic hybrid wheat varieties to meet the rising international demand and capitalize on higher profit margins in the export market.
Remaining Segments in Crop Type
The South American seed market encompasses several other significant segments including vegetable seeds, oilseeds, fiber crops, forage crops, and pulses. The vegetable seed segment, though smaller in cultivated area, plays a crucial role in regional food security and export diversity. Oilseeds, particularly soybeans, represent a strategic segment due to their importance in global trade and domestic processing industries. Fiber crops, dominated by cotton, continue to support the region's textile industry, while forage crops are essential for supporting the robust livestock sector. Pulses contribute to crop rotation practices and soil health management, while also meeting growing protein demands in domestic and international markets.
South America Seed Market Geography Segment Analysis
South America Seed Market in Brazil
Brazil dominates the South American seed market, commanding approximately 52% of the total market value in 2024. The country's leadership position is primarily driven by its vast agricultural landscape and progressive adoption of advanced agricultural seed technologies. Brazil's seed market is particularly strong in row crops, with corn and soybean seeds representing the majority share. The country's success in the American seed market is underpinned by its robust research and development infrastructure, with multiple seed companies maintaining research stations and development centers throughout the country. Brazil's agricultural sector benefits from favorable climatic conditions and extensive arable land, making it ideal for commercial seed production and cultivation. The country's seed industry is characterized by high adoption rates of genetically modified varieties, particularly in crops like soybeans and corn, where GM adoption rates reach nearly 100%. Furthermore, Brazil's position as the world's third-largest corn producer and leading soybean producer continues to drive innovation and investment in the seed sector.
South America Seed Market in Argentina
Argentina maintains its position as a crucial player in the South American seed market, with a strong focus on oilseed crops, particularly soybeans and sunflowers. The country's seed industry benefits from its well-established agricultural infrastructure and favorable growing conditions. Argentina's seed market is characterized by high adoption rates of biotechnology, particularly in major row crops. The country has developed a robust regulatory framework for seed development and commercialization, attracting significant investment from major international seed companies. Argentine farmers have shown increasing preference for hybrid seeds, particularly in crops like corn and sunflower, due to their superior yields and disease resistance characteristics. The country's seed industry is supported by strong research and development activities, with both public and private institutions working on developing varieties adapted to local conditions. Argentina's position as a major agricultural exporter has driven continuous innovation in seed technology, particularly in developing varieties with improved quality traits and stress tolerance.
South America Seed Market in Other Countries
The Latin American seed market in Peru, Colombia, Chile, and Venezuela collectively represents a significant portion of the South American seed industry, each with unique characteristics and growth drivers. These countries demonstrate varying levels of technological adoption and market maturity in their seed sectors. Peru has established itself as a center for native crop diversity, particularly in potato varieties, while Chile has developed a strong reputation for seed production and export. Colombia's seed market is characterized by increasing modernization and adoption of improved varieties, particularly in horticultural crops. Venezuela, despite economic challenges, maintains a strategic focus on developing its seed sector to enhance food security. These markets are witnessing growing interest from international seed companies, leading to increased availability of improved varieties. The development of these markets is supported by various government initiatives aimed at modernizing agricultural practices and improving crop productivity. Additionally, these countries are experiencing growing demand for specialty seeds, particularly in the vegetable and fruit segments, driven by changing consumer preferences and export opportunities.
Get Analysis on Important Geographic Markets
Download PDF
South America Seed Industry Overview
Top Companies in South America Seed Market
The South American seed market is characterized by intense competition driven by continuous product innovation and strategic expansion initiatives. Companies are heavily investing in developing new seed varieties with enhanced traits for disease resistance, drought tolerance, and higher yields. Operational agility is demonstrated through the establishment of local research centers and breeding stations to develop region-specific varieties, particularly in Brazil and Argentina. Strategic moves predominantly focus on partnerships with local agricultural institutions and technology providers to strengthen research capabilities and distribution networks. Market leaders are expanding their presence through investments in production facilities and acquisition of regional seed companies to enhance their product portfolios and geographical reach. The emphasis on digital farming solutions and sustainable agricultural practices is becoming increasingly important in competitive positioning.
Consolidated Market Led By Global Players
The South American seed market exhibits a consolidated structure dominated by global agricultural conglomerates with established research and development capabilities. These multinational companies leverage their extensive germplasm libraries, advanced seed technology, and strong distribution networks to maintain their market positions. Local players maintain their presence through specialized knowledge of regional growing conditions and strong relationships with farmers, though their market share remains limited compared to global leaders. The market has witnessed significant consolidation through mergers and acquisitions, particularly involving smaller regional seed companies being acquired by larger corporations seeking to expand their regional footprint.
The competitive dynamics are shaped by the presence of both diversified agricultural input companies and specialized commercial seed producers. Major global players operate through multiple brands and subsidiaries, offering comprehensive solutions including seeds, crop protection, and digital farming services. The market structure favors companies with integrated operations and strong financial capabilities to invest in research and development. Regional players focus on niche segments and specific crop varieties where they can maintain competitive advantages through specialized expertise and local market knowledge.
Innovation and Local Presence Drive Success
Success in the South American seed market increasingly depends on companies' ability to develop locally adapted varieties while leveraging global technological capabilities. Market leaders must continue investing in research and development to create seeds with improved traits, particularly focusing on climate resilience and pest resistance. Building strong relationships with farmers through technical support and education programs is crucial for maintaining market share. Companies need to establish efficient production and distribution networks while ensuring compliance with regional regulatory requirements. The ability to offer integrated solutions combining seeds with complementary agricultural inputs and digital farming tools is becoming increasingly important for competitive success.
For emerging players and contenders, success lies in identifying and serving underserved market segments and crop varieties. Developing specialized expertise in specific crops or regional growing conditions can provide opportunities for market entry and growth. Strategic partnerships with research institutions and technology providers can help overcome resource limitations and accelerate product development. Companies must also focus on building strong distribution networks and establishing their brand reputation through demonstrated product performance and reliable customer service. Understanding and adapting to evolving regulatory requirements, particularly regarding genetically modified organisms and seed certification, remains crucial for sustained market presence.
South America Seed Market Leaders
-
Advanta Seeds - UPL
-
Bayer AG
-
Corteva Agriscience
-
Groupe Limagrain
-
Syngenta Group
- *Disclaimer: Major Players sorted in no particular order

Need More Details on Market Players and Competiters?
Download PDF
South America Seed Market News
- July 2023: BASF expanded its Xitavo soybean seed portfolio with the addition of its 11 new high-yielding varieties for the 2024 growing season, featuring the Enlist E3 technology to combat difficult weeds.
- May 2023: Advanta Seeds made an agreement with Embrapa (Brazilian Agricultural Research Corporation) to develop hybrid canola seeds with nematode management potential.
- April 2023: Syngenta Seeds and Ginkgo Bioworks collaborated to develop new traits for the next generation of seed technology to produce healthier and more resilient crops.
Free With This Report
We provide a complimentary and exhaustive set of data points on regional and country-level metrics that present the fundamental structure of the industry. Presented in the form of 90+ free charts, the section covers difficult-to-find data from various regions regarding the area under cultivation for different crops within the scope


South America Seed Market Report - Table of Contents
1. EXECUTIVE SUMMARY & KEY FINDINGS
2. REPORT OFFERS
3. INTRODUCTION
- 3.1 Study Assumptions & Market Definition
- 3.2 Scope of the Study
- 3.3 Research Methodology
4. KEY INDUSTRY TRENDS
-
4.1 Area Under Cultivation
- 4.1.1 Row Crops
- 4.1.2 Vegetables
-
4.2 Most Popular Traits
- 4.2.1 Corn & Wheat
- 4.2.2 Onion & Lettuce
- 4.2.3 Soybean & Alfalfa
- 4.2.4 Tomato, Pumpkin & Squash
-
4.3 Breeding Techniques
- 4.3.1 Row Crops & Vegetables
- 4.4 Regulatory Framework
- 4.5 Value Chain & Distribution Channel Analysis
5. MARKET SEGMENTATION (includes market size in Value in USD, Forecasts up to 2030 and analysis of growth prospects)
-
5.1 Breeding Technology
- 5.1.1 Hybrids
- 5.1.1.1 Non-Transgenic Hybrids
- 5.1.1.2 Transgenic Hybrids
- 5.1.1.2.1 Herbicide Tolerant Hybrids
- 5.1.1.2.2 Insect Resistant Hybrids
- 5.1.1.2.3 Other Traits
- 5.1.2 Open Pollinated Varieties & Hybrid Derivatives
-
5.2 Cultivation Mechanism
- 5.2.1 Open Field
- 5.2.2 Protected Cultivation
-
5.3 Crop Type
- 5.3.1 Row Crops
- 5.3.1.1 Fiber Crops
- 5.3.1.1.1 Cotton
- 5.3.1.1.2 Other Fiber Crops
- 5.3.1.2 Forage Crops
- 5.3.1.2.1 Alfalfa
- 5.3.1.2.2 Forage Corn
- 5.3.1.2.3 Forage Sorghum
- 5.3.1.2.4 Other Forage Crops
- 5.3.1.3 Grains & Cereals
- 5.3.1.3.1 Corn
- 5.3.1.3.2 Rice
- 5.3.1.3.3 Sorghum
- 5.3.1.3.4 Wheat
- 5.3.1.3.5 Other Grains & Cereals
- 5.3.1.4 Oilseeds
- 5.3.1.4.1 Canola, Rapeseed & Mustard
- 5.3.1.4.2 Soybean
- 5.3.1.4.3 Sunflower
- 5.3.1.4.4 Other Oilseeds
- 5.3.1.5 Pulses
- 5.3.1.5.1 Pulses
- 5.3.2 Vegetables
- 5.3.2.1 Brassicas
- 5.3.2.1.1 Cabbage
- 5.3.2.1.2 Carrot
- 5.3.2.1.3 Cauliflower & Broccoli
- 5.3.2.1.4 Other Brassicas
- 5.3.2.2 Cucurbits
- 5.3.2.2.1 Cucumber & Gherkin
- 5.3.2.2.2 Pumpkin & Squash
- 5.3.2.2.3 Other Cucurbits
- 5.3.2.3 Roots & Bulbs
- 5.3.2.3.1 Garlic
- 5.3.2.3.2 Onion
- 5.3.2.3.3 Potato
- 5.3.2.3.4 Other Roots & Bulbs
- 5.3.2.4 Solanaceae
- 5.3.2.4.1 Chilli
- 5.3.2.4.2 Eggplant
- 5.3.2.4.3 Tomato
- 5.3.2.4.4 Other Solanaceae
- 5.3.2.5 Unclassified Vegetables
- 5.3.2.5.1 Asparagus
- 5.3.2.5.2 Lettuce
- 5.3.2.5.3 Okra
- 5.3.2.5.4 Peas
- 5.3.2.5.5 Spinach
- 5.3.2.5.6 Other Unclassified Vegetables
-
5.4 Country
- 5.4.1 Argentina
- 5.4.2 Brazil
- 5.4.3 Rest of South America
6. COMPETITIVE LANDSCAPE
- 6.1 Key Strategic Moves
- 6.2 Market Share Analysis
- 6.3 Company Landscape
-
6.4 Company Profiles
- 6.4.1 Advanta Seeds - UPL
- 6.4.2 BASF SE
- 6.4.3 Bayer AG
- 6.4.4 Corteva Agriscience
- 6.4.5 DLF
- 6.4.6 Groupe Limagrain
- 6.4.7 KWS SAAT SE & Co. KGaA
- 6.4.8 Rijk Zwaan Zaadteelt en Zaadhandel BV
- 6.4.9 Sakata Seeds Corporation
- 6.4.10 Syngenta Group
- *List Not Exhaustive
7. KEY STRATEGIC QUESTIONS FOR SEEDS CEOS
8. APPENDIX
-
8.1 Global Overview
- 8.1.1 Overview
- 8.1.2 Porter’s Five Forces Framework
- 8.1.3 Global Value Chain Analysis
- 8.1.4 Global Market Size and DROs
- 8.2 Sources & References
- 8.3 List of Tables & Figures
- 8.4 Primary Insights
- 8.5 Data Pack
- 8.6 Glossary of Terms
You Can Purchase Parts Of This Report. Check Out Prices For Specific Sections
Get Price Break-up Now
List of Tables & Figures
- Figure 1:
- AREA UNDER CULTIVATION OF ROW CROPS, HECTARE, SOUTH AMERICA, 2017-2022
- Figure 2:
- AREA UNDER CULTIVATION OF VEGETABLES, HECTARE, SOUTH AMERICA, 2017-2022
- Figure 3:
- VALUE SHARE OF MAJOR CORN TRAITS, %, SOUTH AMERICA, 2022
- Figure 4:
- VALUE SHARE OF MAJOR WHEAT TRAITS, %, SOUTH AMERICA, 2022
- Figure 5:
- VALUE SHARE OF MAJOR ONION TRAITS, %, SOUTH AMERICA, 2022
- Figure 6:
- VALUE SHARE OF MAJOR LETTUCE TRAITS, %, SOUTH AMERICA, 2022
- Figure 7:
- VALUE SHARE OF MAJOR SOYBEAN TRAITS, %, SOUTH AMERICA, 2022
- Figure 8:
- VALUE SHARE OF MAJOR ALFALFA TRAITS, %, SOUTH AMERICA, 2022
- Figure 9:
- VALUE SHARE OF MAJOR TOMATO TRAITS, %, SOUTH AMERICA, 2022
- Figure 10:
- VALUE SHARE OF MAJOR PUMPKIN & SQUASH TRAITS, %, SOUTH AMERICA, 2022
- Figure 11:
- VALUE SHARE OF ROW CROPS BREEDING TECHNIQUES, %, SOUTH AMERICA, 2022
- Figure 12:
- VALUE SHARE OF VEGETABLES BREEDING TECHNIQUES, %, SOUTH AMERICA, 2022
- Figure 13:
- VOLUME OF SEEDS, METRIC TON, SOUTH AMERICA, 2017 - 2030
- Figure 14:
- VALUE OF SEEDS, USD, SOUTH AMERICA, 2017 - 2030
- Figure 15:
- VOLUME OF SEEDS BY BREEDING TECHNOLOGY CATEGORIES, METRIC TON, SOUTH AMERICA, 2017 - 2030
- Figure 16:
- VALUE OF SEEDS BY BREEDING TECHNOLOGY CATEGORIES, USD, SOUTH AMERICA, 2017 - 2030
- Figure 17:
- VOLUME SHARE OF SEEDS BY BREEDING TECHNOLOGY CATEGORIES, %, SOUTH AMERICA, 2017 VS 2023 VS 2030
- Figure 18:
- VALUE SHARE OF SEEDS BY BREEDING TECHNOLOGY CATEGORIES, %, SOUTH AMERICA, 2017 VS 2023 VS 2030
- Figure 19:
- VOLUME OF SEEDS BY HYBRIDS CATEGORIES, METRIC TON, SOUTH AMERICA, 2017 - 2030
- Figure 20:
- VALUE OF SEEDS BY HYBRIDS CATEGORIES, USD, SOUTH AMERICA, 2017 - 2030
- Figure 21:
- VOLUME SHARE OF SEEDS BY HYBRIDS CATEGORIES, %, SOUTH AMERICA, 2017 VS 2023 VS 2030
- Figure 22:
- VALUE SHARE OF SEEDS BY HYBRIDS CATEGORIES, %, SOUTH AMERICA, 2017 VS 2023 VS 2030
- Figure 23:
- VOLUME OF NON-TRANSGENIC HYBRIDS SEEDS, METRIC TON, SOUTH AMERICA, 2017 - 2030
- Figure 24:
- VALUE OF NON-TRANSGENIC HYBRIDS SEEDS, USD, SOUTH AMERICA, 2017 - 2030
- Figure 25:
- VALUE SHARE OF NON-TRANSGENIC HYBRIDS SEEDS BY CROP, %, SOUTH AMERICA, 2023 AND 2030
- Figure 26:
- VOLUME OF SEEDS BY TRANSGENIC HYBRIDS CATEGORIES, METRIC TON, SOUTH AMERICA, 2017 - 2030
- Figure 27:
- VALUE OF SEEDS BY TRANSGENIC HYBRIDS CATEGORIES, USD, SOUTH AMERICA, 2017 - 2030
- Figure 28:
- VOLUME SHARE OF SEEDS BY TRANSGENIC HYBRIDS CATEGORIES, %, SOUTH AMERICA, 2017 VS 2023 VS 2030
- Figure 29:
- VALUE SHARE OF SEEDS BY TRANSGENIC HYBRIDS CATEGORIES, %, SOUTH AMERICA, 2017 VS 2023 VS 2030
- Figure 30:
- VOLUME OF HERBICIDE TOLERANT HYBRIDS SEEDS, METRIC TON, SOUTH AMERICA, 2017 - 2030
- Figure 31:
- VALUE OF HERBICIDE TOLERANT HYBRIDS SEEDS, USD, SOUTH AMERICA, 2017 - 2030
- Figure 32:
- VALUE SHARE OF HERBICIDE TOLERANT HYBRIDS SEEDS BY CROP, %, SOUTH AMERICA, 2023 AND 2030
- Figure 33:
- VOLUME OF INSECT RESISTANT HYBRIDS SEEDS, METRIC TON, SOUTH AMERICA, 2017 - 2030
- Figure 34:
- VALUE OF INSECT RESISTANT HYBRIDS SEEDS, USD, SOUTH AMERICA, 2017 - 2030
- Figure 35:
- VALUE SHARE OF INSECT RESISTANT HYBRIDS SEEDS BY CROP, %, SOUTH AMERICA, 2023 AND 2030
- Figure 36:
- VOLUME OF OTHER TRAITS SEEDS, METRIC TON, SOUTH AMERICA, 2017 - 2030
- Figure 37:
- VALUE OF OTHER TRAITS SEEDS, USD, SOUTH AMERICA, 2017 - 2030
- Figure 38:
- VALUE SHARE OF OTHER TRAITS SEEDS BY CROP, %, SOUTH AMERICA, 2023 AND 2030
- Figure 39:
- VOLUME OF OPEN POLLINATED VARIETIES & HYBRID DERIVATIVES SEEDS, METRIC TON, SOUTH AMERICA, 2017 - 2030
- Figure 40:
- VALUE OF OPEN POLLINATED VARIETIES & HYBRID DERIVATIVES SEEDS, USD, SOUTH AMERICA, 2017 - 2030
- Figure 41:
- VALUE SHARE OF OPEN POLLINATED VARIETIES & HYBRID DERIVATIVES SEEDS BY CROP, %, SOUTH AMERICA, 2023 AND 2030
- Figure 42:
- VOLUME OF SEEDS BY CULTIVATION MECHANISM CATEGORIES, METRIC TON, SOUTH AMERICA, 2017 - 2030
- Figure 43:
- VALUE OF SEEDS BY CULTIVATION MECHANISM CATEGORIES, USD, SOUTH AMERICA, 2017 - 2030
- Figure 44:
- VOLUME SHARE OF SEEDS BY CULTIVATION MECHANISM CATEGORIES, %, SOUTH AMERICA, 2017 VS 2023 VS 2030
- Figure 45:
- VALUE SHARE OF SEEDS BY CULTIVATION MECHANISM CATEGORIES, %, SOUTH AMERICA, 2017 VS 2023 VS 2030
- Figure 46:
- VOLUME OF SEEDS SOWN IN OPEN FIELD, METRIC TON, SOUTH AMERICA, 2017 - 2030
- Figure 47:
- VALUE OF SEEDS SOWN IN OPEN FIELD, USD, SOUTH AMERICA, 2017 - 2030
- Figure 48:
- VALUE SHARE OF SEEDS SOWN IN OPEN FIELD BY CROP, %, SOUTH AMERICA, 2023 AND 2030
- Figure 49:
- VOLUME OF SEEDS SOWN IN PROTECTED CULTIVATION, METRIC TON, SOUTH AMERICA, 2017 - 2030
- Figure 50:
- VALUE OF SEEDS SOWN IN PROTECTED CULTIVATION, USD, SOUTH AMERICA, 2017 - 2030
- Figure 51:
- VALUE SHARE OF SEEDS SOWN IN PROTECTED CULTIVATION BY CROP, %, SOUTH AMERICA, 2023 AND 2030
- Figure 52:
- VOLUME OF SEEDS BY CROP TYPE CATEGORIES, METRIC TON, SOUTH AMERICA, 2017 - 2030
- Figure 53:
- VALUE OF SEEDS BY CROP TYPE CATEGORIES, USD, SOUTH AMERICA, 2017 - 2030
- Figure 54:
- VOLUME SHARE OF SEEDS BY CROP TYPE CATEGORIES, %, SOUTH AMERICA, 2017 VS 2023 VS 2030
- Figure 55:
- VALUE SHARE OF SEEDS BY CROP TYPE CATEGORIES, %, SOUTH AMERICA, 2017 VS 2023 VS 2030
- Figure 56:
- VOLUME OF SEEDS BY CROP FAMILY CATEGORIES, METRIC TON, SOUTH AMERICA, 2017 - 2030
- Figure 57:
- VALUE OF SEEDS BY CROP FAMILY CATEGORIES, USD, SOUTH AMERICA, 2017 - 2030
- Figure 58:
- VOLUME SHARE OF SEEDS BY CROP FAMILY CATEGORIES, %, SOUTH AMERICA, 2017 VS 2023 VS 2030
- Figure 59:
- VALUE SHARE OF SEEDS BY CROP FAMILY CATEGORIES, %, SOUTH AMERICA, 2017 VS 2023 VS 2030
- Figure 60:
- VOLUME OF SEEDS BY CROP CATEGORIES, METRIC TON, SOUTH AMERICA, 2017 - 2030
- Figure 61:
- VALUE OF SEEDS BY CROP CATEGORIES, USD, SOUTH AMERICA, 2017 - 2030
- Figure 62:
- VOLUME SHARE OF SEEDS BY CROP CATEGORIES, %, SOUTH AMERICA, 2017 VS 2023 VS 2030
- Figure 63:
- VALUE SHARE OF SEEDS BY CROP CATEGORIES, %, SOUTH AMERICA, 2017 VS 2023 VS 2030
- Figure 64:
- VOLUME OF COTTON SEED, METRIC TON, SOUTH AMERICA, 2017 - 2030
- Figure 65:
- VALUE OF COTTON SEED, USD, SOUTH AMERICA, 2017 - 2030
- Figure 66:
- VALUE SHARE OF COTTON SEED BY BREEDING TECHNOLOGY, %, SOUTH AMERICA, 2023 AND 2030
- Figure 67:
- VOLUME OF OTHER FIBER CROPS SEED, METRIC TON, SOUTH AMERICA, 2017 - 2030
- Figure 68:
- VALUE OF OTHER FIBER CROPS SEED, USD, SOUTH AMERICA, 2017 - 2030
- Figure 69:
- VALUE SHARE OF OTHER FIBER CROPS SEED BY BREEDING TECHNOLOGY, %, SOUTH AMERICA, 2023 AND 2030
- Figure 70:
- VOLUME OF SEEDS BY CROP CATEGORIES, METRIC TON, SOUTH AMERICA, 2017 - 2030
- Figure 71:
- VALUE OF SEEDS BY CROP CATEGORIES, USD, SOUTH AMERICA, 2017 - 2030
- Figure 72:
- VOLUME SHARE OF SEEDS BY CROP CATEGORIES, %, SOUTH AMERICA, 2017 VS 2023 VS 2030
- Figure 73:
- VALUE SHARE OF SEEDS BY CROP CATEGORIES, %, SOUTH AMERICA, 2017 VS 2023 VS 2030
- Figure 74:
- VOLUME OF ALFALFA SEED, METRIC TON, SOUTH AMERICA, 2017 - 2030
- Figure 75:
- VALUE OF ALFALFA SEED, USD, SOUTH AMERICA, 2017 - 2030
- Figure 76:
- VALUE SHARE OF ALFALFA SEED BY BREEDING TECHNOLOGY, %, SOUTH AMERICA, 2023 AND 2030
- Figure 77:
- VOLUME OF FORAGE CORN SEED, METRIC TON, SOUTH AMERICA, 2017 - 2030
- Figure 78:
- VALUE OF FORAGE CORN SEED, USD, SOUTH AMERICA, 2017 - 2030
- Figure 79:
- VALUE SHARE OF FORAGE CORN SEED BY BREEDING TECHNOLOGY, %, SOUTH AMERICA, 2023 AND 2030
- Figure 80:
- VOLUME OF FORAGE SORGHUM SEED, METRIC TON, SOUTH AMERICA, 2017 - 2030
- Figure 81:
- VALUE OF FORAGE SORGHUM SEED, USD, SOUTH AMERICA, 2017 - 2030
- Figure 82:
- VALUE SHARE OF FORAGE SORGHUM SEED BY BREEDING TECHNOLOGY, %, SOUTH AMERICA, 2023 AND 2030
- Figure 83:
- VOLUME OF OTHER FORAGE CROPS SEED, METRIC TON, SOUTH AMERICA, 2017 - 2030
- Figure 84:
- VALUE OF OTHER FORAGE CROPS SEED, USD, SOUTH AMERICA, 2017 - 2030
- Figure 85:
- VALUE SHARE OF OTHER FORAGE CROPS SEED BY BREEDING TECHNOLOGY, %, SOUTH AMERICA, 2023 AND 2030
- Figure 86:
- VOLUME OF SEEDS BY CROP CATEGORIES, METRIC TON, SOUTH AMERICA, 2017 - 2030
- Figure 87:
- VALUE OF SEEDS BY CROP CATEGORIES, USD, SOUTH AMERICA, 2017 - 2030
- Figure 88:
- VOLUME SHARE OF SEEDS BY CROP CATEGORIES, %, SOUTH AMERICA, 2017 VS 2023 VS 2030
- Figure 89:
- VALUE SHARE OF SEEDS BY CROP CATEGORIES, %, SOUTH AMERICA, 2017 VS 2023 VS 2030
- Figure 90:
- VOLUME OF CORN SEED, METRIC TON, SOUTH AMERICA, 2017 - 2030
- Figure 91:
- VALUE OF CORN SEED, USD, SOUTH AMERICA, 2017 - 2030
- Figure 92:
- VALUE SHARE OF CORN SEED BY BREEDING TECHNOLOGY, %, SOUTH AMERICA, 2023 AND 2030
- Figure 93:
- VOLUME OF RICE SEED, METRIC TON, SOUTH AMERICA, 2017 - 2030
- Figure 94:
- VALUE OF RICE SEED, USD, SOUTH AMERICA, 2017 - 2030
- Figure 95:
- VALUE SHARE OF RICE SEED BY BREEDING TECHNOLOGY, %, SOUTH AMERICA, 2023 AND 2030
- Figure 96:
- VOLUME OF SORGHUM SEED, METRIC TON, SOUTH AMERICA, 2017 - 2030
- Figure 97:
- VALUE OF SORGHUM SEED, USD, SOUTH AMERICA, 2017 - 2030
- Figure 98:
- VALUE SHARE OF SORGHUM SEED BY BREEDING TECHNOLOGY, %, SOUTH AMERICA, 2023 AND 2030
- Figure 99:
- VOLUME OF WHEAT SEED, METRIC TON, SOUTH AMERICA, 2017 - 2030
- Figure 100:
- VALUE OF WHEAT SEED, USD, SOUTH AMERICA, 2017 - 2030
- Figure 101:
- VALUE SHARE OF WHEAT SEED BY BREEDING TECHNOLOGY, %, SOUTH AMERICA, 2023 AND 2030
- Figure 102:
- VOLUME OF OTHER GRAINS & CEREALS SEED, METRIC TON, SOUTH AMERICA, 2017 - 2030
- Figure 103:
- VALUE OF OTHER GRAINS & CEREALS SEED, USD, SOUTH AMERICA, 2017 - 2030
- Figure 104:
- VALUE SHARE OF OTHER GRAINS & CEREALS SEED BY BREEDING TECHNOLOGY, %, SOUTH AMERICA, 2023 AND 2030
- Figure 105:
- VOLUME OF SEEDS BY CROP CATEGORIES, METRIC TON, SOUTH AMERICA, 2017 - 2030
- Figure 106:
- VALUE OF SEEDS BY CROP CATEGORIES, USD, SOUTH AMERICA, 2017 - 2030
- Figure 107:
- VOLUME SHARE OF SEEDS BY CROP CATEGORIES, %, SOUTH AMERICA, 2017 VS 2023 VS 2030
- Figure 108:
- VALUE SHARE OF SEEDS BY CROP CATEGORIES, %, SOUTH AMERICA, 2017 VS 2023 VS 2030
- Figure 109:
- VOLUME OF CANOLA, RAPESEED & MUSTARD SEED, METRIC TON, SOUTH AMERICA, 2017 - 2030
- Figure 110:
- VALUE OF CANOLA, RAPESEED & MUSTARD SEED, USD, SOUTH AMERICA, 2017 - 2030
- Figure 111:
- VALUE SHARE OF CANOLA, RAPESEED & MUSTARD SEED BY BREEDING TECHNOLOGY, %, SOUTH AMERICA, 2023 AND 2030
- Figure 112:
- VOLUME OF SOYBEAN SEED, METRIC TON, SOUTH AMERICA, 2017 - 2030
- Figure 113:
- VALUE OF SOYBEAN SEED, USD, SOUTH AMERICA, 2017 - 2030
- Figure 114:
- VALUE SHARE OF SOYBEAN SEED BY BREEDING TECHNOLOGY, %, SOUTH AMERICA, 2023 AND 2030
- Figure 115:
- VOLUME OF SUNFLOWER SEED, METRIC TON, SOUTH AMERICA, 2017 - 2030
- Figure 116:
- VALUE OF SUNFLOWER SEED, USD, SOUTH AMERICA, 2017 - 2030
- Figure 117:
- VALUE SHARE OF SUNFLOWER SEED BY BREEDING TECHNOLOGY, %, SOUTH AMERICA, 2023 AND 2030
- Figure 118:
- VOLUME OF OTHER OILSEEDS SEED, METRIC TON, SOUTH AMERICA, 2017 - 2030
- Figure 119:
- VALUE OF OTHER OILSEEDS SEED, USD, SOUTH AMERICA, 2017 - 2030
- Figure 120:
- VALUE SHARE OF OTHER OILSEEDS SEED BY BREEDING TECHNOLOGY, %, SOUTH AMERICA, 2023 AND 2030
- Figure 121:
- VOLUME OF SEEDS BY CROP CATEGORIES, METRIC TON, SOUTH AMERICA, 2017 - 2030
- Figure 122:
- VALUE OF SEEDS BY CROP CATEGORIES, USD, SOUTH AMERICA, 2017 - 2030
- Figure 123:
- VOLUME SHARE OF SEEDS BY CROP CATEGORIES, %, SOUTH AMERICA, 2017 VS 2023 VS 2030
- Figure 124:
- VALUE SHARE OF SEEDS BY CROP CATEGORIES, %, SOUTH AMERICA, 2017 VS 2023 VS 2030
- Figure 125:
- VOLUME OF PULSES SEED, METRIC TON, SOUTH AMERICA, 2017 - 2030
- Figure 126:
- VALUE OF PULSES SEED, USD, SOUTH AMERICA, 2017 - 2030
- Figure 127:
- VOLUME OF SEEDS BY CROP FAMILY CATEGORIES, METRIC TON, SOUTH AMERICA, 2017 - 2030
- Figure 128:
- VALUE OF SEEDS BY CROP FAMILY CATEGORIES, USD, SOUTH AMERICA, 2017 - 2030
- Figure 129:
- VOLUME SHARE OF SEEDS BY CROP FAMILY CATEGORIES, %, SOUTH AMERICA, 2017 VS 2023 VS 2030
- Figure 130:
- VALUE SHARE OF SEEDS BY CROP FAMILY CATEGORIES, %, SOUTH AMERICA, 2017 VS 2023 VS 2030
- Figure 131:
- VOLUME OF SEEDS BY CROP CATEGORIES, METRIC TON, SOUTH AMERICA, 2017 - 2030
- Figure 132:
- VALUE OF SEEDS BY CROP CATEGORIES, USD, SOUTH AMERICA, 2017 - 2030
- Figure 133:
- VOLUME SHARE OF SEEDS BY CROP CATEGORIES, %, SOUTH AMERICA, 2017 VS 2023 VS 2030
- Figure 134:
- VALUE SHARE OF SEEDS BY CROP CATEGORIES, %, SOUTH AMERICA, 2017 VS 2023 VS 2030
- Figure 135:
- VOLUME OF CABBAGE SEED, METRIC TON, SOUTH AMERICA, 2017 - 2030
- Figure 136:
- VALUE OF CABBAGE SEED, USD, SOUTH AMERICA, 2017 - 2030
- Figure 137:
- VALUE SHARE OF CABBAGE SEED BY BREEDING TECHNOLOGY, %, SOUTH AMERICA, 2023 AND 2030
- Figure 138:
- VOLUME OF CARROT SEED, METRIC TON, SOUTH AMERICA, 2017 - 2030
- Figure 139:
- VALUE OF CARROT SEED, USD, SOUTH AMERICA, 2017 - 2030
- Figure 140:
- VALUE SHARE OF CARROT SEED BY BREEDING TECHNOLOGY, %, SOUTH AMERICA, 2023 AND 2030
- Figure 141:
- VOLUME OF CAULIFLOWER & BROCCOLI SEED, METRIC TON, SOUTH AMERICA, 2017 - 2030
- Figure 142:
- VALUE OF CAULIFLOWER & BROCCOLI SEED, USD, SOUTH AMERICA, 2017 - 2030
- Figure 143:
- VALUE SHARE OF CAULIFLOWER & BROCCOLI SEED BY BREEDING TECHNOLOGY, %, SOUTH AMERICA, 2023 AND 2030
- Figure 144:
- VOLUME OF OTHER BRASSICAS SEED, METRIC TON, SOUTH AMERICA, 2017 - 2030
- Figure 145:
- VALUE OF OTHER BRASSICAS SEED, USD, SOUTH AMERICA, 2017 - 2030
- Figure 146:
- VALUE SHARE OF OTHER BRASSICAS SEED BY BREEDING TECHNOLOGY, %, SOUTH AMERICA, 2023 AND 2030
- Figure 147:
- VOLUME OF SEEDS BY CROP CATEGORIES, METRIC TON, SOUTH AMERICA, 2017 - 2030
- Figure 148:
- VALUE OF SEEDS BY CROP CATEGORIES, USD, SOUTH AMERICA, 2017 - 2030
- Figure 149:
- VOLUME SHARE OF SEEDS BY CROP CATEGORIES, %, SOUTH AMERICA, 2017 VS 2023 VS 2030
- Figure 150:
- VALUE SHARE OF SEEDS BY CROP CATEGORIES, %, SOUTH AMERICA, 2017 VS 2023 VS 2030
- Figure 151:
- VOLUME OF CUCUMBER & GHERKIN SEED, METRIC TON, SOUTH AMERICA, 2017 - 2030
- Figure 152:
- VALUE OF CUCUMBER & GHERKIN SEED, USD, SOUTH AMERICA, 2017 - 2030
- Figure 153:
- VALUE SHARE OF CUCUMBER & GHERKIN SEED BY BREEDING TECHNOLOGY, %, SOUTH AMERICA, 2023 AND 2030
- Figure 154:
- VOLUME OF PUMPKIN & SQUASH SEED, METRIC TON, SOUTH AMERICA, 2017 - 2030
- Figure 155:
- VALUE OF PUMPKIN & SQUASH SEED, USD, SOUTH AMERICA, 2017 - 2030
- Figure 156:
- VALUE SHARE OF PUMPKIN & SQUASH SEED BY BREEDING TECHNOLOGY, %, SOUTH AMERICA, 2023 AND 2030
- Figure 157:
- VOLUME OF OTHER CUCURBITS SEED, METRIC TON, SOUTH AMERICA, 2017 - 2030
- Figure 158:
- VALUE OF OTHER CUCURBITS SEED, USD, SOUTH AMERICA, 2017 - 2030
- Figure 159:
- VALUE SHARE OF OTHER CUCURBITS SEED BY BREEDING TECHNOLOGY, %, SOUTH AMERICA, 2023 AND 2030
- Figure 160:
- VOLUME OF SEEDS BY CROP CATEGORIES, METRIC TON, SOUTH AMERICA, 2017 - 2030
- Figure 161:
- VALUE OF SEEDS BY CROP CATEGORIES, USD, SOUTH AMERICA, 2017 - 2030
- Figure 162:
- VOLUME SHARE OF SEEDS BY CROP CATEGORIES, %, SOUTH AMERICA, 2017 VS 2023 VS 2030
- Figure 163:
- VALUE SHARE OF SEEDS BY CROP CATEGORIES, %, SOUTH AMERICA, 2017 VS 2023 VS 2030
- Figure 164:
- VOLUME OF GARLIC SEED, METRIC TON, SOUTH AMERICA, 2017 - 2030
- Figure 165:
- VALUE OF GARLIC SEED, USD, SOUTH AMERICA, 2017 - 2030
- Figure 166:
- VALUE SHARE OF GARLIC SEED BY BREEDING TECHNOLOGY, %, SOUTH AMERICA, 2023 AND 2030
- Figure 167:
- VOLUME OF ONION SEED, METRIC TON, SOUTH AMERICA, 2017 - 2030
- Figure 168:
- VALUE OF ONION SEED, USD, SOUTH AMERICA, 2017 - 2030
- Figure 169:
- VALUE SHARE OF ONION SEED BY BREEDING TECHNOLOGY, %, SOUTH AMERICA, 2023 AND 2030
- Figure 170:
- VOLUME OF POTATO SEED, METRIC TON, SOUTH AMERICA, 2017 - 2030
- Figure 171:
- VALUE OF POTATO SEED, USD, SOUTH AMERICA, 2017 - 2030
- Figure 172:
- VALUE SHARE OF POTATO SEED BY BREEDING TECHNOLOGY, %, SOUTH AMERICA, 2023 AND 2030
- Figure 173:
- VOLUME OF OTHER ROOTS & BULBS SEED, METRIC TON, SOUTH AMERICA, 2017 - 2030
- Figure 174:
- VALUE OF OTHER ROOTS & BULBS SEED, USD, SOUTH AMERICA, 2017 - 2030
- Figure 175:
- VALUE SHARE OF OTHER ROOTS & BULBS SEED BY BREEDING TECHNOLOGY, %, SOUTH AMERICA, 2023 AND 2030
- Figure 176:
- VOLUME OF SEEDS BY CROP CATEGORIES, METRIC TON, SOUTH AMERICA, 2017 - 2030
- Figure 177:
- VALUE OF SEEDS BY CROP CATEGORIES, USD, SOUTH AMERICA, 2017 - 2030
- Figure 178:
- VOLUME SHARE OF SEEDS BY CROP CATEGORIES, %, SOUTH AMERICA, 2017 VS 2023 VS 2030
- Figure 179:
- VALUE SHARE OF SEEDS BY CROP CATEGORIES, %, SOUTH AMERICA, 2017 VS 2023 VS 2030
- Figure 180:
- VOLUME OF CHILLI SEED, METRIC TON, SOUTH AMERICA, 2017 - 2030
- Figure 181:
- VALUE OF CHILLI SEED, USD, SOUTH AMERICA, 2017 - 2030
- Figure 182:
- VALUE SHARE OF CHILLI SEED BY BREEDING TECHNOLOGY, %, SOUTH AMERICA, 2023 AND 2030
- Figure 183:
- VOLUME OF EGGPLANT SEED, METRIC TON, SOUTH AMERICA, 2017 - 2030
- Figure 184:
- VALUE OF EGGPLANT SEED, USD, SOUTH AMERICA, 2017 - 2030
- Figure 185:
- VALUE SHARE OF EGGPLANT SEED BY BREEDING TECHNOLOGY, %, SOUTH AMERICA, 2023 AND 2030
- Figure 186:
- VOLUME OF TOMATO SEED, METRIC TON, SOUTH AMERICA, 2017 - 2030
- Figure 187:
- VALUE OF TOMATO SEED, USD, SOUTH AMERICA, 2017 - 2030
- Figure 188:
- VALUE SHARE OF TOMATO SEED BY BREEDING TECHNOLOGY, %, SOUTH AMERICA, 2023 AND 2030
- Figure 189:
- VOLUME OF OTHER SOLANACEAE SEED, METRIC TON, SOUTH AMERICA, 2017 - 2030
- Figure 190:
- VALUE OF OTHER SOLANACEAE SEED, USD, SOUTH AMERICA, 2017 - 2030
- Figure 191:
- VALUE SHARE OF OTHER SOLANACEAE SEED BY BREEDING TECHNOLOGY, %, SOUTH AMERICA, 2023 AND 2030
- Figure 192:
- VOLUME OF SEEDS BY CROP CATEGORIES, METRIC TON, SOUTH AMERICA, 2017 - 2030
- Figure 193:
- VALUE OF SEEDS BY CROP CATEGORIES, USD, SOUTH AMERICA, 2017 - 2030
- Figure 194:
- VOLUME SHARE OF SEEDS BY CROP CATEGORIES, %, SOUTH AMERICA, 2017 VS 2023 VS 2030
- Figure 195:
- VALUE SHARE OF SEEDS BY CROP CATEGORIES, %, SOUTH AMERICA, 2017 VS 2023 VS 2030
- Figure 196:
- VOLUME OF ASPARAGUS SEED, METRIC TON, SOUTH AMERICA, 2017 - 2030
- Figure 197:
- VALUE OF ASPARAGUS SEED, USD, SOUTH AMERICA, 2017 - 2030
- Figure 198:
- VALUE SHARE OF ASPARAGUS SEED BY BREEDING TECHNOLOGY, %, SOUTH AMERICA, 2023 AND 2030
- Figure 199:
- VOLUME OF LETTUCE SEED, METRIC TON, SOUTH AMERICA, 2017 - 2030
- Figure 200:
- VALUE OF LETTUCE SEED, USD, SOUTH AMERICA, 2017 - 2030
- Figure 201:
- VALUE SHARE OF LETTUCE SEED BY BREEDING TECHNOLOGY, %, SOUTH AMERICA, 2023 AND 2030
- Figure 202:
- VOLUME OF OKRA SEED, METRIC TON, SOUTH AMERICA, 2017 - 2030
- Figure 203:
- VALUE OF OKRA SEED, USD, SOUTH AMERICA, 2017 - 2030
- Figure 204:
- VALUE SHARE OF OKRA SEED BY BREEDING TECHNOLOGY, %, SOUTH AMERICA, 2023 AND 2030
- Figure 205:
- VOLUME OF PEAS SEED, METRIC TON, SOUTH AMERICA, 2017 - 2030
- Figure 206:
- VALUE OF PEAS SEED, USD, SOUTH AMERICA, 2017 - 2030
- Figure 207:
- VALUE SHARE OF PEAS SEED BY BREEDING TECHNOLOGY, %, SOUTH AMERICA, 2023 AND 2030
- Figure 208:
- VOLUME OF SPINACH SEED, METRIC TON, SOUTH AMERICA, 2017 - 2030
- Figure 209:
- VALUE OF SPINACH SEED, USD, SOUTH AMERICA, 2017 - 2030
- Figure 210:
- VALUE SHARE OF SPINACH SEED BY BREEDING TECHNOLOGY, %, SOUTH AMERICA, 2023 AND 2030
- Figure 211:
- VOLUME OF OTHER UNCLASSIFIED VEGETABLES SEED, METRIC TON, SOUTH AMERICA, 2017 - 2030
- Figure 212:
- VALUE OF OTHER UNCLASSIFIED VEGETABLES SEED, USD, SOUTH AMERICA, 2017 - 2030
- Figure 213:
- VALUE SHARE OF OTHER UNCLASSIFIED VEGETABLES SEED BY BREEDING TECHNOLOGY, %, SOUTH AMERICA, 2023 AND 2030
- Figure 214:
- VOLUME OF SEEDS BY COUNTRY, METRIC TON, SOUTH AMERICA, 2017 - 2030
- Figure 215:
- VALUE OF SEEDS BY COUNTRY, USD, SOUTH AMERICA, 2017 - 2030
- Figure 216:
- VOLUME SHARE OF SEEDS BY COUNTRY, %, SOUTH AMERICA, 2017 VS 2023 VS 2030
- Figure 217:
- VALUE SHARE OF SEEDS BY COUNTRY, %, SOUTH AMERICA, 2017 VS 2023 VS 2030
- Figure 218:
- VOLUME OF ARGENTINA SEEDS, METRIC TON, SOUTH AMERICA, 2017 - 2030
- Figure 219:
- VALUE OF ARGENTINA SEEDS, USD, SOUTH AMERICA, 2017 - 2030
- Figure 220:
- VALUE SHARE OF ARGENTINA SEEDS BY CROP, %, SOUTH AMERICA, 2023 AND 2030
- Figure 221:
- VOLUME OF BRAZIL SEEDS, METRIC TON, SOUTH AMERICA, 2017 - 2030
- Figure 222:
- VALUE OF BRAZIL SEEDS, USD, SOUTH AMERICA, 2017 - 2030
- Figure 223:
- VALUE SHARE OF BRAZIL SEEDS BY CROP, %, SOUTH AMERICA, 2023 AND 2030
- Figure 224:
- VOLUME OF REST OF SOUTH AMERICA SEEDS, METRIC TON, SOUTH AMERICA, 2017 - 2030
- Figure 225:
- VALUE OF REST OF SOUTH AMERICA SEEDS, USD, SOUTH AMERICA, 2017 - 2030
- Figure 226:
- VALUE SHARE OF REST OF SOUTH AMERICA SEEDS BY CROP, %, SOUTH AMERICA, 2023 AND 2030
- Figure 227:
- MOST ACTIVE COMPANIES BY NUMBER OF STRATEGIC MOVES, COUNT, SOUTH AMERICA, 2017-2023
- Figure 228:
- MOST ADOPTED STRATEGIES, COUNT, SOUTH AMERICA, 2017-2023
- Figure 229:
- VALUE SHARE OF MAJOR PLAYERS, %, SOUTH AMERICA
South America Seed Industry Segmentation
Hybrids, Open Pollinated Varieties & Hybrid Derivatives are covered as segments by Breeding Technology. Open Field, Protected Cultivation are covered as segments by Cultivation Mechanism. Row Crops, Vegetables are covered as segments by Crop Type. Argentina, Brazil are covered as segments by Country.| Breeding Technology | Hybrids | Non-Transgenic Hybrids | ||
| Transgenic Hybrids | Herbicide Tolerant Hybrids | |||
| Insect Resistant Hybrids | ||||
| Other Traits | ||||
| Open Pollinated Varieties & Hybrid Derivatives | ||||
| Cultivation Mechanism | Open Field | |||
| Protected Cultivation | ||||
| Crop Type | Row Crops | Fiber Crops | Cotton | |
| Other Fiber Crops | ||||
| Forage Crops | Alfalfa | |||
| Forage Corn | ||||
| Forage Sorghum | ||||
| Other Forage Crops | ||||
| Grains & Cereals | Corn | |||
| Rice | ||||
| Sorghum | ||||
| Wheat | ||||
| Other Grains & Cereals | ||||
| Oilseeds | Canola, Rapeseed & Mustard | |||
| Soybean | ||||
| Sunflower | ||||
| Other Oilseeds | ||||
| Pulses | Pulses | |||
| Vegetables | Brassicas | Cabbage | ||
| Carrot | ||||
| Cauliflower & Broccoli | ||||
| Other Brassicas | ||||
| Cucurbits | Cucumber & Gherkin | |||
| Pumpkin & Squash | ||||
| Other Cucurbits | ||||
| Roots & Bulbs | Garlic | |||
| Onion | ||||
| Potato | ||||
| Other Roots & Bulbs | ||||
| Solanaceae | Chilli | |||
| Eggplant | ||||
| Tomato | ||||
| Other Solanaceae | ||||
| Unclassified Vegetables | Asparagus | |||
| Lettuce | ||||
| Okra | ||||
| Peas | ||||
| Spinach | ||||
| Other Unclassified Vegetables | ||||
| Country | Argentina | |||
| Brazil | ||||
| Rest of South America | ||||
Need A Different Region or Segment?
Customize Now
Market Definition
- Commercial Seed - For the purpose of this study, only commercial seeds have been included as part of the scope. Farm-saved Seeds, which are not commercially labeled are excluded from scope, even though a minor percentage of farm-saved seeds are exchanged commercially among farmers. The scope also excludes vegetatively reproduced crops and plant parts, which may be commercially sold in the market.
- Crop Acreage - While calculating the acreage under different crops, the Gross Cropped Area has been considered. Also known as Area Harvested, according to the Food & Agricultural Organization (FAO), this includes the total area cultivated under a particular crop across seasons.
- Seed Replacement Rate - Seed Replacement Rate is the percentage of area sown out of the total area of crop planted in the season by using certified/quality seeds other than the farm-saved seed.
- Protected Cultivation - The report defines protected cultivation as the process of growing crops in a controlled environment. This includes greenhouses, glasshouses, hydroponics, aeroponics, or any other cultivation system that protects the crop against any abiotic stress. However, cultivation in an open field using plastic mulch is excluded from this definition and is included under open field.
| Keyword | Definition |
|---|---|
| Row Crops | These are usually the field crops which include the different crop categories like grains & cereals, oilseeds, fiber crops like cotton, pulses, and forage crops. |
| Solanaceae | These are the family of flowering plants which includes tomato, chili, eggplants, and other crops. |
| Cucurbits | It represents a gourd family consisting of about 965 species in around 95 genera. The major crops considered for this study include Cucumber & Gherkin, Pumpkin and squash, and other crops. |
| Brassicas | It is a genus of plants in the cabbage and mustard family. It includes crops such as carrots, cabbage, cauliflower & broccoli. |
| Roots & Bulbs | The roots and bulbs segment includes onion, garlic, potato, and other crops. |
| Unclassified Vegetables | This segment in the report includes the crops which don’t belong to any of the above-mentioned categories. These include crops such as okra, asparagus, lettuce, peas, spinach, and others. |
| Hybrid Seed | It is the first generation of the seed produced by controlling cross-pollination and by combining two or more varieties, or species. |
| Transgenic Seed | It is a seed that is genetically modified to contain certain desirable input and/or output traits. |
| Non-Transgenic Seed | The seed produced through cross-pollination without any genetic modification. |
| Open-Pollinated Varieties & Hybrid Derivatives | Open-pollinated varieties produce seeds true to type as they cross-pollinate only with other plants of the same variety. |
| Other Solanaceae | The crops considered under other Solanaceae include bell peppers and other different peppers based on the locality of the respective countries. |
| Other Brassicaceae | The crops considered under other brassicas include radishes, turnips, Brussels sprouts, and kale. |
| Other Roots & Bulbs | The crops considered under other roots & bulbs include Sweet Potatoes and cassava. |
| Other Cucurbits | The crops considered under other cucurbits include gourds (bottle gourd, bitter gourd, ridge gourd, Snake gourd, and others). |
| Other Grains & Cereals | The crops considered under other grains & cereals include Barley, Buck Wheat, Canary Seed, Triticale, Oats, Millets, and Rye. |
| Other Fibre Crops | The crops considered under other fibers include Hemp, Jute, Agave fibers, Flax, Kenaf, Ramie, Abaca, Sisal, and Kapok. |
| Other Oilseeds | The crops considered under other oilseeds include Ground nut, Hempseed, Mustard seed, Castor seeds, safflower seeds, Sesame seeds, and Linseeds. |
| Other Forage Crops | The crops considered under other forages include Napier grass, Oat grass, White clover, Ryegrass, and Timothy. Other forage crops were considered based on the locality of the respective countries. |
| Pulses | Pigeon peas, Lentils, Broad and horse beans, Vetches, Chickpeas, Cowpeas, Lupins, and Bambara beans are the crops considered under pulses. |
| Other Unclassified Vegetables | The crops considered under other unclassified vegetables include Artichokes, Cassava Leaves, Leeks, Chicory, and String beans. |
Need More Details on Market Definition?
Ask a Question
Research Methodology
Mordor Intelligence follows a four-step methodology in all our reports.
- Step-1: IDENTIFY KEY VARIABLES: In order to build a robust forecasting methodology, the variables and factors identified in Step-1 are tested against available historical market numbers. Through an iterative process, the variables required for market forecast are set and the model is built on the basis of these variables.
- Step-2: Build a Market Model: Market-size estimations for the forecast years are in nominal terms. Inflation is not a part of the pricing, and the average selling price (ASP) is kept constant throughout the forecast period.
- Step-3: Validate and Finalize: In this important step, all market numbers, variables and analyst calls are validated through an extensive network of primary research experts from the market studied. The respondents are selected across levels and functions to generate a holistic picture of the market studied.
- Step-4: Research Outputs: Syndicated Reports, Custom Consulting Assignments, Databases, and Subscription Platforms

Get More Details On Research Methodology
Download PDF


