
Market Overview
| Study Period | 2021 - 2031 |
|---|---|
| Forecast Data Period | 2026 - 2031 |
| Base Year Market Size (2025) | USD 3.03 Billion |
| Market Size (2026) | USD 3.35 Billion |
| Market Size (2031) | USD 5.48 Billion |
| Growth Rate (2026 - 2031) | 10.39 % |
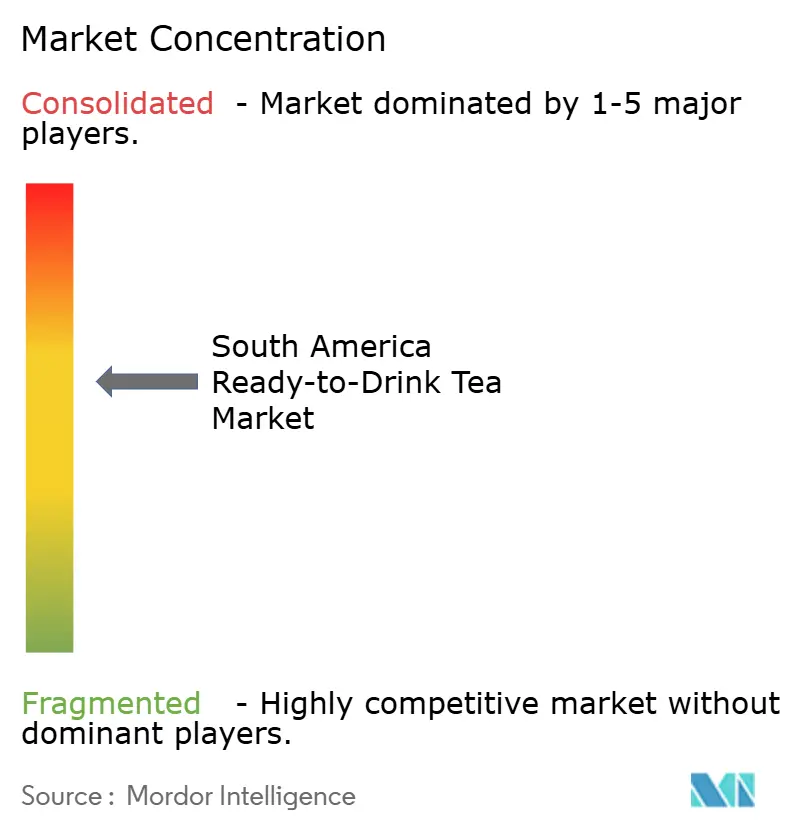
| Market Concentration | Medium |
Major Players *Disclaimer: Major Players sorted in no particular order Image © Mordor Intelligence. Reuse requires attribution under CC BY 4.0. | |
South America Ready-to-Drink Tea Market Analysis by Mordor Intelligence
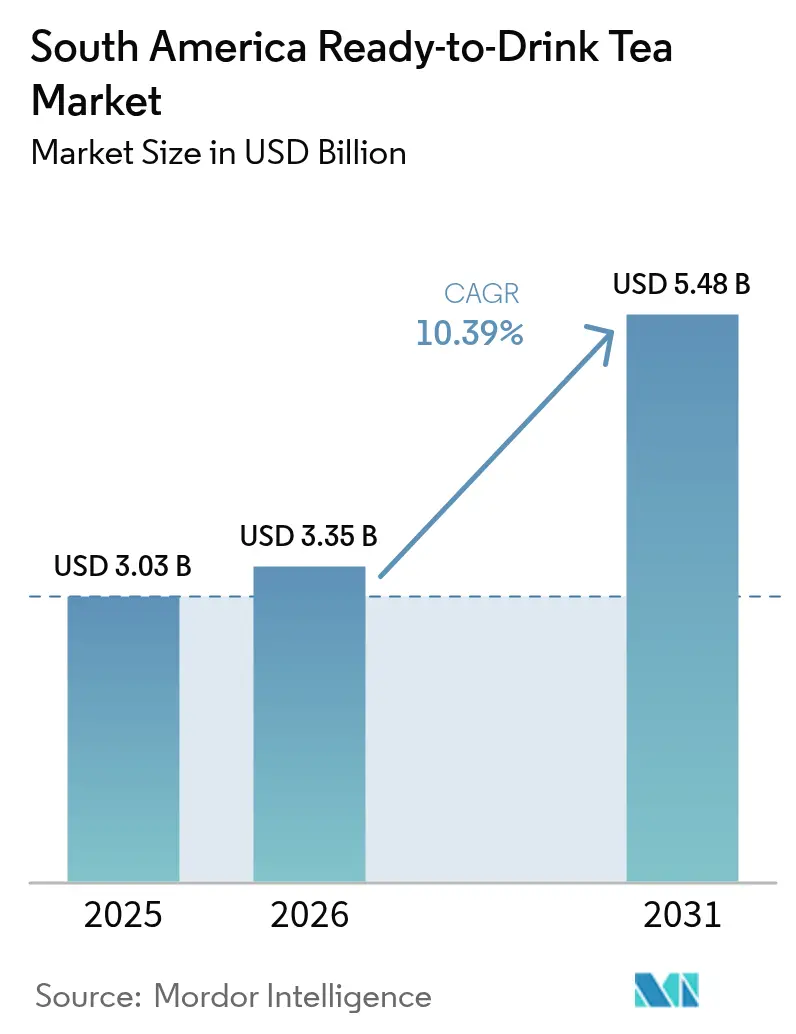
The South American ready-to-drink (RTD) tea market size was valued at USD 3.03 billion in 2025 and estimated to grow from USD 3.35 billion in 2026 to reach USD 5.48 billion by 2031, at a CAGR of 10.39% during the forecast period (2026-2031). The market is experiencing significant growth, driven by increasing consumer demand for beverages with lower sugar content, broader distribution through modern trade channels, and ongoing product innovation. Urban professionals with hectic schedules are increasingly replacing carbonated soft drinks with RTD teas that offer both convenience and functional benefits. Additionally, premium RTD tea lines that emphasize their antioxidant properties are contributing to higher profit margins for brands. Sustainability initiatives are also playing a key role, as companies transition to lightweight aluminum and recycled-content PET packaging. This shift not only aligns with environmental goals but also enhances brand credibility, allowing for the justification of price premiums. Furthermore, the rise of digital retail platforms and direct-to-consumer models is expanding market accessibility, particularly for niche botanical blends that are not yet widely available in physical retail stores.
Key Report Takeaways
- By product type, black tea held a 44.62% revenue share in 2025, while herbal tea is forecast to expand at a 10.34% CAGR by 2031.
- By category, sweetened variants accounted for 79.33% share of the South American RTD tea market in 2025; unsweetened products are advancing at a 13.18% CAGR through 2031.
- By packaging, bottles captured a 66.45% market share in 2025; cans are projected to grow at 9.09% CAGR between 2026-2031.
- By ingredient source, conventional sourcing dominated with a 91.65% share in 2025; organic variants are forecast to rise at a 11.86% CAGR to 2031.
- By distribution channel, supermarkets and hypermarkets commanded a 64.58% share in 2025, whereas online retail is recording an 18.07% CAGR over 2026-2031.
- By geography Brazil led with 62.60% of the South American RTD tea market share in 2025; Colombia is projected to post the fastest CAGR of 11.31% through 2031.
Note: Market size and forecast figures in this report are generated using Mordor Intelligence’s proprietary estimation framework, updated with the latest available data and insights as of 2026.
Market Trends and Insights
Drivers Impact Analysis of South America Ready-to-Drink Tea Market*
| Drivers | (~) % Impact on CAGR Forecast | Geographic Relevance | Impact Timeline |
|---|---|---|---|
| Rising Demand for Low-Sugar Refreshments Amid Obesity Concerns inThe Region | +1.80% | Brazil, Colombia, Argentina | Medium term (2-4 years) |
| Expansion of Hybrid Tea-Fruit RTD Lineups Targeting Millennials | +1.40% | Brazil, Colombia, Chile | Short term (≤ 2 years) |
| Shift Toward Sustainable PET & Aluminum Packaging Driving Premiumization | +1.10% | Brazil, Chile, Colombia | Medium term (2-4 years) |
| Health-Conscious Consumers Inclined Towards Low-Calorie, Antioxidant-Rich Beverages, Boosts Demand for RTD Tea. | +0.80% | Brazil, Argentina, Colombia | Long term (≥ 4 years) |
| Surging Popularity of Natural and Herbal Ingredients Propel The Demand For Functional RTD Teas. | +0.70% | Colombia, Brazil, Peru | Medium term (2-4 years) |
| Shift Toward Natural and Organic Products Driving Market Growth | +0.60% | Chile, Brazil, Argentina | Long term (≥ 4 years) |
| Source: Mordor Intelligence | |||
Rising Demand for Low-Sugar Refreshments Amid Obesity Concerns in The Region
The escalating obesity rates across South America are fundamentally reshaping beverage consumption patterns, with RTD tea emerging as a primary beneficiary of the shift away from high-sugar carbonated drinks. The World Obesity Federation projects that by 2044, 48% of Brazilian adults will face obesity, while another 27% will live with overweight [1]. This growing health concern has prompted significant changes in consumer behavior, particularly as awareness about the health risks associated with excessive sugar consumption increases. The Pan American Health Organization (PAHO) actively promotes sugar reduction initiatives across the region, further encouraging consumers to seek healthier alternatives. Urban professionals aged 25-40 are driving this shift, opting for lower-sugar beverages 2.7 times more than previous generations, as they prioritize health and wellness in their daily choices. Public health campaigns, changing consumer preferences, and innovative product development are collectively propelling the growth of low-sugar RTD tea variants. Manufacturers are leveraging premium positioning to manage higher ingredient costs while maintaining their profit margins, ensuring that these healthier options remain accessible and appealing to the growing health-conscious demographic.
Expansion of Hybrid Tea-Fruit RTD Lineups Targeting Millennials
The market is growing rapidly, driven by increasing demand for hybrid tea-fruit beverages among millennials. This health-conscious demographic has pushed manufacturers to expand their product portfolios. The Food and Agriculture Organization (FAO) reports steady growth in tea consumption across South America, with a preference for flavored and functional beverages. The Brazilian Tea Association highlights the rising popularity of hybrid tea-fruit RTD products due to their health benefits and convenience. Government initiatives are further supporting this trend. For example, Chile’s Ministry of Health has enforced sugar reduction regulations, spurring the development of low-sugar hybrid tea-fruit RTD options. Similarly, Argentina’s National Institute of Yerba Mate (INYM) reports increased production of yerba mate-based RTD beverages, often infused with fruit flavors to appeal to millennials. These shifts reflect growing consumer demand for beverages that balance taste and health benefits, positioning hybrid tea-fruit RTD products as a key driver in the South American RTD tea market. The World Health Organization (WHO) has also emphasized reducing sugar intake to combat obesity, prompting manufacturers to innovate with natural sweeteners and functional ingredients like antioxidants and vitamins. The hybrid tea-fruit RTD segment is expected to play a pivotal role in driving the South America RTD tea market during the forecast period.
Shift Toward Sustainable PET & Aluminum Packaging Driving Premiumization
The shift toward sustainable PET and aluminum packaging is a significant driver of the South America Ready-to-Drink (RTD) Tea Market. Consumers are increasingly prioritizing environmentally friendly packaging solutions, which has led manufacturers to adopt recyclable and sustainable materials like PET and aluminum. For instance, according to the Brazilian Association of the Soft Drinks and Non-Alcoholic Beverages Industry (ABIR), the adoption of PET bottles with higher recycling rates has surged in recent years, aligning with the region's sustainability goals. Additionally, government initiatives, such as Colombia's Extended Producer Responsibility (EPR) program, mandate manufacturers to ensure the recyclability of their packaging materials, further encouraging the use of sustainable options. This trend not only supports environmental objectives but also aligns with the premiumization of RTD tea products, as consumers associate sustainable packaging with higher-quality offerings. The growing emphasis on sustainability is expected to continue driving innovation in packaging within the forecast period (2024-2029).
Health-Conscious Consumers Inclined Towards Low-Calorie, Antioxidant-Rich Beverages, Boosts Demand for RTD Tea
The South America ready-to-drink (RTD) tea market is experiencing significant growth, driven by the increasing preference of health-conscious consumers for low-calorie and antioxidant-rich beverages. According to the National Institute of Health Report, the prevalence of obesity and related health issues in South America has led to a growing awareness of healthier dietary choices [2]. RTD tea, seen as a low-calorie alternative to sugary drinks, is benefiting from this shift. The Food and Agriculture Organization (FAO) notes growing tea consumption in the region, supported by its antioxidant properties and weight management benefits. Brazil, a major market, has witnessed a surge in RTD tea offerings, with manufacturers introducing new flavors and formulations to meet demand. Government campaigns in countries like Argentina and Chile, promoting reduced sugar intake, are further boosting the market. This trend is expected to sustain growth during the forecast period as health-conscious purchasing continues to rise.
Restraints Impact Analysis of South America Ready-to-Drink Tea Market*
| Restraint | (~) % Impact on CAGR Forecast | Geographic Relevance | Impact Timeline |
|---|---|---|---|
| Intensifying Competition from RTD Coffee and Functional Beverages | -0.90% | Brazil, Colombia, Chile | Medium term (2-4 years) |
| Inconsistent Cold Chain Infrastructure Challenges the Distribution and Shelf-Life of RTD Tea Products | -0.70% | Peru, Colombia, Rest of South America | Short term (≤ 2 years) |
| High Import Tariffs on Specialty Tea Extracts Elevating Production Costs | -0.50% | Brazil, Argentina, Colombia | Medium term (2-4 years) |
| High Costs Compared to Traditional Beverages Limiting Market Growth | -0.40% | Peru, Colombia, Rest of South America | Short term (≤ 2 years) |
| Source: Mordor Intelligence | |||
Intensifying Competition from RTD Coffee & Functional Beverages
The market faces significant restraint due to the intensifying competition from RTD coffee and functional beverages. These alternatives are gaining popularity among consumers due to their perceived health benefits, convenience, and innovative flavors. Functional beverages, in particular, are attracting health-conscious consumers by offering added nutrients, vitamins, and other functional ingredients. Similarly, RTD coffee is becoming a preferred choice for its energy-boosting properties and wide variety of options, including cold brews and specialty flavors. The increasing availability of these products in retail outlets, supermarkets, and online platforms further amplifies their reach and appeal, making it challenging for RTD tea to maintain its market share. Additionally, aggressive marketing strategies and promotional campaigns by RTD coffee and functional beverage brands are drawing consumer attention, creating a competitive environment. This growing competition is compelling RTD tea manufacturers to innovate and differentiate their offerings by introducing unique flavors, organic options, and health-focused formulations to retain and expand their consumer base. However, the challenge remains significant as the preference for RTD coffee and functional beverages continues to rise, driven by evolving consumer lifestyles and preferences.
Inconsistent Cold Chain Infrastructure Challenges the Distribution and Shelf-Life of RTD Tea Products
In South America, the RTD tea market faces significant challenges due to inconsistent cold chain infrastructure. The lack of a reliable and efficient cold chain system disrupts the distribution process, leading to delays and compromised product quality. RTD tea products, which require proper temperature control to maintain their freshness and shelf-life, are particularly vulnerable to such inefficiencies. This issue not only affects the overall supply chain but also impacts consumer satisfaction, as products may reach the market in suboptimal conditions. Furthermore, the fragmented nature of cold chain logistics in the region exacerbates the problem. Many areas lack adequate storage facilities and transportation systems equipped with temperature control mechanisms. This limitation increases the risk of spoilage during transit, resulting in financial losses for manufacturers and distributors. The situation is further complicated by high operational costs associated with maintaining cold chain infrastructure, which can deter smaller players from entering the market or expanding their operations. Addressing these challenges is crucial for the growth of the RTD tea market in South America. Investments in modern cold chain technologies and infrastructure, along with government support and private sector collaboration, could help mitigate these issues. By improving the efficiency and reliability of the cold chain system, stakeholders can ensure better product quality, reduce wastage, and enhance consumer trust in RTD tea products.
*Our forecasts treat driver/restraint impacts as directional, not additive. The impact forecasts reflect baseline growth, mix effects, and variable interactions.
South America Ready-to-Drink Tea Market Segment Analysis
By Product Type:
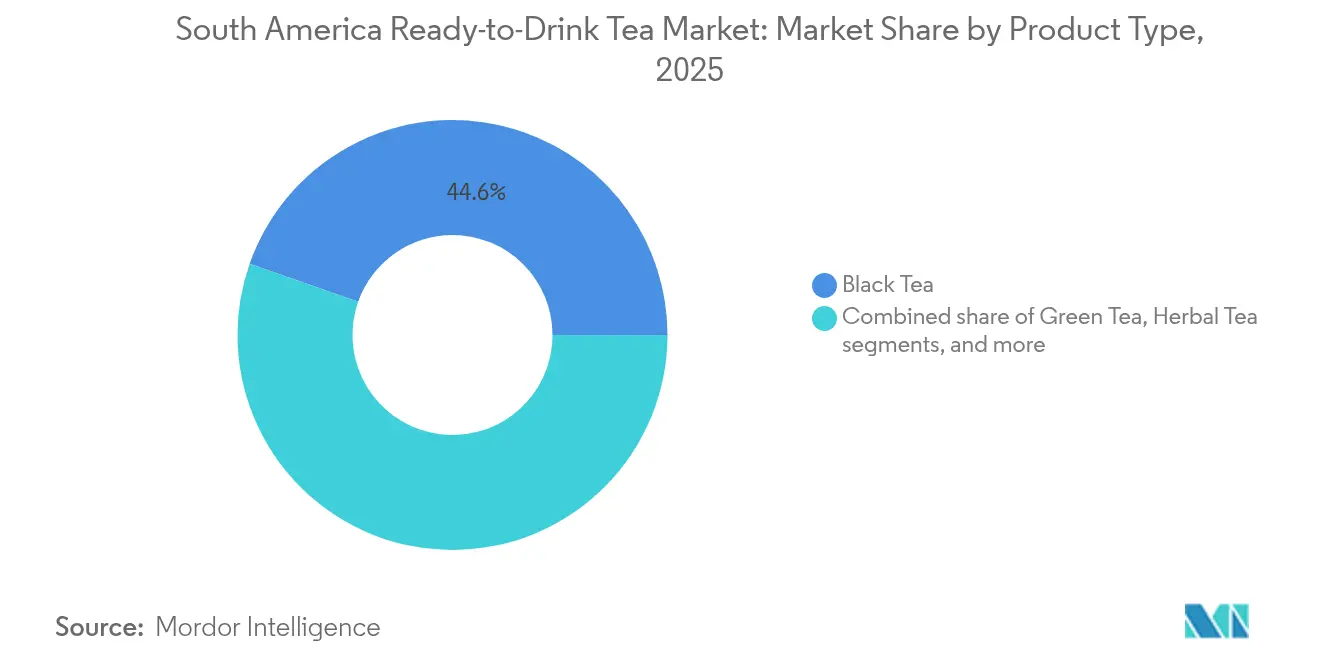
Black Tea Dominates, Herbal Tea AcceleratesIn 2025, black tea maintained its position as the most popular choice in South America's ready-to-drink (RTD) tea market, holding a significant 44.62% market share. Its widespread appeal comes from its versatility, as it pairs well with a variety of sweeteners and fruit flavors, making it a favorite among a broad range of consumers. Herbal tea, while currently occupying a smaller portion of the market, is growing at a much faster pace, with a projected compound annual growth rate (CAGR) of 10.34%. This rapid growth is largely driven by younger consumers who are actively seeking healthier beverage options. Many of these consumers are looking for alternatives to caffeine and are drawn to herbal teas for their functional benefits, such as promoting relaxation or boosting immunity. Green tea holds a middle position in the market, benefiting from its long-standing reputation as a healthy beverage rich in antioxidants. This health-focused image continues to attract consumers who are mindful of their well-being.
On the other hand, Oolong and White teas cater to smaller, niche audiences. Despite their limited production volumes, these teas are able to sustain higher price points due to their premium positioning and unique flavor profiles. One of the most notable trends in the South American RTD tea market is the rapid growth of the herbal tea segment. While its sales volumes have not yet reached the levels of black tea, the segment is expected to add significant value to the market. This growth highlights the increasing consumer interest in beverages that offer both health benefits and unique flavors, positioning herbal tea as a key driver of future market expansion.

By Category:
Unsweetened Variants Capture Health-Conscious SegmentIn 2025, sweetened ready-to-drink (RTD) tea holds an 79.33% market share, reflecting a strong cultural preference for sweet flavors and a shift from carbonated soft drinks. This dominance is driven by consumer demand for sweetened beverages, supported by extensive product availability, aggressive marketing, and innovation within the sweetened segment. The transition to sweetened RTD tea also aligns with a broader trend toward perceived healthier alternatives. Meanwhile, the unsweetened segment is gaining traction, with a projected 13.18% CAGR from 2026 to 2031, fueled by rising health awareness and global trends favoring reduced sugar intake.
Manufacturers in the sweetened category are adapting by introducing reduced-sugar variants to bridge the gap for consumers transitioning from full-sugar products. These strategies aim to retain a broad consumer base while addressing health concerns. Natural sweeteners like stevia, monk fruit, and erythritol are also gaining prominence, enabling brands to balance sweetness with health-conscious demands. The unsweetened segment's growth is particularly evident in premium markets and among affluent consumers, highlighting a link between income, education, and preference for unsweetened options. This segmentation allows manufacturers to implement price-tier strategies, capturing diverse consumer groups while aligning with the shift toward healthier choices.
By Packaging:
Bottles Lead, Cans Gain MomentumIn 2025, bottles dominate the RTD tea packaging landscape, capturing a commanding 66.45% market share. Designed with the on-the-go consumer in mind, bottles offer visibility, resealability, and precise portion control. Their visual appeal not only effectively conveys brand messages but also elevates them as premium choices, especially for natural and organic variants, where transparency is synonymous with quality. Bottles, by showcasing their contents, foster trust among consumers, a crucial factor in today's market that prioritizes authenticity and ingredient transparency. In response to sustainability demands, manufacturers are pioneering innovative PET formulations, incorporating 30-50% recycled content, thereby setting a new industry benchmark while retaining the functional benefits of plastic packaging.
On the other hand, cans are rapidly gaining traction, with projections indicating a robust 9.09% CAGR growth from 2026 to 2031. Their ascent is largely due to advantages such as enhanced recyclability, prolonged shelf life, and swift cooling capabilities. Cans resonate particularly well with environmentally conscious consumers, thanks to their high recyclability rates that align with global sustainability objectives. Moreover, cans excel in preserving the freshness and flavor of RTD tea, making them an attractive option for manufacturers looking to broaden their distribution and tap into varied markets. Their rapid cooling advantage further amplifies the consumer experience, especially in warmer regions where chilled beverages are sought after. Collectively, these attributes bolster the rising preference for cans in the RTD tea packaging arena.
By Ingredient Source:
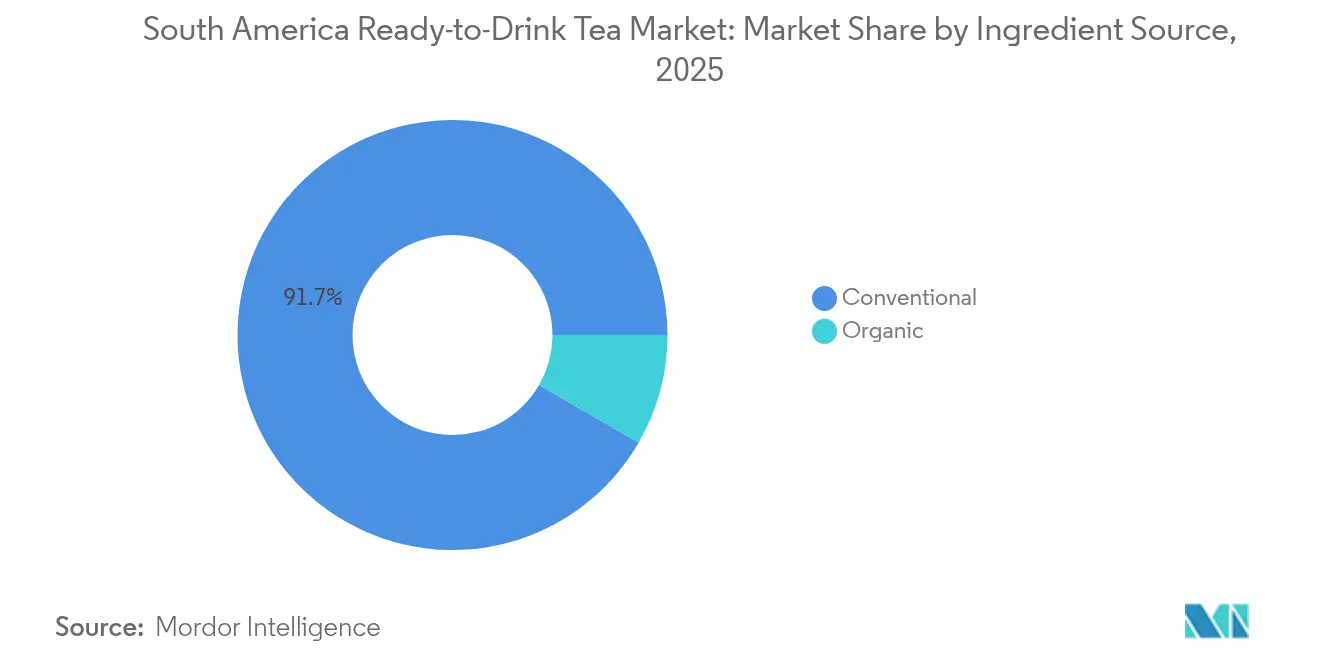
Organic Premium Captures Value GrowthIn 2025, conventional ingredient sourcing commands a dominant 91.65% share of the South American RTD tea market, underscoring mainstream consumers' price sensitivity and the region's limited organic tea production. The conventional segment's stronghold is further supported by its affordability, widespread availability, and established consumer trust in traditional formulations. However, the organic segment is on a transformative trajectory, boasting a robust 11.86% CAGR from 2026 to 2031.
Responding to this organic surge, the conventional segment isn't standing still. Manufacturers are adopting "clean label" strategies, spotlighting natural ingredients and minimal processing, albeit without full organic certification. This strategy births middle-ground products, addressing health concerns while keeping prices accessible. Additionally, conventional RTD tea products continue to innovate by incorporating functional ingredients, such as vitamins and antioxidants, to appeal to health-conscious consumers without significantly increasing costs. Notably, the organic trend is surging in premium retail channels and e-commerce, where in-depth product details can validate higher price tags. Meanwhile, conventional products maintain their dominance in mass-market retail outlets, leveraging their affordability and familiarity to retain a broad consumer base.
By Distribution Channel:
E-commerce Disrupts Traditional Retail DominanceIn 2025, supermarkets and hypermarkets hold 64.58% of the RTD tea market, driven by extensive refrigerated spaces, broad consumer reach, and effective promotions. These channels stock diverse RTD tea options, meeting varied consumer preferences. By utilizing economies of scale, they ensure competitive pricing and high product visibility, boosting sales. Their established trust and frequent promotions reinforce their dominance as the leading distribution channel. Convenience and grocery stores, meanwhile, cater to impulse purchases and immediate consumption, especially in urban areas. Their strategic locations in high-traffic zones make them accessible for quick buys.
Online retail is shaking up the distribution landscape, boasting a staggering growth rate of 18.07% CAGR from 2026 to 2031. Data from Data Reportal highlights Brazil's digital landscape: as of early 2024, the nation had 187.9 million internet users, translating to an 86.6% penetration rate . The rapid adoption of e-commerce platforms is driven by increasing internet accessibility, smartphone penetration, and the convenience of home delivery. Online channels also offer a broader product assortment and personalized recommendations, enhancing the shopping experience for consumers. This shift is fundamentally altering traditional distribution dynamics, as more consumers turn to online platforms for their RTD tea purchases.
Geography Analysis
Brazil Ready-to-Drink Tea Market
In 2025, Brazil holds a 62.60% share of the South America RTD tea market, driven by its large population, advanced retail infrastructure, and strong tea culture. The market benefits from robust domestic production and the presence of global beverage companies with extensive distribution networks. Urban consumers increasingly demand diverse flavors and healthier options, such as premium, low-calorie, and preservative-free products. E-commerce is a key growth driver, offering consumers convenient access to specialty RTD tea products. The rise in smartphone usage and internet connectivity has expanded online shopping, prompting brands to invest in digital marketing and direct-to-consumer channels. This shift enhances consumer convenience and provides companies with valuable behavioral insights.
Southern Cone and Colombia Ready-to-Drink Tea Market
Beyond Brazil, countries like Argentina, Chile, and Colombia are contributing to the RTD tea market's growth, albeit on a smaller scale. Urbanization, rising incomes, and health awareness drive demand in these markets. Argentina's tea culture, particularly its preference for yerba mate, presents opportunities for traditional flavor-based RTD tea products. Similarly, Chile and Colombia, projected to post the fastest CAGR of 11.31% through 2031, are seeing increased interest in organic and natural RTD tea options.
South America Ready-to-Drink Tea Market
The South America RTD tea market is poised for steady growth during the forecast period, supported by favorable demographics, expanding retail networks, and the growing role of e-commerce. The region's diverse consumer base and shifting preferences create opportunities for innovation and market expansion.
Regulatory Landscape
Regulation for RTD tea in South America is shaped by national food-safety authorities and beverage identity standards, with Brazil setting the main compliance baseline due to its market scale (62.60% share in 2025). In Brazil, ANVISA regulates packaged foods and beverages via a tiered pathway (authorization, notification, or communication) for marketing and regularization, and RDC 843/2024 together with Normative Instruction IN 281/2024 established a structured framework for how products are regularized with health authorities, effective from September 1, 2024.
Product formulation and labeling compliance remains central for RTD tea, particularly around permitted additives and sweetening claims. ANVISA maintains and updates lists and conditions for authorized food additives and processing aids for beverages, including updates through Normative Instruction IN 407/2025. In parallel, Brazil's MAPA defines identity and quality standards for non-alcoholic beverages, including RTD tea, via Ordinance 123/2021, with labeling disclosures required when sugars and sweeteners are used together. This affects how sweetened and reduced-sugar RTD tea products are positioned at shelf.
Value Chain Analysis
The RTD tea value chain in South America starts with tea leaf cultivation and primary processing, including regional supply from Argentina alongside imported inputs. It then moves to extraction and concentrate sourcing, blending and formulation, packaging conversion (PET and aluminum), beverage filling, and finally multi-channel distribution through modern trade, convenience, and e-commerce. Argentina provides a regional raw-material anchor for black tea, with Finlays Argentina operating four primary tea farms (about 2,000 hectares) and three factory sites in Misiones that can supply tea for extract-based beverage applications, while many specialty extracts and concentrates used in RTD formulations still enter the region via major import hubs such as the Port of Santos (Brazil) and Buenos Aires (Argentina).
Downstream, brand owners and bottlers (including multinational beverage groups and regional specialists) rely on co-packers, logistics providers, and local distribution partners to reach fragmented retail, particularly where refrigerated execution and cold chain coverage varies by country and within-state. Route-to-market capability and import management are strategic levers. For example, Lipton Teas and Infusions formalized a partnership with Chile-based Guital and Partners to manage local import, distribution, and brand repositioning operations starting July 1, 2025, underscoring the role of in-market partners for execution and compliance across modern trade and on-premise points.
Competitive Landscape
The South American RTD tea market demonstrates a moderate level of concentration. Multinational beverage corporations, such as Coca-Cola and PepsiCo, dominate the market, supported by their extensive distribution networks and robust portfolio strategies. These established players maintain their dominance by leveraging economies of scale, brand equity, and strategic partnerships, ensuring widespread availability and consumer loyalty across the region.
Despite the stronghold of these global giants, the market is witnessing the emergence of regional specialists and premium niche brands. These smaller players are carving out their space by targeting specific consumer segments with innovative formulations, such as organic and functional RTD teas, and by emphasizing unique brand positioning. Their focus on health-conscious and sustainability-driven consumers has allowed them to gain traction in a competitive environment. Additionally, these brands are capitalizing on local flavors and cultural preferences, which resonate strongly with South American consumers, further differentiating themselves from larger competitors.
The competitive dynamics in the South American RTD tea market are evolving as manufacturers shift their strategies to achieve differentiation. Companies are increasingly investing in ingredient innovation, such as the inclusion of adaptogens and botanicals, to cater to the growing demand for functional beverages. Sustainability initiatives, including eco-friendly packaging and ethical sourcing, are becoming critical factors in brand positioning. Furthermore, manufacturers are adopting channel-specific strategies, such as expanding their presence in e-commerce and convenience stores, to enhance accessibility and cater to changing consumer purchasing behaviors.
South America Ready-to-Drink Tea Industry Leaders
-
The Coca-Cola Company
-
PepsiCo Inc
-
Nestlé S.A.
-
Keurig Dr Pepper
-
Kirin Holdings Co., Ltd.
- *Disclaimer: Major Players sorted in no particular order
South America Ready-to-Drink Tea Market Companies Covered in this Report
- The Coca-Cola Company
- PepsiCo, Inc
- Keurig Dr Pepper Inc.
- AriZona Beverages USA LLC
- Ito En, Ltd.
- Nestle S.A.
- Danone S.A.
- Unilever PLC
- Kirin Holdings Co., Ltd.
- Monster Beverage Corporation
- Ajinomoto Co., Inc.
- Suntory Beverage & Food Ltd.
- Grupo Aje
- Organique Energeticos Naturais Ltda.
- Bigelow Tea Company
- Suntory Beverage & Food Ltd.
- Compania de Alimentos Fargo SA
- Mega Alimentos S.A.
- Tata Consumer Products Limited
- Santa Catarina Alimentos Ltda
Market Opportunities and Future Outlook
Reformulation and portfolio tiering around sugar reduction is a clear whitespace. Sweetened products still accounted for 79.33% of RTD tea sales in 2025, while health-led alternatives are gaining shelf space through reduced-sugar and unsweetened lines. This is reinforced by regional public-health pressure on sugar intake, including PAHO-led initiatives, alongside country actions that have pushed manufacturers to accelerate low-sugar development. Manufacturers are also using functional botanicals, hybrid tea-fruit blends, and cleaner-label positioning to support premiumization.
Manufacturing and packaging modernization is also expanding practical levers for RTD tea, particularly for bottlers optimizing multi-category lines for cost and sustainability. In April 2026, BNDES approved financing for Coca-Cola (Uberlandia Refrescos) to install a fully digitized PET filling line at the Alexandre Biagi Industrial Complex, with targeted reductions in water usage and operating costs. In May 2026, Coca-Cola FEMSA disclosed investments into a major distribution center in Argentina and a local can line in Uruguay, supporting regional logistics resilience and can availability. These actions align with recyclable packaging formats and support wider RTD tea distribution beyond core metros, including online fulfillment.
Recent Industry Developments in South America Ready-to-Drink Tea Market
- June 2026: Leao Alimentos e Bebidas (The Coca-Cola Company) announced an R$100 million investment cycle through 2030 to modernize facilities and expand capacity. The program directs most spending to equipment upgrades, supporting higher efficiency and throughput for cold tea and related non-alcoholic beverage lines in Brazil.
- April 2026: Leao Alimentos e Bebidas implemented industrial automation and microbiological processing technologies at plants in Parana to support growth in functional cold tea beverages. The upgrade strengthens manufacturing consistency and helps scale formulations that depend on tighter process control for quality and shelf-life.
- November 2024: PepsiCo and Unilever extended their partnership for Lipton ready-to-drink tea to enhance global reach, with emphasis on expanding distribution in South American markets. The move reinforces route-to-market strength for Lipton in modern trade and supports broader portfolio rollout across key South American geographies.
South America Ready-to-Drink Tea Market Report Scope and Research Methodology
Market Definition and Coverage
This market covers ready-to-drink tea beverages sold for immediate consumption across South America, measured in value terms in USD. It includes products sold through retail and online channels, across major countries in the region.
Scope exclusions: We exclude loose tea, tea bags, and concentrates that require brewing or dilution before drinking.
Segments Covered in This Report
- By Type
- Black Tea
- Green Tea
- Herbal Tea
- Fruit & Flavored Tea
- Oolong Tea
- Decaffeinated Tea
- Others
- By Category
- Sweetened
- Unsweetened
- By Packaging
- Bottles
- Cans
- Others
- By Ingredient Source
- Conventional
- Organic
- By Distribution Channel
- Supermarkets & Hypermarkets
- Convenience/Grocery Stores
- Online Retail Stores
- Other Distribution Channels
- By Geography
- Brazil
- Argentina
- Chile
- Colombia
- Peru
- Rest of South America
Data Sources, Market Sizing, and Validation
Desk Research
Desk research was used to set the outside boundaries of demand and to make sure the market model is grounded in observable signals. We leaned on public statistics and reference sources such as UN Comtrade for trade flows, FAOSTAT for agricultural supply context, World Bank and IMF macro indicators for income and inflation trends, and national statistics offices in key South American countries for retail and price series where available.
To translate the broader beverage context into RTD tea assumptions, we also reviewed company annual reports and investor presentations, regulatory and labeling guidance published by local food safety agencies, and credible press coverage on pricing moves and pack changes. For cross-checks, we used paid subscriptions for company financials and news intelligence, plus a shipment-level import and export database to validate trade directionality and timing. The sources listed here are illustrative, and many additional public documents and datasets were reviewed for data collection, validation, and clarification.
Primary Interviews and Surveys
Our primary work covers South America through interviews and surveys with beverage manufacturers, distributors, retailers, and category specialists. Respondents help clarify country sales direction, pack-size preferences, channel mix, average selling prices, sugar claims, and launch activity. These discussions test secondary inputs, fill country-level gaps, and help reconcile differences before the final model is completed.
Distribution of primary research fieldwork respondents
| Company type | Respondent position |
|---|---|
| Top tier: 27% | CXOs: 20% |
| Mid tier: 48% | Functional/Unit leaders: 31% |
| Smaller Players: 25% | Managers: 49% |
Market-Sizing & Forecasting
Sizing starts with a top-down build where regional beverage spend and retail sell-through signals are reconstructed into an RTD tea demand pool, and then filtered using category presence and availability by country. Once the first cut is formed, we corroborate it with selective bottom-up approximations like sampled price per pack multiplied by estimated volumes by channel, along with supplier and distributor checks to adjust the totals when gaps show up.
A few inputs that matter most for this market are the split between sweetened and unsweetened RTD tea, pack formats (bottles versus cans), the pace of price increases driven by inflation and packaging costs, shifts toward lower sugar positioning, and how quickly online and convenience-led purchases are expanding in larger cities. When inputs vary by country, the model handles them separately first, and then results are rolled up to the South America total so that one large market does not accidentally distort the region.
For forecasting, scenario analysis is used so the base case remains easy to explain and can be stress-tested. Assumptions on pricing, channel mix, and category adoption are set using the range heard in interviews, and the trajectory is then checked against macro indicators like income growth and inflation so the forecast stays realistic.
Data Validation & Update Cycle
Validation is done in layers so we do not rely on a single dataset or one strong assumption. We compare the market totals against independent signals such as trade directionality, reported category performance commentary, and price realities seen in the market, and then anomalies are reviewed until a clear explanation is documented.
Before sign-off, the model goes through multi-step analyst checks, including variance checks across countries and a sanity review on implied per-capita consumption and price levels. If a major mismatch is found, respondents are re-contacted to confirm whether the issue is a timing change, a channel shift, or a packaging and pricing effect. Reports are refreshed annually, and material events (like tax changes, large price resets, or major launches) can trigger interim updates, followed by a final pre-delivery review to ensure clients get the latest view.
Mordor Intelligence's South America Ready to Drink Tea Market Sizing Compared With Other Published Estimates
Published market sizes for South America RTD tea do not always match because the boundaries are set differently and the conversion from volume to value is handled in different ways. Differences also come from the choice of base year, the inflation and currency timing used, and whether the estimate is anchored to retail sell-through signals or to broader beverage groupings.
Trade direction checks, pack-price tracking, and country-level channel mix validation are the evidence points that keep Mordor Intelligence's 2026 estimate tied to beverages that are actually sold as ready-to-drink tea, rather than adjacent drink categories. When other studies blend tea with nearby RTD beverages or apply a smoother price curve that does not reflect recent inflation, the headline value can move up or down even if the real consumption trend is similar.
Benchmark comparison
| Source | Market Size | Gaps in Research Methodology |
|---|---|---|
| Mordor Intelligence | USD 3.35 B (2026) | |
| Regional Consultancy A | USD 3.10 B (2023) | Uses an earlier base year and a longer study window, and the value appears to be anchored to a broader historical view that may not fully capture the more recent price resets and pack mix changes seen in several South American markets. |
| Industry Publisher B | USD 5.20 B (2031) | Presents a longer-dated endpoint value that is highly sensitive to assumed CAGR and pricing progression, and it is not always clear how sweetened versus unsweetened shifts and channel margin effects are treated in the value build. |
The spread across the three figures is mainly explained by the year chosen and the way pricing and scope boundaries are applied, not by a completely different view of consumer interest. By tying the model to observable pricing, pack, and channel signals, and then checking the totals with field feedback, the estimate stays traceable to clear steps that can be repeated and updated as conditions change.
Key Questions Answered in the Report
What is the current size of the South American RTD tea market?
The market is valued at USD 3.35 billion in 2026 and is expected to hit USD 5.48 billion by 2031.
Which country leads regional sales?
Brazil dominates with 62.60% of market sales, supported by a large consumer base and sophisticated retail infrastructure.
Which segment is growing fastest?
Unsweetened RTD teas are expanding at 13.18% CAGR, reflecting strong health-driven demand.
How significant is e-commerce in distribution?
Online retail is delivering an 18.07% CAGR and is critical for niche and premium brands that require deeper storytelling.