
Market Overview
| Study Period | 2020 - 2031 |
|---|---|
| Forecast Data Period | 2026 - 2031 |
| Base Year Market Size (2025) | USD 30.14 Billion |
| Market Size (2026) | USD 31.91 Billion |
| Market Size (2031) | USD 42.45 Billion |
| Growth Rate (2026 - 2031) | 5.87 % |
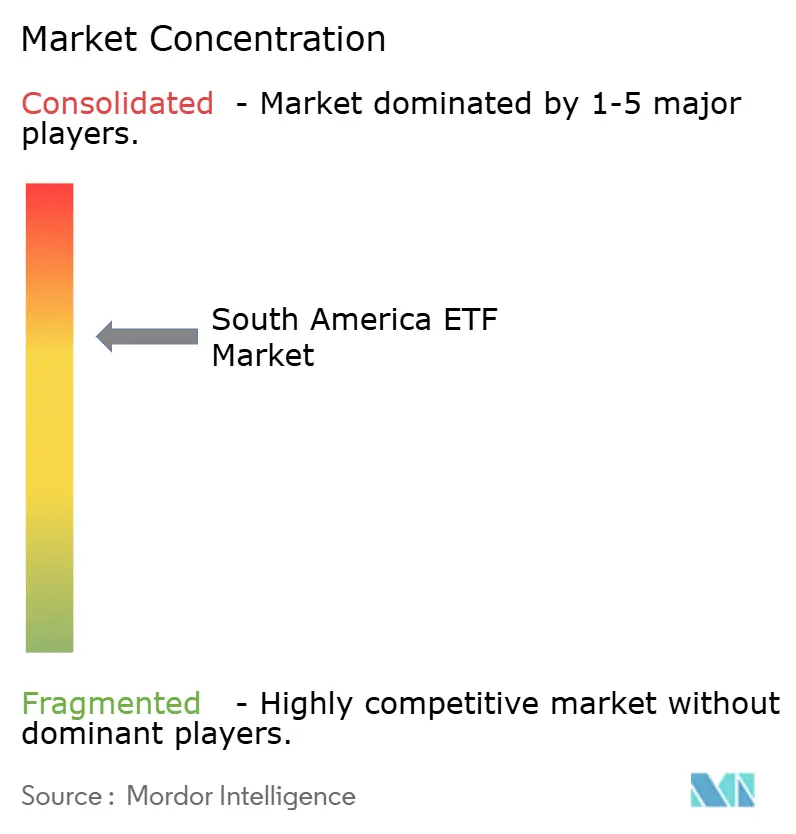
| Market Concentration | Medium |
Major Players *Disclaimer: Major Players sorted in no particular order Image © Mordor Intelligence. Reuse requires attribution under CC BY 4.0. | |
South America ETF Market Analysis by Mordor Intelligence
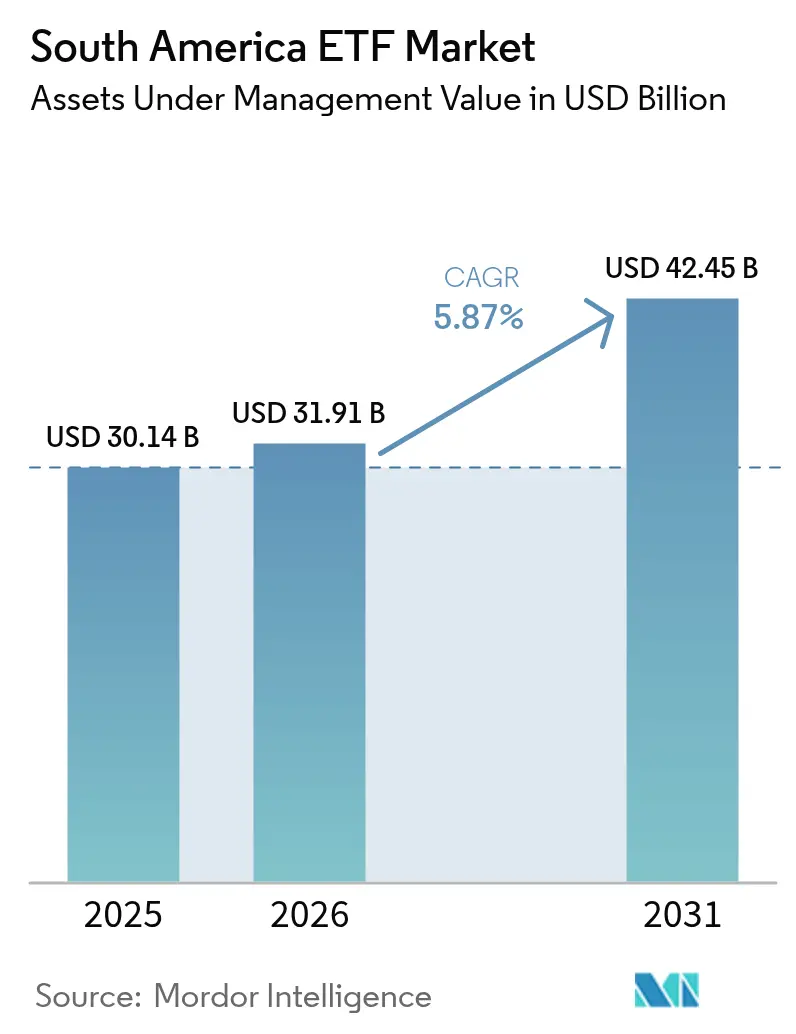
The South America ETF market size is expected to grow from USD 30.14 billion in 2025 to USD 31.91 billion in 2026 and is forecast to reach USD 42.45 billion by 2031 at 5.87% CAGR over 2026-2031. Intensifying financial-literacy efforts, rapid adoption of digital investment platforms, and pension-fund liberalization underpin this trajectory. Brazil’s deep capital markets ecosystem anchors regional momentum, while Colombia, Chile, and Peru accelerate growth through regulatory overhaul and commodity-linked demand. Retail participation now rivals institutional activity, reshaping asset-allocation patterns and spurring new product launches in currency-hedged, commodity, and active strategies. Against this backdrop, the South America ETF market faces structural liquidity gaps outside Brazil and taxation headwinds that could temper near-term inflows.
Key Report Takeaways
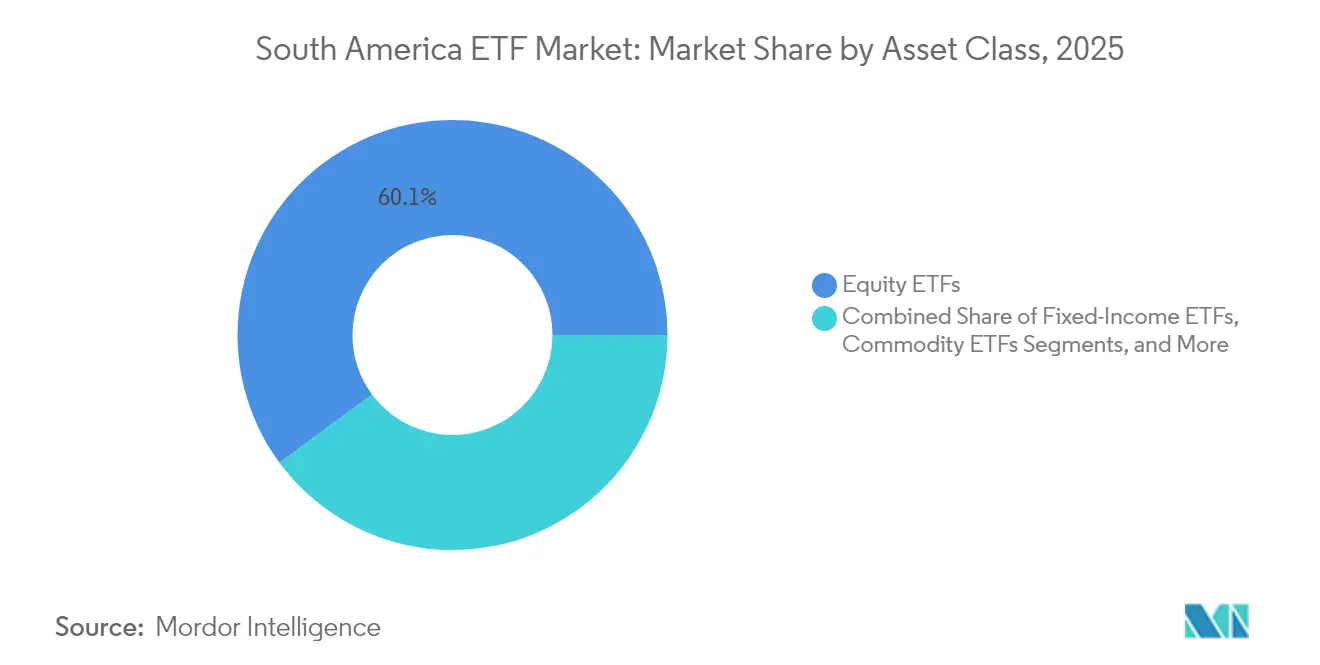
- By asset class, equity ETFs led with 60.12% share of the South America ETF market in 2025; commodity ETFs are projected to expand at a 7.43% CAGR to 2031.
- By investment strategy, passive products held 78.72% of the South America ETF market share in 2025, while active ETFs recorded the highest projected CAGR at 7.96% through 2031.
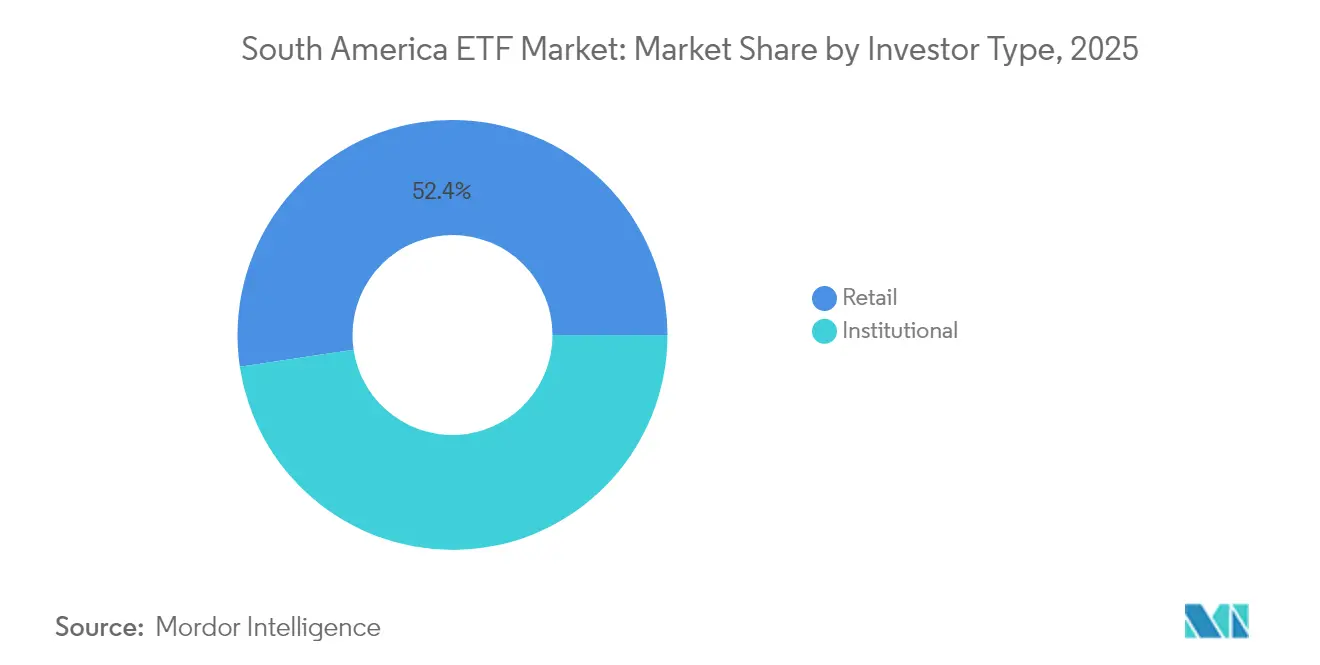
- By investor type, retail investors accounted for 52.35% share of the South America ETF market size in 2025 and are projected to advance at a 6.59% CAGR through 2031.
- By distribution channel, digital platforms captured 41.95% of the South America ETF market in 2025 flows and are forecasted to grow at a 7.11% CAGR to 2031.
- By geography, Brazil dominated with a 62.05% share of the South America ETF market in 2025; Colombia is the fastest-growing country market at a 6.84% CAGR to 2031.
Note: Market size and forecast figures in this report are generated using Mordor Intelligence’s proprietary estimation framework, updated with the latest available data and insights as of 2026.
South America ETF Market Trends and Insights
Drivers Impact Analysis*
| Driver | (~) % Impact on CAGR Forecast | Geographic Relevance | Impact Timeline |
|---|---|---|---|
| Retail investor boom driven by digital brokers | +1.8% | Brazil, Colombia, Chile | Medium term (2–4 years) |
| Pension-fund reforms accelerating ETF adoption | +1.5% | Chile, Colombia, Peru | Long term (≥ 4 years) |
| Currency-volatility hedging via USD-linked ETFs | +1.0% | Argentina, Brazil, Colombia | Short term (≤ 2 years) |
| Regulatory green-light for active ETFs | +0.9% | Brazil, Chile | Medium term (2–4 years) |
| ESG-linked development-bank mandates | +0.7% | Brazil, Colombia, Chile | Long term (≥ 4 years) |
| Commodity-backed ETF demand amid copper & lithium cycle | +1.2% | Chile, Peru, Argentina | Medium term (2–4 years) |
| Source: Mordor Intelligence | |||
Retail Investor Boom Driven by Digital Brokers
Digital platforms have lowered minimum ticket sizes and removed trading commissions, bringing 89% of Brazilian investors online, well above the 77% global average. Nearly 1.6 million first-time shareholders entered equities through zero-commission ETF offerings in a single year. Despite heightened confidence, only 26% of these newcomers feel retirement-ready, opening space for hybrid advisory models that blend robo-interfaces with professional guidance. The shift channels large daily volumes into broad-based and thematic ETFs, reinforcing the South America ETF market’s liquidity in Brazil while spotlighting education gaps elsewhere.
Pension-Fund Reforms Accelerating ETF Adoption
Chile’s revised Fund A limits now permit 80% allocation to variable-income assets, while Colombia segments mandatory funds into four risk buckets with explicit foreign-asset ceilings. These frameworks favor ETFs as cost-efficient vehicles for swift rebalancing, especially when local managers pursue global diversification mandates. Peruvian administrators follow suit, lifting alternative-asset caps and invigorating demand for multi-asset ETFs tied to infrastructure and real-estate benchmarks. As cross-border pension assets rise, the South America ETF market deepens its product shelf and fee competition intensifies[1].
Currency-Volatility Hedging via USD-Linked ETFs Fuels Demand
Persistent FX swings—most acute in Argentina and episodic in Brazil—are steering capital toward dollar-linked ETFs. Argentine investors have used such products to shield portfolios as the peso weakened, while Brazilian savers accelerate hedging ahead of projected rate cuts starting December 2025. For affluent households, USD-linked fixed-income ETFs double as cash-management tools, enabling wealth preservation without direct offshore brokerage accounts. This defensive narrative feeds into daily turnover spikes whenever local currencies breach psychological thresholds.
Growing Demand for Commodity-Backed ETFs amid Copper & Lithium Super-Cycle
Chile and Peru collectively supply more than 40% of global copper, while Argentina commands sizable lithium reserves. Investors use commodity-backed ETFs to capitalize on electrification-driven demand, exemplified by the forthcoming inclusion of physical copper in Sprott’s COPP ETF in June 2025. The innovation allows simultaneous exposure to miners and metal, intensifying volume on the Santiago and Lima bourses. As green-energy policies accelerate, these products anchor diversification strategies that link resource wealth to global decarbonization narratives within the South America ETF market.
Restraints Impact Analysis*
| Restraint | (~) % Impact on CAGR Forecast | Geographic Relevance | Impact Timeline |
|---|---|---|---|
| Illiquidity on Secondary Exchanges Outside Brazil | -1.2% | Argentina, Chile, Colombia, Peru, Ecuador | Medium term (2-4 years) |
| Financial-Transaction Taxes (IOF, VAT) Erode Returns | -0.9% | Brazil, Argentina, Colombia | Long term (≥ 4 years) |
| Low ETF Literacy among Mass-Market Investors | -0.7% | Ecuador, Peru, Rest of South America | Medium term (2-4 years) |
| High Concentration of Assets in a Few Issuers & Indices | -0.5% | Brazil, Chile, Colombia | Long term (≥ 4 years) |
| Source: Mordor Intelligence | |||
Illiquidity on Secondary Exchanges Outside Brazil
Fragmented market micro-structures in Argentina, Chile, and Peru translate into thin order books and wide bid-ask spreads. Institutional desks, therefore, route block trades through Brazil’s B3 or offshore venues, bypassing local exchanges and perpetuating volume shortages. The liquidity deficit raises tracking-error risk for cross-listed ETFs and deters market-maker participation, slowing the South America ETF market’s expansion beyond its Brazilian hub. Regional exchange alliances aim to harmonize clearing protocols, yet tangible progress remains elusive.
Financial-Transaction Taxes (IOF, VAT) Erode Returns
Brazil’s hike of the IOF tax in 2025 imposed a 3.5% levy on FX transactions, wiping 4.43% off the iShares MSCI Brazil ETF in a single session. Coupled with Colombia’s VAT on securities trading and Argentina’s stamp duties, these fiscal measures cut into net returns, particularly for high-turnover or leveraged strategies. Complex periodic-withholding rules on unrealized gains also raise compliance costs for fund sponsors. Unless policymakers streamline regimes, taxes will continue to depress the South America ETF market’s after-fee yields.
*Our forecasts treat driver/restraint impacts as directional, not additive. The impact forecasts reflect baseline growth, mix effects, and variable interactions.
Segment Analysis
By Asset Class: Commodities Drive Future Growth
Equity ETFs controlled 60.12% of the South America ETF market in 2025, reflecting a persistent appetite for diversified exposure to regional corporates. Large-cap trackers and Brazil-small-cap funds remain staples amid widening earnings forecasts. Fixed-income ETFs gained traction as real-rate differentials widened versus developed markets, offering tactical plays for duration management. Real-estate vehicles stay niche, hampered by limited REIT issuance and tax complexity in key jurisdictions.
Commodity vehicles, however, headline future acceleration: they are forecasted to expand at a 7.43% CAGR from 2026-2031, the swiftest pace of any asset class. Chilean and Peruvian copper supply and Argentine lithium reserves make metal-linked ETFs natural hedges against global electrification bottlenecks. The forthcoming physical-plus-equity structure of COPP signals rising product sophistication. Against this backdrop, the South America ETF market size for commodity products is expected to command a growing slice of regional AUM, underpinned by global manufacturers’ strategic stockpiling.
Meanwhile, currency-hedged products burst onto the scene as monetary-policy divergence amplifies FX swings. Argentine savers deploy U.S.-dollar money-market ETFs to preserve purchasing power, while Brazilian high-net-worth clients ladder maturity-based T-bill ETFs to mitigate real-depreciation risk. These cross-border flows underpin resilience in the South America ETF market, even during commodity price drawdowns.

By Investment Strategy: Active Management Gains Momentum
Passive segment held 78.72% of the South America ETF market in 2025, thanks to transparent rules-based methodologies and fee compression. Flagship vehicles linked to broad indices such as the MSCI Brazil provide investors with a one-ticket market entry. Retail brokers emphasize these offerings in model portfolios, citing simplicity and liquidity.
Yet active ETFs are projected to outpace passive peers with an 7.96% CAGR to 2031. Regulatory streamlining, semi-transparent structures, and evidence of alpha in smaller, less-efficient markets fuel this shift. Stock-picking products focusing on value-tilted Brazilian mid-caps or high-yield Andean sovereigns attract advisers seeking differentiated exposure. The South America ETF market size for active mandates is therefore poised for considerable share gains, though product success depends on track-record clarity and tax efficiency. The South America ETF market share captured by active wrappers remains modest today but could rise materially once cross-listing facilitation cuts launch costs.
By Investor Type: Retail Investors Lead Adoption
Retail account holders controlled a 52.35% slice of the South America ETF market in 2025, recording a 6.59% expected CAGR through 2031—the region’s fastest-growing client cohort. Seamless mobile onboarding and micro-investment functionality fuel mass participation, especially in Brazil, where app-based trading crossed 1 billion cumulative transactions in 2025. Gamified interfaces push thematic ETF baskets and recurring-purchase plans, embedding long-term habits among first-time savers.
Institutional investors still dominate block trades and lend crucial depth to the South America ETF market. Pension funds factor prominently: Chilean AFPs lifted foreign allocation allowances to 44% under revised statutes, while Colombian administrators reshuffle equity-bond mixes using ETFs for tactical tilts. Insurance companies adopt short-duration bond ETFs for liquidity buffers that satisfy new IFRS-17 requirements. In aggregate, institutional assets compound at a slower clip than retail but provide ballast during volatility spikes.
By Distribution Channel: Digital Platforms Revolutionize Access
Digital brokers and direct-to-consumer fintechs amassed 41.95% of the South America ETF market share in 2025 and should grow at 7.11% per year to 2031. Push-notification trade alerts, commission-free execution, and fractional share capability entice millennials and Gen Z cohorts. Educational modules integrated into trading dashboards bridge knowledge gaps and encourage product diversification.
Wealth-management hybrids expand share among mass-affluent users demanding tailored tax strategies and goal-based planning. Traditional banks defend relevance by white-labeling ETFs within discretionary mandates. Institutional platforms continue to facilitate large-scale allocations for pension and sovereign funds, though price negotiation intensifies. Ultimately, a multi-channel tapestry emerges, with the South America ETF market accommodating do-it-yourself investors and advisory-led cohorts alike.
Geography Analysis
Brazil commands a 62.05% stake of regional assets in 2025, anchored by B3’s liquidity, a sizable domestic savings pool, and a modernized regulatory code. Consolidated investment-fund equity of BRL 9.3 trillion in November 2024 provides the capital base for ETF seeding and secondary-market depth. CVM’s adoption of consolidated prospectus templates further expedites product approvals, fortifying Brazil’s centrality in the South America ETF market. Tax complexity remains an overhang, however, as IOF adjustments and periodic-withholding regimes distort net returns.
Colombia represents the region’s growth frontier, posting a 6.84% CAGR through 2031. Pension-fund segmentation—Conservative, Moderate, High Risk, Programmed Retirement—promotes asset-liability matching that naturally aligns with age-appropriate ETF portfolios. Heightened political stability and capital-market modernization initiatives attract cross-listing interest from global issuers. As liquidity improves on the Bolsa de Valores de Colombia, the South America ETF market sees a steady pipeline of local-currency and dual-currency listings.
Chile and Peru capitalize on their mining-sector dominance to attract commodity-focused inflows. Santiago’s Bolsa Electrónica enhances order-routing links with Lima to encourage arbitrage and tighter spreads. Regulatory clarity on carbon pricing bolsters demand for green-metal ETFs, aligning with sovereign decarbonization pledges. Argentina, despite macro-volatility, demonstrates resilient equity returns and sustained interest in dollar-denominated ETFs, evidencing investor appetite for asymmetric upside amid reform momentum.
Ecuador and other small jurisdictions lag due to limited brokerage penetration and nascent custody frameworks. Nevertheless, multilateral development programs aim to digitalize settlement infrastructure, suggesting medium-term tailwinds. As EU-Mercosur trade negotiations progress, European asset managers scan for partnership openings, anticipating export-led growth in lithium and agribusiness ETFs. Such milestones would expand the geographic breadth of the South America ETF market and diversify revenue streams away from Brazil-centric flows.
Regulatory Landscape
South American ETFs operate under country-level securities and fund regimes, with Brazil setting the regional pace through the Comissao de Valores Mobiliarios (CVM) framework. In Brazil, ETFs are governed under CVM Resolution 175 (Annex V), which has historically constrained product design by limiting leveraged, inverse, and synthetic structures, shaping a market dominated by traditional passive exposure and plain-vanilla index replication.
Regulatory change is actively in motion. In April 2026, the CVM signaled a revision of ETF rules to bring passive, active, and leveraged structures under a single updated framework. The agency also scheduled a public consultation later in 2026, with a target completion timeline extending into 2027. Elsewhere, Chile continues to modernize fund supervision under Law No. 20,712: the Comision para el Mercado Financiero (CMF) moved to consolidate and standardize rules via a public consultation launched in November 2025 for a Regulatory Compendium (around 80 regulations). It also implemented reporting-related amendments to the Information Systems Manual for Funds through General Rule No. 532 effective June 1, 2026, tightening disclosure and operational reporting expectations for fund managers.
Value Chain Analysis
The South America ETF value chain starts with index design and product structuring by asset managers, followed by regulatory authorization and exchange admission. Primary-market creation and redemptions with authorized participants lead into secondary-market trading supported by market makers. Brazil sits at the core of the region's operating model because B3 provides the deepest liquidity and the most developed market-making ecosystem, and it also functions as a practical routing venue for larger blocks that might otherwise face thin order books and wide spreads on smaller local exchanges.
Distribution and access typically run through local broker-dealers, banks, and digital platforms, often via partnerships that let global issuers reach regional retail and institutional demand while meeting local operational requirements (custody, settlement, disclosures). The issuer layer is also consolidating around large platforms with scale advantages in seeding, liquidity agreements, and shelf space; for example, Itau Asset Management was reported in April 2026 to have surpassed BlackRock in Brazil by ETF assets (around R$ 30 billion, about 28% share as of March 2026), showing how domestic distribution strength can shift competitive positioning. Cross-border interoperability efforts such as MILA still matter as an enabling layer for multi-market access, but day-to-day liquidity formation depends heavily on Brazil-centric trading infrastructure and local market-making capacity.
Competitive Landscape
Dominant incumbents include BlackRock’s iShares franchise, XP Asset Management, and Itaú Asset Management, each leveraging proprietary distribution or first-mover lineage. BlackRock maintains product depth across equities, fixed income, and factors, supported by robust market-making agreements that tighten spreads. XP Inc. exploits its 4.7 million-strong retail client base and R$1.3 trillion in assets to launch local-currency ETFs capturing thematic niches such as Chinese equities and domestic gold proxies.
VanEck and DWS scale presence via sub-advisory deals, while Abrdn’s distribution accord with Capital Strategies Partners exemplifies partnership strategies to overcome regulatory hurdles. SPDR’s entry into physically backed metal ETFs signals intensifying competition in commodity segments—an area historically underserved by local providers. As product shelves expand, cost competition escalates, compressing expense ratios and fostering consolidation among smaller issuers unable to shoulder seeding burdens.
Technology acts as a pivotal differentiator. Digital-native issuers employ cloud-based order-management systems and API-driven data feeds to streamline compliance updates and potentiate intraday disclosures. BlackRock targets active-fund expansion, aspiring to join Brazil’s top-10 asset managers within five years by diversifying into fixed income. XP’s in-house robo-adviser plugs model-portfolio ETFs into automated rebalancing, enhancing stickiness. Collectively, these moves amplify the South America ETF market’s competitive intensity and accelerate product innovation cycles[3].
South America ETF Industry Leaders
-
BlackRock Inc. (iShares)
-
VanEck
-
XP Inc. (XP Asset Management)
-
ProShares
-
WisdomTree
- *Disclaimer: Major Players sorted in no particular order
Market Opportunities and Future Outlook
Product expansion in Brazil is a primary whitespace area because the dominant regional hub still operates under an ETF rule set that limits leverage and certain advanced structures. The CVM's April 2026 initiative to revise ETF rules into a unified framework spanning passive, active, and leveraged categories creates a clear pathway for broader ETF lineups and new use cases (tactical risk management, duration tools, and differentiated active wrappers), while keeping requirements category-specific. This regulatory workstream also matches the report's observed momentum for active ETFs, since approvals and permitted structures influence launch cadence and adoption.
Distribution-led opportunities concentrate where digital platforms and fee-based advice are reshaping portfolio construction, especially in Brazil, which held 62.05% of regional ETF assets in 2025 and where digital channels captured 41.95% of 2025 flows. Visible market moves reinforce this: Nubank announced plans for approximately BRL 45 billion of investments in Brazil in 2026, aimed at technology and product development that can deepen retail participation and embed ETFs inside broader financial ecosystems. At the regional platform level, consolidation also opens new shelves for ETF placement and cross-border reach, illustrated by Cocos Capital's July 2026 agreement to acquire Brazil-based Warren Investimentos (including Renascenca DTVM), which strengthens the distribution and institutional plumbing that sits between ETF issuers and end investors.
Recent Industry Developments
- May 2026: XP Asset launched PREX11, its first 100% fixed-rate (prefixado) fixed-income ETF, tracking the Anbima IRF-M P2 index. The launch broadened the Brazilian fixed-income ETF toolkit beyond inflation-linked and post-fixed exposures, giving advisers and retail investors a more granular way to position for local rate-cycle shifts.
- November 2025: XP Asset launched four ETFs (including products linked to Bitcoin, Ethereum, and inflation-linked government bonds). The bundle expanded local access to both digital-asset and real-rate exposures via an exchange-traded format, reinforcing the trend toward specialized and non-traditional underlyings within Brazil's ETF shelf.
- March 2024: VanEck strengthened its Latin America footprint with an investment in Brazilian ETF innovator Investo. The move supported localized product development and distribution capability in the region's largest ETF market, increasing competitive pressure on incumbents and accelerating product differentiation beyond core index trackers.
Research Methodology Framework and Report Scope
Market Definition and Coverage
For this methodology, the South America ETF market is defined as the total assets under management (AUM) held in exchange traded funds that are domiciled in, or formally cross-listed into, regulated exchanges across South America.
Scope exclusions: The sizing excludes exchange-traded notes and closed-end fund structures that do not have ETF status, and it also excludes leveraged or inverse notes where they are classified outside ETFs.
Segmentation Overview
- By Asset Class
- Equity ETFs
- Fixed-Income ETFs
- Commodity ETFs
- Currency ETFs
- Real-Estate ETFs
- Alternative ETFs
- By Investment Strategy
- Active
- Passive
- By Investor Type
- Retail
- Institutional
- By Distribution Channel
- Direct and Digital Retail Platforms
- Financial Advisors and Wealth Managers
- Institutional Channels
- Traditional Banks and Full-Service Brokers
- By Country
- Brazil
- Argentina
- Colombia
- Chile
- Peru
- Ecuador
- Rest of South America
Data Sources, Market Sizing, and Validation
Desk Research
We first mapped local ETF definitions and listing rules across the main exchanges so that the same product type is counted consistently across countries. Public references used for this include securities regulator publications, stock exchange market statistics, central bank releases, and multilateral datasets (for example, IMF and World Bank series) to understand macro drivers tied to AUM changes.
To keep the inputs practical, we also reviewed issuer factsheets, exchange notices, and fund reports that describe NAV, currency, and portfolio exposures, which helps when converting AUM into a single USD view across countries. In parallel, we used paid subscriptions for company financials and news, and an import and export shipment-level database only when a cross-border product listing needed confirmation in context. The desk research sources cited here are illustrative only, and other public documents were also used for data collection, validation, and clarification.
Primary Interviews and Surveys
We use expert interviews and surveys with asset managers, exchange and regulatory specialists, distributors, financial advisors, and institutional and retail-market experts in South America. Their feedback helps test reported assets, clarify cross-listed products, fill gaps in country disclosures, and assess the assumptions applied to the final regional market model.
Distribution of primary research fieldwork respondents
| Company type | Respondent position |
|---|---|
| Top tier: 29% | CXOs: 18% |
| Mid tier: 51% | Functional/Unit leaders: 31% |
| Smaller Players: 20% | Managers: 51% |
Market-Sizing & Forecasting
We sized the market using an AUM-led, top-down build where fund NAV data, exchange-level listings, and country coverage are assembled into a single South America total and then reconciled to the base year. To keep the result grounded, we ran selective bottom-up checks using sampled ETF AUM roll-ups by country and by major exposure bucket, then adjusted for gaps where smaller funds publish NAV less frequently.
Key inputs that move the model are straightforward and repeatable, such as local equity and rates direction that change portfolio values, FX translation into USD, net creations and redemptions (flows) where observable, counts of listed ETFs and new launches, and liquidity signals like trading activity that influence adoption. Forecasts were built using scenario analysis tied to macro variables and expected product pipeline, and then the implied AUM path was checked against what primary respondents consider realistic for investor mix and exchange readiness. Where direct AUM points were missing for a fund or a short period, we used nearest published NAV, peer-fund behavior, and FX adjusted interpolation so the total stays consistent without overfitting.
Data Validation & Update Cycle
We validated totals through multiple passes, starting with definition checks (what qualifies as an ETF in each market) and then moving to time-series checks so jumps match known events like large market moves, new listings, or reclassifications. Variances against independent signals, such as exchange summary statistics and widely cited AUM snapshots, were flagged for review and then rechecked with follow-up outreach when the gap looked structural rather than timing related.
Before sign-off, the model is reviewed by another analyst for arithmetic consistency, FX conversions, and scope alignment across countries, after which the narrative is aligned to the same assumptions. Reports are refreshed annually, and interim updates are triggered when material events occur, such as major regulatory changes or meaningful exchange-level product shifts. Right before delivery, we do a final refresh pass so clients receive the most current view supported by the latest available data.
Mordor Intelligence's South America Etf Market Size Versus Other Published Estimates
Published numbers for the South America ETF market can differ even when they all look like AUM, because the market is counted using different geography buckets and different listing rules. In practice, the biggest swings usually come from whether cross-listed funds are included, whether the scope is South America only or bundled with Central America, and which cut-off date is used for market moves and FX.
Key gap drivers are mostly definitional and timing-led, rather than math errors. Some sources report ETFs by domicile, others report ETFs by primary listing venue, and many do not fully explain how they avoid double counting when funds are cross-listed across exchanges. The spread also increases when one publisher uses end-of-year AUM and another uses an intra-year snapshot, since equity levels and currency moves can shift USD AUM quickly.
Benchmark comparison
| Source | Market Size | Gaps in Research Methodology |
|---|---|---|
| Mordor Intelligence | USD 30.14 B (2025) | |
| Industry Data Provider A | USD 25.50 B (2025) | Uses a domicile-only view for South and Central America combined, which can exclude ETFs that are mainly accessed via cross-listings in South American exchanges and can also shift totals due to the broader regional bucket. |
| Industry Association B | USD 22.16 B (2024) | Tracks ETFs by primary listing in Latin America at a specific month-end snapshot, and it states that cross-listed assets are attributed back to the primary listing country, which lowers totals versus a cross-list inclusive view. |
The table shows that most of the variance is explained by listing treatment and geography, and then amplified by timing and FX. When cross-listed ETFs across regulated South American exchanges are counted in the AUM total, rather than being attributed only to a fund's primary listing market, the results typically come out higher, and that inclusion rule is applied here by Mordor Intelligence.
Key Questions Answered in the Report
What is the current value of the South America ETF market?
The South America ETF market size is USD 31.91 billion in 2026 and is projected to rise to USD 42.45 billion by 2031.
Which asset class is expected to grow the fastest within South American ETFs?
Commodity ETFs are forecast to expand at a 7.43% CAGR between 2026 and 2031 due to demand for copper and lithium exposure.
How important are retail investors in the regional ETF landscape?
Retail investors hold 52.35% of assets in 2025 and are advancing at a 6.59% CAGR, making them the largest and fastest-growing investor segment.
Why are active ETFs gaining traction in South America?
Regulatory reforms such as Brazil’s CVM Resolution 175 have streamlined approvals, enabling active strategies to seek alpha in less-efficient local markets and grow at an 7.96% CAGR.
What are the main challenges facing ETF growth outside Brazil?
Secondary-market illiquidity on smaller exchanges and transaction-tax regimes like Brazil’s IOF and Colombia’s VAT can widen spreads and erode net returns.
Which country is projected to record the highest ETF growth rate through 2031?
Colombia leads with a 6.84% CAGR, driven by pension-fund reforms and increased cross-border investment inflows.