South America Electric Bus Battery Pack Market Size and Share
Market Overview
| Study Period | 2017 - 2029 |
|---|---|
| Base Year For Estimation | 2022 |
| Forecast Data Period | 2023 - 2029 |
| Market Size (2023) | USD 9.76 Million |
| Market Size (2029) | USD 28.62 Million |
| Growth Rate (2023 - 2029) | 19.63% CAGR |
| Market Concentration | Low |
Major Players*Disclaimer: Major Players sorted in no particular order Image © Mordor Intelligence. Reuse requires attribution under CC BY 4.0. | |

South America Electric Bus Battery Pack Market Analysis by Mordor Intelligence
The South America Electric Bus Battery Pack Market size is estimated at 9.76 million USD in 2023, and is expected to reach 28.62 million USD by 2029, growing at a CAGR of 19.63% during the forecast period (2023-2029).
The South American electric bus battery pack industry is experiencing significant transformation driven by increasing environmental consciousness and a governmental push toward sustainable transportation. Cities across the region are actively transitioning their public transportation fleets to electric alternatives, with Chile leading the charge, having deployed over 800 electric buses as of 2022. The shift towards electrification is further accelerated by technological advancements in battery technology, which have resulted in an approximately 80% reduction in battery costs compared to the previous decade. This cost reduction has made electric buses more economically viable for public transportation authorities and private operators alike, leading to increased adoption across major South American cities.
Infrastructure development and manufacturing capabilities are rapidly evolving to support the growing electric bus battery pack ecosystem. In April 2023, BYD announced a significant investment of USD 290 million to construct a cathode material plant in Chile, which will produce 50,000 tonnes of LFP cathode material annually. This development represents a crucial step in localizing the battery supply chain within South America and reducing dependency on imports. Additionally, major cities are setting ambitious targets for fleet electrification, with São Paulo announcing plans to deploy 2,600 electric buses by the end of 2024, demonstrating the region's commitment to sustainable public transportation.
The market is witnessing increased participation from international manufacturers and technology providers, fostering innovation and competition. In January 2023, Iveco Bus marked its entry into the South American market by launching its E-Way electric bus in Uruguay, expanding the range of available electric bus components in the region. This growing manufacturer presence is accompanied by improvements in battery technology, focusing on enhanced energy density, faster charging capabilities, and longer operational life spans. The diversification of battery chemistries and configurations is enabling operators to select solutions that best match their specific operational requirements and environmental conditions.
Local governments are implementing comprehensive electrification strategies with clear targets and timelines. Colombia has set an ambitious goal of having 600,000 electric vehicles on its roads by 2030, while Chile announced plans in February 2023 to add 1,000 electric buses to Santiago's fleet by the end of the year. These initiatives are supported by various incentive programs, including tax benefits and subsidies, designed to accelerate the transition to electric public transportation. The combination of government support, improving technology, and growing manufacturer presence is creating a favorable environment for the continued expansion of the electric bus battery pack market in South America.
South America Electric Bus Battery Pack Market Trends and Insights
Growing Demand and Government Incentives Drive Electric Vehicle Market in South America
- Various countries falling under the South America region such as Brazil and Argentina etc. have great potential for the automobile market, and the South American vehicle industry has experienced substantial growth over the past few years. In recent years, the demand for electric vehicles, primarily passenger cars, has increased in the region owing to the factors such as rising awareness of electric vehicles, growing environmental concern, governmental push towards the adoption of electric vehicles. These factors are gradually shifting consumers to electric vehicles and the sales of the EVs have grown to 17.95% in 2022 over 2021.
- South America has various potential electric vehicle markets and Brazil holds potential demand for electric buses as the country is focusing on the adoption of more renewable power generation, which may utilize the country’s large niobium and lithium reserves, a crucial factor for EV batteries’ development. Moreover, In December, 2022, Sao Paulo bans the purchasing of diesel buses and has announced to deploy 2600 electric buses by the end of 2024. Similar factors in other countries are expected to boost the electrification of vehicles in the South America during the forecast period.
- The electrification of vehicles in South America is anticipated to be fueled by the policies and incentive programs implemented by the governments of the various countries in the region. Tax benefits are the main motivation, as the Government of Colombia is using incentives and subsidies to reach an ambitious goal of 600,000 EVs on the road by 2030 to address the carbon emission issues. As a result, similar factors in other countries in South America is anticipated to increase the sales of the EVs during the forecast period.

OTHER KEY INDUSTRY TRENDS COVERED IN THE REPORT
- Growing Adoption of Electric Vehicles and Advancements in Battery Technology Drive South America's EV Market
Segment Analysis: Propulsion Type
PHEV Segment in South America Electric Bus Battery Pack Market
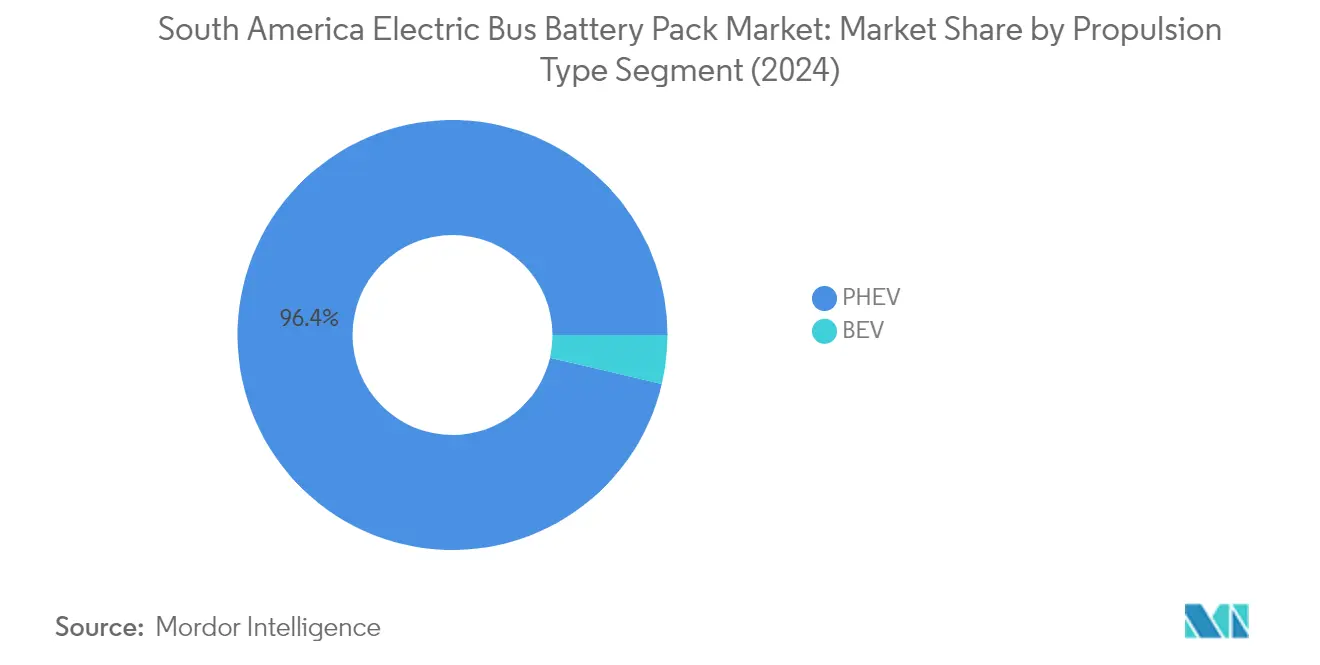
The Plug-in Hybrid Electric Vehicle (PHEV) segment dominates the South American electric bus battery pack market, commanding approximately 96% of the total market share in 2024. This significant market dominance can be attributed to several factors, including the technology's ability to provide a balanced solution between pure electric and conventional powertrains. The segment's strong position is particularly evident in major markets like Brazil and Chile, where infrastructure limitations make PHEVs an attractive transition technology. The dual-power source capability of PHEVs, combining both electric and conventional powertrains, offers operators greater flexibility in route planning and reduces range anxiety concerns. Additionally, government incentives and supportive policies across various South American countries have played a crucial role in maintaining PHEV's market leadership, particularly in urban transit applications where the technology's benefits are most apparent.
BEV Segment in South America Electric Bus Battery Pack Market
The Battery Electric Vehicle (BEV) segment is emerging as the fastest-growing segment in the South American electric bus battery pack market, projected to grow at approximately 36% during 2024-2029. This remarkable growth trajectory is driven by increasing environmental consciousness and stringent emission regulations across South American countries. The segment is witnessing substantial momentum due to technological advancements in battery technology, resulting in improved range capabilities and reduced charging times. Major cities across Brazil, Chile, and Colombia are increasingly adopting zero-emission policies, directly benefiting the BEV segment. The declining costs of battery technology, coupled with government subsidies and incentives specifically targeting pure electric vehicles, are making BEVs increasingly attractive to transit operators. Furthermore, the expansion of charging infrastructure across major South American cities is addressing one of the key barriers to BEV adoption, contributing to the segment's accelerated growth rate.
Segment Analysis: Battery Chemistry
NCM Segment in South America Electric Bus Battery Pack Market
The NCM (Nickel Cobalt Manganese) battery chemistry segment has emerged as the dominant force in the South American electric bus battery pack market, commanding approximately 41% market share in 2024. This significant market position can be attributed to several key advantages that NCM batteries offer, including superior energy density, enhanced thermal stability, and improved charging capabilities compared to other chemistries. The segment's leadership is particularly evident in major markets like Brazil and Chile, where electric bus manufacturers increasingly prefer NCM chemistry for their vehicles due to its optimal balance of performance and cost-effectiveness. The growing adoption of NCM batteries is also supported by their proven track record in maintaining consistent performance across varying weather conditions, which is crucial for the diverse climate zones across South America. Additionally, the segment's dominance is reinforced by major battery manufacturers expanding their NCM production capabilities to meet the rising demand from electric bus manufacturers in the region.
NMC Segment in South America Electric Bus Battery Pack Market
The NMC (Nickel Manganese Cobalt) battery chemistry segment is demonstrating remarkable growth potential in the South American electric bus battery pack market. The segment is projected to maintain a strong growth trajectory between 2024 and 2029, driven by continuous technological advancements in NMC battery formulations that enhance their performance and safety characteristics. The growth is further supported by increasing investments in research and development activities focused on improving the energy density and lifecycle of NMC batteries. Electric bus manufacturers across South America are showing growing interest in NMC chemistry due to its ability to provide a balanced combination of power output and energy storage capacity. The segment's expansion is also bolstered by the development of advanced manufacturing facilities in key South American markets, which are helping to reduce production costs and improve the availability of NMC batteries for electric bus applications.
Remaining Segments in Battery Chemistry
The remaining segments in the South American electric bus battery pack market include NCA (Nickel Cobalt Aluminum) and other battery chemistries, each playing distinct roles in serving specific market needs. NCA batteries are gaining attention for their high energy density and potential for extended range applications, though their adoption remains selective due to higher production costs and specific safety requirements. Other battery chemistries, including emerging technologies and specialized formulations, continue to serve niche applications within the electric bus sector, particularly in cases where specific performance characteristics or cost considerations are paramount. These segments contribute to the market's diversity by offering alternatives that cater to varying operational requirements, climate conditions, and budget constraints across different South American regions.
Segment Analysis: Capacity
Above 80 kWh Segment in South America Electric Bus Battery Pack Market
The Above 80 kWh segment has emerged as the dominant force in the South American electric bus battery pack market, commanding approximately 72% market share in 2024. This significant market position can be attributed to the growing preference for long-range electric buses in major South American cities, particularly in countries like Brazil and Chile. The segment's dominance is further strengthened by the increasing focus on intercity transportation and the need for extended operational hours without frequent charging stops. Major cities across South America are increasingly deploying high-capacity electric buses equipped with batteries above 80 kWh to serve longer routes and handle higher passenger loads efficiently. The segment's strong performance is also supported by government initiatives promoting zero-emission public transportation and the growing infrastructure development for electric bus operations in metropolitan areas.
Less than 15 kWh Segment in South America Electric Bus Battery Pack Market
The Less than 15 kWh segment is demonstrating remarkable growth potential in the South American electric bus battery pack market, with projections indicating a robust growth trajectory from 2024 to 2029. This segment's rapid expansion is driven by the increasing adoption of smaller electric buses and shuttles for short-distance urban transportation and last-mile connectivity solutions. The growth is particularly notable in emerging cities where the focus is on developing sustainable public transportation systems with smaller, more efficient vehicles. The segment is benefiting from advancements in battery technology that enable improved performance even with lower capacity batteries, making them an attractive option for operators looking to optimize costs while maintaining operational efficiency. Additionally, the growing trend of micro-mobility solutions and the need for flexible urban transportation options is further accelerating the adoption of these smaller capacity battery packs.
Remaining Segments in Capacity
The mid-range capacity segments, including the 15-40 kWh and 40-80 kWh categories, play crucial roles in serving diverse transportation needs across South American cities. These segments cater to different operational requirements, from medium-distance urban routes to specialized transportation services. The 15-40 kWh segment is particularly popular for inner-city operations where frequent charging opportunities are available, while the 40-80 kWh segment serves as a balanced option for operators seeking moderate range capabilities without the additional cost of higher capacity batteries. These segments are essential in providing operators with flexible options that match their specific route requirements, passenger loads, and charging infrastructure availability. The diversity of these capacity segments ensures that the market can effectively address varying transportation needs across different urban and suburban settings.
Segment Analysis: Method
Wire Segment in South America Electric Bus Battery Pack Market
Wire bonding has emerged as the dominant technology in the South American electric bus battery pack market, commanding approximately 65% of the market share in 2024. This method has gained significant traction due to its proven reliability and cost-effectiveness in battery pack manufacturing. Wire bonding technology is particularly favored for its versatility in connecting battery cells within a pack, especially in low to medium power applications. The method involves using ultrasonic or thermocompression bonding to establish reliable connections between cells, making it an attractive choice for manufacturers. The segment is experiencing robust growth and is expected to maintain its market leadership through 2029, driven by factors such as wire material advancements, improved bonding parameters, and its widespread adoption among major battery pack manufacturers in the region. The technology's ability to provide efficient and reliable connections while maintaining relatively lower production costs has made it the preferred choice for many electric bus battery manufacturers across South America.
Laser Segment in South America Electric Bus Battery Pack Market
The laser welding segment represents a more specialized approach in the battery pack manufacturing process, offering unique advantages in high-power applications. This technology has gained recognition for its ability to provide precise, high-quality connections between battery cells, ensuring optimal performance and enhanced thermal management capabilities. Laser welding enables manufacturers to achieve consistent and reliable connections with reduced resistance, making it particularly suitable for specific high-performance applications in electric bus battery packs. The technology's adoption is primarily driven by its superior joint strength and ability to maintain tight quality control during the manufacturing process. However, the higher initial investment costs and specialized expertise required for implementation have influenced its market penetration in the South American region. Despite these challenges, laser welding continues to play a crucial role in specific applications where precision and high-performance requirements are paramount.
Segment Analysis: Component
Cathode Segment in South America Electric Bus Battery Pack Market
The cathode segment has emerged as both the largest and fastest growing component in the South American electric bus battery pack market, commanding approximately 50% of the total market value in 2024. This dominance can be attributed to cathodes being one of the most expensive battery materials among all other components, accounting for around 52% of the battery packs used in electric buses. The segment's growth is driven by its crucial role in controlling battery performance, range, and thermal safety, making it an essential component across all battery chemistry types used in electric buses, including LFP, NMC, and NCA. Various manufacturers in South American nations have increased their use of cathodes to meet the rising demand for electric buses. In April 2023, Chinese automaker BYD announced plans to invest USD 290 million to construct a cathode material plant in Chile, with an expected annual production capacity of 50,000 tonnes of LFP cathode material by 2025, demonstrating the growing importance of cathode production in the region.
Remaining Segments in Component Market
The other major electric bus components in the electric bus battery pack market include anodes, electrolytes, and separators, each playing vital roles in battery functionality and performance. Anodes, which account for approximately 12% of the overall battery pricing, are crucial for determining battery durability, rapid charging capabilities, and extended range. Electrolytes serve as essential components that manage the division between positive and negative terminals, enabling proper charge movement while making up about 4% of the battery cost. Separators, though comprising only about 7% of the total battery cost, are fundamental for the battery's overall performance, including its life cycle and safety features, as they enable the passage of lithium ions while preventing electron transfer. These components collectively contribute to the advancement of battery technology and the growing adoption of electric buses across South America.
Segment Analysis: Material Type
Natural Graphite Segment in South America Electric Bus Battery Pack Market
Natural graphite has emerged as a dominant material in the South American electric bus battery pack market, commanding approximately 27% market share in 2024. This material's prominence can be attributed to its essential role in manufacturing battery anodes, where it is used across all battery chemistries including LFP, NMC, NCM, and NCA. The growing adoption of electric buses in countries like Brazil, Chile, and Argentina has significantly boosted the demand for natural graphite. The material's superior performance characteristics, including high energy density and excellent conductivity, make it indispensable for battery manufacturing. In December 2023, South Star Battery Metals announced plans to complete its Santa Cruz graphite project in eastern Brazil, with initial production capacity of 5,000 tonnes per year, scaling up to 25,000 tonnes annually, demonstrating the region's commitment to securing local graphite supply chains for the growing electric vehicle battery industry.
Lithium Segment in South America Electric Bus Battery Pack Market
The lithium segment is experiencing remarkable growth in the South American electric bus battery pack market, with a projected growth rate of approximately 28% from 2024 to 2029. This exceptional growth is driven by the increasing adoption of various lithium-based battery chemistries, particularly LFP batteries, which are predominantly used in heavy vehicles like buses. The expansion is further supported by significant investments in lithium production across the region. In February 2023, TPY Tech announced the establishment of Argentina's first lithium-ion battery cell factory, partnering with US-based Livent for lithium procurement. This development, along with other regional initiatives, is strengthening the lithium supply chain for battery manufacturing. The segment's growth is also bolstered by technological advancements in battery chemistry, improving energy density and performance, making lithium-based batteries increasingly attractive for electric bus applications.
Remaining Segments in Material Type
The other key materials in the South American electric bus battery pack market include cobalt, manganese, and nickel, each playing crucial roles in various battery chemistries. Cobalt is particularly important in high-performance batteries, contributing to improved energy density and thermal stability. Manganese serves as a cost-effective material that enhances battery performance and safety, particularly in NMC batteries. Nickel is gaining importance due to its ability to increase energy density and reduce overall battery costs. These materials complement each other in different battery chemistries, with manufacturers often adjusting their proportions to optimize performance, cost, and safety characteristics. The development of new battery technologies and chemistries continues to influence the demand for these materials, with ongoing research focusing on reducing dependency on costly materials while maintaining or improving battery performance.
Competitive Landscape
Top Companies in South America Electric Bus Battery Pack Market
The South American electric bus battery pack market is characterized by companies focusing on technological advancement and product innovation, particularly in developing high-capacity batteries with improved energy density and faster charging capabilities. Market players are actively pursuing strategic partnerships with local bus manufacturers and transport authorities to strengthen their market presence and secure long-term contracts. Companies are investing in expanding their production facilities and establishing regional service networks to better serve the growing demand across major markets like Brazil, Chile, and Colombia. Operational agility is demonstrated through flexible manufacturing processes and localized supply chain networks, enabling companies to adapt to varying regional requirements and regulations. The competitive landscape is further shaped by companies' efforts to develop sustainable and cost-effective battery solutions while maintaining high safety standards and performance metrics.
Market Dominated by Global Battery Specialists
The South American electric bus battery pack market exhibits a moderate level of consolidation, with global battery manufacturers holding significant market share alongside emerging regional players. International companies, particularly from China, have established strong footholds in the market through strategic partnerships with local bus manufacturers and transport authorities. These global players leverage their advanced technology capabilities and economies of scale to maintain competitive advantages in the region. The market structure is characterized by a mix of specialized battery manufacturers and diversified automotive component suppliers, with the former leading in terms of technological innovation and market share.
The market has witnessed increasing merger and acquisition activities as companies seek to strengthen their regional presence and expand their technological capabilities. Global players are actively pursuing partnerships with local entities to navigate regional regulations and establish stronger distribution networks. The competitive dynamics are influenced by vertical integration strategies, with some major players expanding their operations across the battery value chain, from raw material procurement to after-sales services. Local players are gradually emerging in the market, particularly in Brazil and Argentina, supported by government initiatives to develop domestic manufacturing capabilities.
Innovation and Localization Drive Future Success
Success in the South American electric bus battery pack market increasingly depends on companies' ability to develop cost-effective solutions while maintaining high performance standards. Market players need to focus on establishing local manufacturing facilities and developing strong relationships with regional public transport authorities and bus manufacturers. The ability to provide comprehensive after-sales support and maintenance services is becoming crucial for maintaining market share. Companies must also invest in research and development to improve battery efficiency and durability while reducing production costs. The market's future will be shaped by players' capacity to adapt to evolving environmental regulations and safety standards while meeting the specific requirements of different South American markets.
Companies entering or expanding in the market need to consider the high concentration of demand in major urban centers and develop strategies to serve these key markets effectively. Success factors include the ability to offer flexible financing solutions and maintain competitive pricing while ensuring product quality and reliability. The regulatory landscape, particularly regarding environmental standards and local content requirements, will continue to influence market dynamics and company strategies. Players must also address the potential risks of raw material supply chain disruptions and develop strategies to ensure stable component sourcing. The market's evolution will be significantly influenced by companies' ability to build strong local presence while leveraging global technological expertise.
- *Disclaimer: Major Players sorted in no particular order

South America Electric Bus Battery Pack Market Report Scope
BEV, PHEV are covered as segments by Propulsion Type. LFP, NCA, NCM, NMC, Others are covered as segments by Battery Chemistry. 15 kWh to 40 kWh, 40 kWh to 80 kWh, Above 80 kWh, Less than 15 kWh are covered as segments by Capacity. Cylindrical, Pouch, Prismatic are covered as segments by Battery Form. Laser, Wire are covered as segments by Method. Anode, Cathode, Electrolyte, Separator are covered as segments by Component. Cobalt, Lithium, Manganese, Natural Graphite, Nickel are covered as segments by Material Type.| BEV |
| PHEV |
| LFP |
| NCA |
| NCM |
| NMC |
| Others |
| 15 kWh to 40 kWh |
| 40 kWh to 80 kWh |
| Above 80 kWh |
| Less than 15 kWh |
| Cylindrical |
| Pouch |
| Prismatic |
| Laser |
| Wire |
| Anode |
| Cathode |
| Electrolyte |
| Separator |
| Cobalt |
| Lithium |
| Manganese |
| Natural Graphite |
| Nickel |
| Other Materials |
| Propulsion Type | BEV |
| PHEV | |
| Battery Chemistry | LFP |
| NCA | |
| NCM | |
| NMC | |
| Others | |
| Capacity | 15 kWh to 40 kWh |
| 40 kWh to 80 kWh | |
| Above 80 kWh | |
| Less than 15 kWh | |
| Battery Form | Cylindrical |
| Pouch | |
| Prismatic | |
| Method | Laser |
| Wire | |
| Component | Anode |
| Cathode | |
| Electrolyte | |
| Separator | |
| Material Type | Cobalt |
| Lithium | |
| Manganese | |
| Natural Graphite | |
| Nickel | |
| Other Materials |
Market Definition
- BEV - BEV or all-electric vehicle is an EV that has an electric motor and a battery but no internal combustion engine.
- Plug-in Hybrid EV - A vehicle that can be powered either by an ICE or an electric motor. In contrast to normal hybrid EVs, they can It can be charged externally.
- LFP - LFP stands for Lithium Iron Phosphate and are known for their high energy density, long cycle life, and excellent safety features.
- NMC - NMC stands for Nickel Manganese Cobalt. NMC batteries are known for their high energy density, which makes them ideal for use in electric vehicles and other high-performance applications.
- NCM - NCM batteries, or Nickel Cobalt Manganese batteries, are a type of lithium-ion battery that uses a combination of nickel, cobalt, and manganese in the cathode material. They are a popular choice for high-performance applications where energy density and cycle life are important factors to consider.
- Others - Others include li-ion batteries with cathode material such as LTO, LMO, NCA, and LMO.
- Prismatic - Prismatic cells are rectangular in shape and have a higher energy density. They are commonly used in many electric vehicle models and large energy storage systems.
- Cylindrical - Cylindrical cells have a cylindrical shape and are more durable and easier to cool than other cell types. They can be arranged in different configurations to optimize performance and energy density.
- Pouch - Pouch cells have a flexible and lightweight design, and can be shaped and arranged to fit a wide range of applications. They are typically used in smaller battery packs for electric vehicles, and are often less expensive to manufacture than other cell types.
- Wire - Wire welding involves using metal wires to connect the terminals of adjacent cells. This method is simple and low-cost, but can result in a less secure and less durable connection.
- Laser - Laser welding, uses a high-energy laser to melt the metal at the contact points between adjacent cells, creating a strong and durable bond.
- Commercial Vehicles - Commercial vehicles are motorized road vehicles designed for transporting people or goods. The category includes light commercial vehicles (LCVs) and medium and heavy-duty vehicles (M&HCV).
- Passenger Vehicles - Passenger cars are electric motor– or engine driven vehicles with at least four wheels. These vehicles are used for the transport of passengers and comprise no more than eight seats in addition to the driver’s seat.
- Light Commercial Vehicles - Commercial vehicles that weigh less than 6,000 lb (Class 1) and in the range of 6,001–10,000 lb (Class 2) are covered under this category.
- M&HDT - Commercial vehicles that weigh in the range of 10,001–14,000 lb (Class 3), 14,001–16,000 lb (Class 4), 16,001–19,500 lb (Class 5), 19,501–26,000 lb (Class 6), 26,001–33,000 lb (Class 7) and above 33,001 lb (Class 8) are covered under this category.
| Keyword | Definition |
|---|---|
| Electric vehicle (EV) | A vehicle which uses one or more electric motors for propulsion. Includes cars, buses, and trucks. This term includes all-electric vehicles or battery electric vehicles and plug-in hybrid electric vehicles. |
| PEV | A plug-in electric vehicle is an electric vehicle that can be externally charged and generally includes all electric vehicles as well as plug-electric vehicles as well as plug-in hybrids. |
| Battery-as-a-Service | A business model in which the battery of an EV can be rented from a service provider or swapped with another battery when it runs out of charge |
| Battery Cell | The basic unit of an electric vehicle's battery pack, typically a lithium-ion cell, that stores electrical energy. |
| Module | A subsection of an EV battery pack, consisting of several cells grouped together, often used to facilitate manufacturing and maintenance. |
| Battery Management System (BMS) | An electronic system that manages a rechargeable battery by protecting the battery from operating outside its safe operating area, monitoring its state, calculating secondary data, reporting data, controlling its environment, and balancing it. |
| Energy Density | A measure of how much energy a battery cell can store in a given volume, usually expressed in watt-hours per liter (Wh/L). |
| Power Density | The rate at which energy can be delivered by the battery, often measured in watts per kilogram (W/kg). |
| Cycle Life | The number of complete charge-discharge cycles a battery can perform before its capacity falls under a specified percentage of its original capacity. |
| State of Charge (SOC) | A measurement, expressed as a percentage, that represents the current level of charge in a battery compared to its capacity. |
| State of Health (SOH) | An indicator of the overall condition of a battery, reflecting its current performance compared to when it was new. |
| Thermal Management System | A system designed to maintain optimal operating temperatures for an EV's battery pack, often using cooling or heating methods. |
| Fast Charging | A method of charging an EV battery at a much faster rate than standard charging, typically requiring specialized charging equipment. |
| Regenerative Braking | A system in electric and hybrid vehicles that recovers energy normally lost during braking and stores it in the battery. |
Research Methodology
Mordor Intelligence follows a four-step methodology in all its reports.
- Step-1: Identify Key Variables: To build a robust forecasting methodology, the variables and factors identified in Step-1 are tested against available historical market numbers. Through an iterative process, the variables required for market forecast are set and the model is built based on these variables.
- Step-2: Build a Market Model: Market-size estimations for the historical and forecast years have been provided in revenue and volume terms. Market revenue is calculated by multiplying the volume demand with volume-weighted average battery pack price (per kWh). Battery pack price estimation and forecast takes into account various factors affecting ASP, such as inflation rates, market demand shifts, production costs, technological developments, and consumer preferences, providing estimations for both historical data and future trends.
- Step-3: Validate and Finalize: In this important step, all market numbers, variables, and analyst calls are validated through an extensive network of primary research experts from the market studied. The respondents are selected across levels and functions to generate a holistic picture of the market studied.
- Step-4: Research Outputs: Syndicated Reports, Custom Consulting Assignments, Databases & Subscription Platforms


