South America Dairy Market Size and Share
Market Overview
| Study Period | 2020 - 2030 |
|---|---|
| Base Year For Estimation | 2024 |
| Forecast Data Period | 2025 - 2030 |
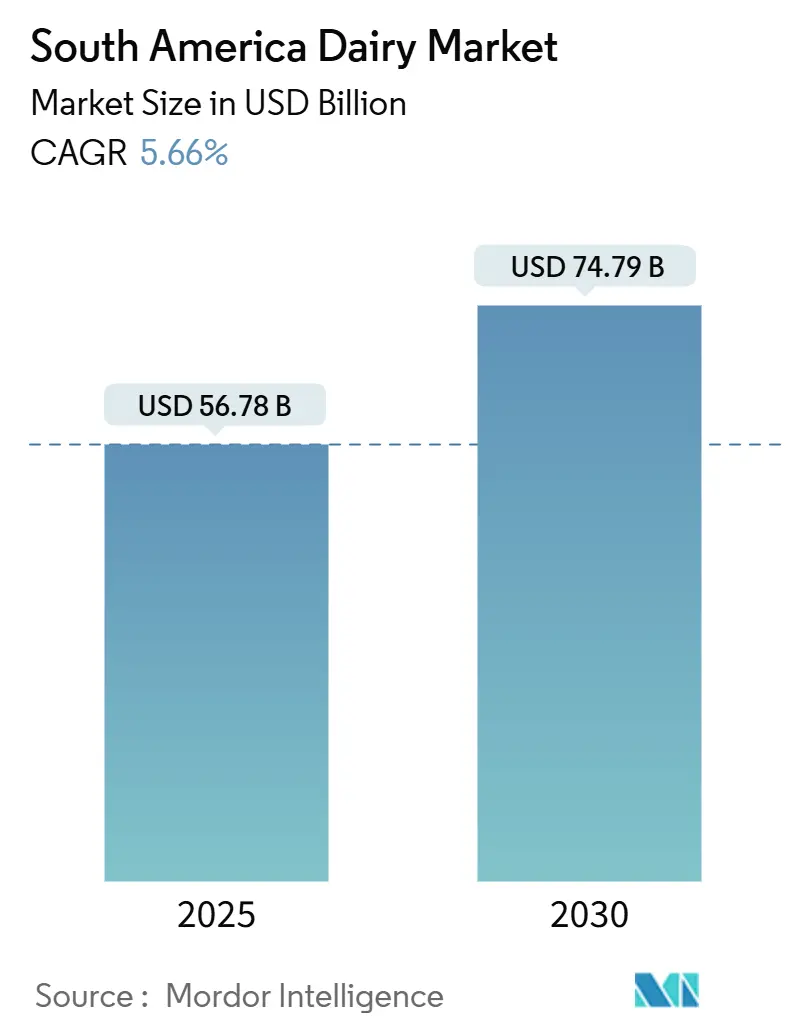
| Market Size (2025) | USD 56.78 Billion |
| Market Size (2030) | USD 74.79 Billion |
| Growth Rate (2025 - 2030) | 5.66% CAGR |
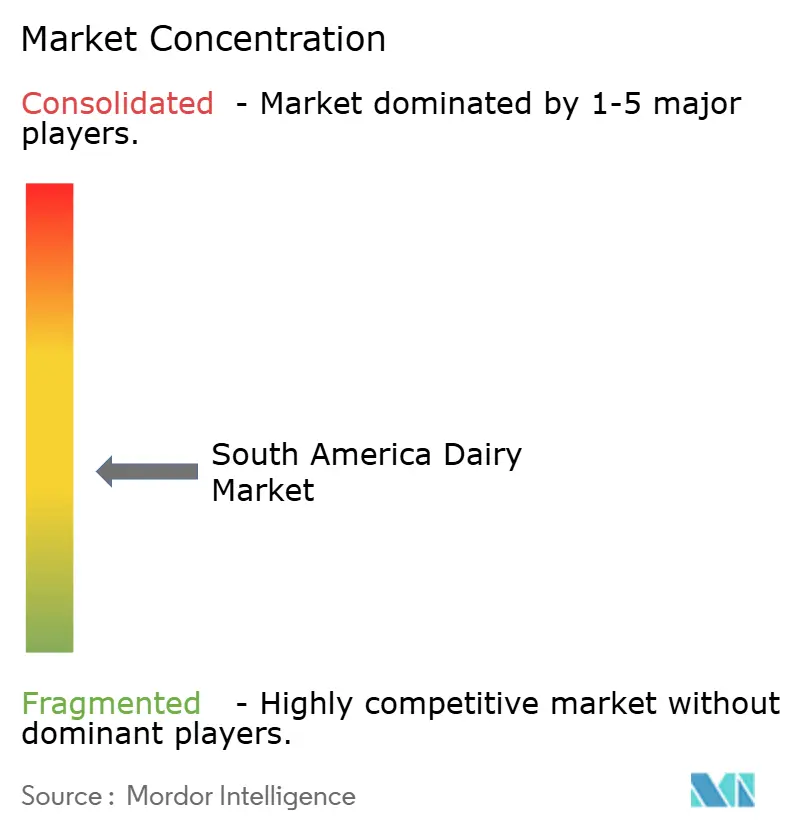
| Market Concentration | Medium |
Major Players
*Disclaimer: Major Players sorted in no particular order Image © Mordor Intelligence. Reuse requires attribution under CC BY 4.0. |
|
South America Dairy Market Analysis by Mordor Intelligence
The South America dairy market size is valued at USD 56.78 billion in 2025 and is projected to reach USD 74.79 billion by 2030, advancing at a 5.66% CAGR over the period. The expansion reflects a convergence of urbanization, nutrition policy, and protein-centric consumer preferences. Brazil, Argentina, and Chile are seeing rapid migration into cities, which tilts purchases toward shelf-stable offerings such as ultra-high-temperature (UHT) milk and ambient yogurt. Volatile weather remains a supply risk because most milk is still produced on rain-fed pasture systems, a weakness exposed by the Rio Grande do Sul floods of 2024. Multinational processors are responding with capital deployments that widen processing capacity and accelerate product innovation in high-protein, lactose-free, and A2 β-casein formats.Overall, favorable demographics, policy backing, and private investment are expected to outweigh episodic disruptions, sustaining mid-single-digit annual growth for the south america dairy market through 2030.
Key Report Takeaways
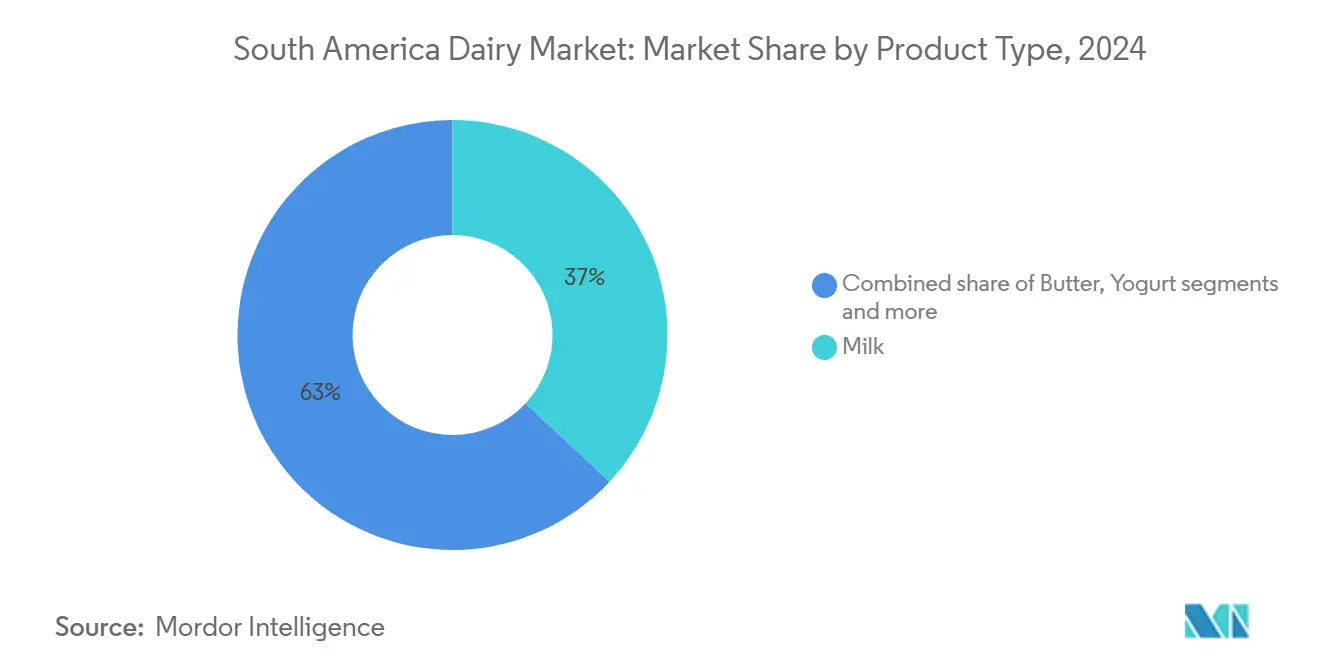
- By product type, milk commanded a 36.96% share of the South America dairy market share in 2024; yogurt is forecast to expand at a 6.43% CAGR to 2030.
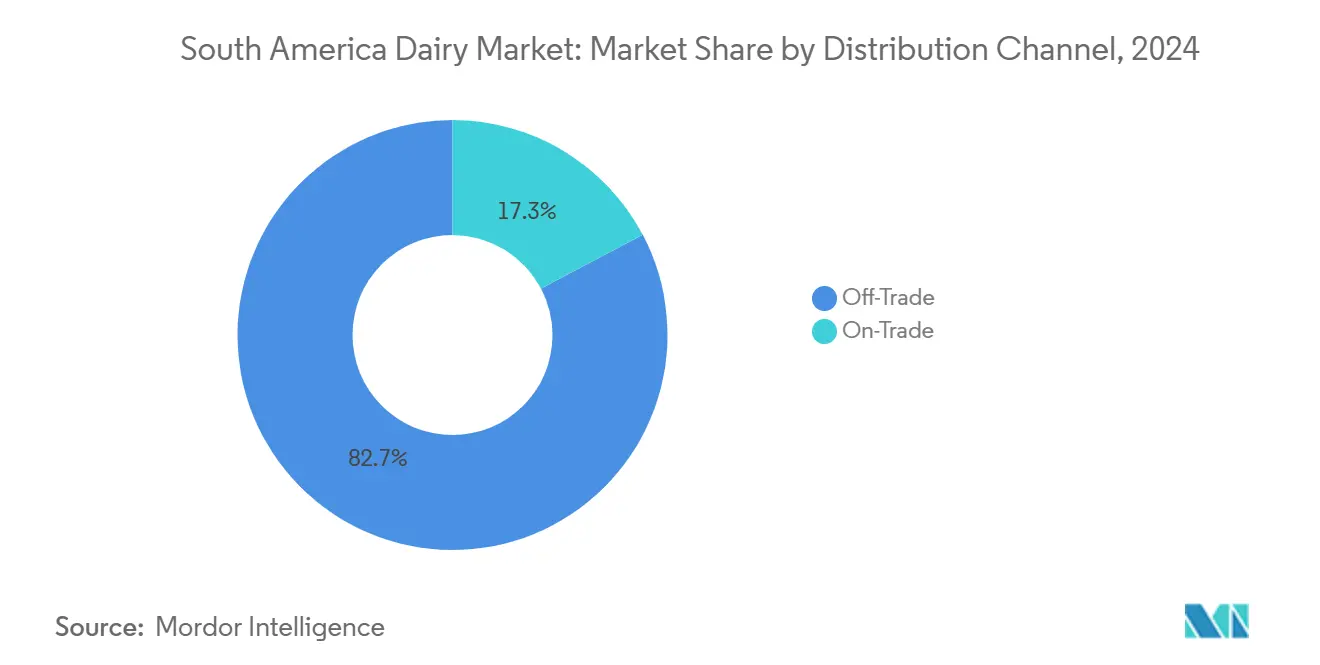
- By distribution channel, off-trade held 82.71% of the South America dairy market size in 2024, while on-trade is projected to grow at a 6.24% CAGR through 2030.
- By geography, Brazil accounted for 61.91% of 2024 revenue; Argentina is expected to record the fastest 5.91% CAGR between 2025 and 2030.
South America Dairy Market Trends and Insights
Drivers Impact Analysis
| Driver | (~) % Impact on CAGR Forecast | Geographic Relevance | Impact Timeline |
|---|---|---|---|
| Rising health consciousness and demand for protein-rich foods | +1.2% | Brazil, Argentina, Chile urban centers with expanding middle class | Medium term (2-4 years) |
| Growth in urbanization and changing dietary habits | +1.0% | Brazil (São Paulo, Rio de Janeiro), Argentina (Buenos Aires), Peru (Lima) | Long term (≥ 4 years) |
| Widespread cultural preference for dairy foods | +0.8% | Argentina, Uruguay, Southern Brazil regions with European heritage | Long term (≥ 4 years) |
| Government health campaigns and favorable initiatives | +0.9% | Brazil, Argentina, Chile | Short term (≤ 2 years) |
| Focus on sustainability/eco-friendly initiatives | +0.6% | Brazil, Argentina, Chile | Medium term (2-4 years) |
| Product innovation (artisanal cheese, fortified milk, packaging) | +1.1% | Brazil, Argentina, Chile | Short term (≤ 2 years) |
| Source: Mordor Intelligence | |||
Rising health consciousness and demand for protein-rich foods
In South America, a surge in health consciousness is significantly driving the growth of the dairy market. Urban middle-income consumers are increasingly recognizing dairy products as an affordable and accessible source of high-quality protein, calcium, and essential micronutrients, which are vital for maintaining a healthy lifestyle. This growing awareness has resulted in a notable rise in the consumption of milk, cheese, yogurt, and fortified dairy drinks. These products are often marketed for their health benefits, such as supporting muscle maintenance, aiding in weight management, and promoting overall wellness. Additionally, this trend has encouraged manufacturers to innovate and expand their value-added product lines. High-protein yogurts, functional milks enriched with additional nutrients, and reduced-sugar options are gaining traction, particularly among fitness-conscious individuals and younger demographics. These developments are evident across key markets such as Brazil, Argentina, Chile, and other countries in the region, reflecting a broader shift in consumer preferences toward healthier and more functional dairy options.
Growth in urbanization and changing dietary habits
Urbanization and evolving dietary preferences are significantly driving the growth of the dairy market in South America. For instance, World Bank data highlights Argentina's urbanization rate reaching 93% in 2024 [1]Source: World Bank, "Urban population (% of total population) - Argentina", data.worldbank.org. This rapid urban shift is fostering a growing demand for convenient, processed dairy products, such as UHT milk, yogurt, and cheese, particularly in urban centers of Brazil, Argentina, and Colombia. Urban consumers increasingly prioritize convenience and shelf-stable options, making these products essential in their daily diets. Additionally, rising middle-class incomes across the region are fueling a shift toward premium and nutritious dairy offerings. Products like single-serve yogurts and fortified milks are gaining traction as they cater to the demand for on-the-go consumption and health-conscious choices. Emerging markets, including Peru and Uruguay, are witnessing notable growth in per capita dairy consumption. This growth is further supported by government-led initiatives aimed at promoting dairy intake, which align with broader health campaigns targeting obesity reduction and overall wellness improvement. These efforts are creating a favorable environment for the expansion of the dairy market in the region.
Government health campaigns and favorable initiatives
Public-sector interventions are reshaping dairy economics across South America, exemplified by Brazil's Plano Safra 2024/25 allocating BRL 400.59 billion (USD 80 billion) in subsidized credit lines to rural producers, including dairy farmers upgrading milking parlors and refrigeration infrastructure [2]Source: United States Department of Agriculture, "Dairy and Products Annual-Brazil", apps.fas.usda.gov, alongside health campaigns promoting dairy to combat obesity, diabetes, high blood pressure, and heart disease in countries like Peru, Paraguay, Ecuador, and Uruguay where per capita intake is projected to rise significantly. These efforts, including subsidies for local producers, modernization of production and storage facilities, and wellness programs, bolster domestic demand and production resilience, as seen in Chile's Q1 2025 milk output surge amid favorable weather and farm investments led by Argentina, Uruguay, and Colombia. Such government support enhances food security, rural employment, and export competitiveness, contributing to the market's growth.
Focus on sustainability/eco-friendly initiatives
Focus on sustainability and eco-friendly initiatives drives the South America dairy market through industry-wide commitments like the Paris Declaration on Sustainable Dairy Development adopted at the IDF World Dairy Summit 2025 in Santiago, Chile the first such event in the region which unites stakeholders from 48 countries to advance climate action, biodiversity, and resource efficiency in line with UN SDGs [3]Source: International Dairy Federation, "IDF World Dairy Summit 2025", fil-idf.org. Chile's Origen Consciente program exemplifies public-private collaboration promoting responsible value-chain practices, while modernized farming in Chile, Argentina, and Uruguay emphasizes efficient management, reduced emissions, and resilient production amid favorable conditions boosting Q1 2025 milk output. These efforts position the region as a global model for sustainable dairy, enhancing consumer trust, rural development, and export appeal in a market prioritizing environmental stewardship.
Restraints Impact Analysis
| Restraint | (~) % Impact on CAGR Forecast | Geographic Relevance | Impact Timeline |
|---|---|---|---|
| Seasonality affecting milk supply | -0.7% | Brazil, Argentina, Uruguay | Short term (≤ 2 years) |
| Rising feed and production costs | -1.1% | Argentina, Brazil, Chile | Short term (≤ 2 years) |
| Challenges with consistent quality and supply | -0.5% | Brazil, Peru, Paraguay | Medium term (2-4 years) |
| Competition from plant-based and imported products | -0.8% | Chile, Colombia, Brazil | Medium term (2-4 years) |
| Source: Mordor Intelligence | |||
Seasonality affecting milk supply
Seasonality affecting milk supply restrains the South America dairy market by causing significant fluctuations in production volumes tied to regional climates and pasture availability, particularly in pasture-dependent systems prevalent in Brazil's Mato Grosso, Argentina, Uruguay, and Chile where output drops sharply during dry seasons due to forage shortages and heat stress on cows. These variations lead to processing underutilization, idle capacity up to 50% in some areas, supply inconsistencies for processors, and price volatility that fails to fully compensate farmers despite heightened demand in low-production periods. Compounding factors like La Niña-induced droughts further exacerbate imbalances, challenging stable commercialization, margins, and year-round availability amid reliance on natural grazing cycles.
Rising feed and production costs
Rising feed and production costs restrain the South America dairy market, driven by volatile input prices for grains, concentrates, and supplements amid reliance on imports and domestic supply fluctuations in key producers like Brazil, Argentina, and Uruguay, where enclosed systems face higher expenses compared to pasture-based operations. Escalating energy, labor, and logistics costs compound pressures on margins, particularly for smaller farms transitioning to modern infrastructure, while economic instability and currency devaluation hinder cost pass-through to consumers despite rising farmgate prices. These challenges limit scalability and profitability, prompting consolidation among larger players and investments in efficiency, yet persist as barriers to sustained growth in a region balancing expansion with input vulnerabilities.
Segment Analysis
By Product Type: Yogurt Leads Growth Amid Functional Innovation
The milk segment holds the largest share in the South American dairy market, commanding 36.96% in 2024. Milk remains a staple product widely consumed across the region, deeply integrated into traditional South American diets and cuisines. In Brazil, where UHT milk penetration exceeds 90%, growth opportunities now focus on flavored and fortified milk variants such as A2 beta-casein and lactose-free options, addressing digestive sensitivities and evolving consumer preferences. This segment benefits from well-established supply chains and strong retail distribution. Brazil and Argentina lead milk consumption due to their substantial dairy production capacity and large population bases. The maturity of the milk segment in urban markets underscores its essential role but also points to a shift toward value-added innovations to sustain growth.
Yogurt is the fastest-growing dairy category with a projected CAGR of 6.43% through 2030, outpacing other product segments in South America. This growth is fueled by manufacturers incorporating high-protein whey isolates, prebiotic fibers, and probiotic strains that appeal to increasingly health-conscious consumers. Spoonable yogurt formats dominate in Brazil and Argentina, driven by traditional breakfast and snack occasions where volume consumption is strong. Meanwhile, drinkable yogurt is gaining popularity in Peru and Chile due to its convenience and suitability for on-the-go consumption, particularly among urban commuters. Innovation in flavor profiles and functional ingredients supports diversification and attracts new consumer segments. This rising demand reflects broader trends toward functional nutrition and lifestyle-aligned eating habits in the region.
Note: Segment shares of all individual segments available upon report purchase
By Distribution Channel: E-Commerce Accelerates Off-Trade Dominance
Off-trade channels command the largest share of the South America dairy market at 82.71% in 2024, aligning with industry reports indicating approximately 85% dominance. This segment encompasses supermarkets, hypermarkets, convenience stores, specialist retailers, and online platforms, which form the backbone of dairy distribution across Brazil, Argentina, and other key markets. The channel's strength derives from extensive modern retail networks led by chains like Walmart and Carrefour, offering wide assortments of milk, cheese, and yogurt at competitive prices. Household consumption drives volume, particularly for staple products like UHT milk with over 90% penetration in Brazil. Off-trade benefits from e-commerce expansion and urban retail infrastructure, ensuring accessibility in both metropolitan and emerging areas. This dominance supports economies of scale for producers and predictable demand patterns amid rising disposable incomes.
On-trade channels represent the fastest-growing distribution segment with a projected 6.24% CAGR through 2030 in the South America dairy market. This growth spans foodservice outlets including restaurants, cafes, hotels, and institutional buyers, capitalizing on expanding out-of-home consumption trends. Premium dairy products like specialized cheeses and yogurts thrive here, fueled by rising cafe culture in cities like São Paulo and Buenos Aires. The channel enables higher margins through innovative offerings such as barista milks and functional yogurts tailored for quick-service environments. Urbanization and tourism further accelerate adoption, with on-trade serving as a testing ground for new flavors and formats. This trajectory reflects broader shifts toward experiential dining and convenience in dynamic South American foodservice landscapes.
Geography Analysis
Brazil commands a 61.91% share in the South America dairy market in 2024. This dominant position is supported by Brazil’s large cattle herd and strong production capacity, particularly in regions like Minas Gerais. The country benefits from a well-established dairy industry infrastructure, extensive domestic consumption, and export capabilities, making it the market leader by a significant margin. The robust retail and foodservice channels facilitate widespread dairy product availability. This extensive production and consumption base ensure Brazil’s central role in shaping regional dairy market trends.
Argentina is forecast to grow at 5.91% through 2030, marking the fastest growth rate in the region. This acceleration is largely influenced by policy changes under the Milei administration, including export-duty suspensions and peso devaluation. These measures have enhanced Argentina’s competitiveness, particularly for whole-milk-powder exports to Algeria, Nigeria, and Brazil. As a result, Argentina’s dairy sector is revitalizing its export potential while stabilizing domestic production and consumption. Investments in technology and improved farming techniques also contribute to this promising growth outlook.
Chile and Peru exhibit distinct market dynamics within the South American dairy landscape. Chilean consumers show a marked preference for the United States dairy brands, driven by perceptions of quality and premium positioning in urban centers. This has resulted in strong demand for imported cheeses, yogurts, and specialty milks. Peru, on the other hand, focuses more on building its domestic dairy production capacity and increasing consumption levels through government initiatives. Both countries are leveraging urbanization and rising incomes to develop their dairy sectors, but their strategies and consumer preferences remain uniquely tailored to local market conditions.
Competitive Landscape
The South America dairy market features a fragmented competitive structure characterized by intense rivalry between multinational processors and regional cooperatives. Global giants such as Lactalis, Nestlé, Danone, and Fonterra leverage their scale, technological capabilities, and extensive distribution networks to secure farmgate milk supply and dominant retail shelf space across Brazil, Argentina, and beyond. These players invest heavily in processing facilities, product innovation, and export infrastructure to maintain market leadership amid rising demand for premium and functional dairy products. Their international expertise enables rapid adaptation to regional preferences, including localized flavors and packaging tailored for urban consumers. Strategic acquisitions and partnerships further strengthen their positions in high-growth segments like yogurt and cheese.
Regional cooperatives including Conaprole, SanCor, Colanta, and Mastellone Hermanos counterbalance multinational influence through deep-rooted farmer ownership models and localized supply chains. These entities excel in securing reliable farmgate procurement from smallholder networks, ensuring cost efficiencies and product authenticity that resonate with traditional South American consumers. Conaprole in Uruguay and SanCor in Argentina dominate local milk powder and cheese production, capitalizing on export opportunities to neighboring markets. Colanta in Colombia focuses on fresh milk and yogurt distribution, while Mastellone Hermanos emphasizes value-added items in Argentina's competitive retail landscape. Their agility in navigating regulatory and economic fluctuations provides a competitive edge in fragmented national markets.
This dual structure fosters dynamic competition that drives innovation, pricing pressures, and supply chain resilience across the region. Multinationals prioritize branded consumer products and e-commerce expansion, while cooperatives emphasize bulk exports and community ties. Ongoing consolidation through mergers, such as Lactalis's regional acquisitions, gradually shifts power dynamics, yet regional players retain strongholds in specific geographies and categories. The interplay ultimately benefits consumers through diverse offerings, improved quality standards, and sustained availability of both staple and premium dairy products.
South America Dairy Industry Leaders
-
Groupe Lactalis
-
Mastellone Hermanos SA
-
Danone S.A.
-
Nestlé S.A.
-
Laticinios Bela Vista Ltda (Piracanjuba)
- *Disclaimer: Major Players sorted in no particular order
Recent Industry Developments
- September 2025: Lactalis invested BRL 400 million in Rio Grande do Sul to expand its plants. This capital injection brought Lactalis's total investments in Brazil's southern state to BRL 1 billion. The plan aimed to achieve a 70% increase in cheese production by 2028.
- March 2025: Lactalis announced a USD 55.3 million investment to expand its dairy production facilities in Brazil’s Paraná state. The announcement coincided with the company’s celebration of ten years of operations in the South American nation. The funds were allocated to support the addition of a new UHT milk production line at the company’s Londrina plant, reinforcing its commitment to the region.
- September 2024: French dairy giant Lactalis invested EUR 16.5 million to expand its operations in Brazil's southernmost state, Rio Grande do Sul. Over the course of 2025, Lactalis planned to bolster its five factories in the region. Lactalis, which operates plants in Ijuí, Santa Rosa, Teutônia, and Três de Maio, with 2 facilities in the latter, is committed to strengthening its partnership with local dairy farmers.
South America Dairy Market Report Scope
Butter, Cheese, Cream, Dairy Desserts, Milk, Sour Milk Drinks, Yogurt are covered as segments by Category. Off-Trade, On-Trade are covered as segments by Distribution Channel. Argentina, Brazil are covered as segments by Country.| Butter | Salted Butter | |
| Unsalted Butter | ||
| Cheese | Natural Cheese | Cheddar |
| Cottage | ||
| Ricotta | ||
| Parmesan | ||
| Others | ||
| Cream | Fresh Cream | |
| Cooking Cream | ||
| Whipping Cream | ||
| Others (Clotted, Sour Cream) | ||
| Dairy Desserts | Ice Cream | |
| Cheesecakes | ||
| Frozen Desserts | ||
| Others (Pudding/desserts, triffles) | ||
| Milk | Condensed Milk | |
| Flavored Milk | ||
| Fresh Milk | ||
| UHT Milk (Ultra-high temperature milk) | ||
| Powdered Milk | ||
| Yogurt | Drinkable | |
| Spoonable | ||
| Sour Milk Drinks | ||
| Off-Trade | Supermarkets and Hypermarkets |
| Convenience Stores | |
| Online Retail | |
| Specialist Retailers | |
| Others | |
| On-Trade |
| Brazil |
| Argentina |
| Chile |
| Peru |
| Rest of South America |
| By Product Type | Butter | Salted Butter | |
| Unsalted Butter | |||
| Cheese | Natural Cheese | Cheddar | |
| Cottage | |||
| Ricotta | |||
| Parmesan | |||
| Others | |||
| Cream | Fresh Cream | ||
| Cooking Cream | |||
| Whipping Cream | |||
| Others (Clotted, Sour Cream) | |||
| Dairy Desserts | Ice Cream | ||
| Cheesecakes | |||
| Frozen Desserts | |||
| Others (Pudding/desserts, triffles) | |||
| Milk | Condensed Milk | ||
| Flavored Milk | |||
| Fresh Milk | |||
| UHT Milk (Ultra-high temperature milk) | |||
| Powdered Milk | |||
| Yogurt | Drinkable | ||
| Spoonable | |||
| Sour Milk Drinks | |||
| By Distribution Channel | Off-Trade | Supermarkets and Hypermarkets | |
| Convenience Stores | |||
| Online Retail | |||
| Specialist Retailers | |||
| Others | |||
| On-Trade | |||
| By Country | Brazil | ||
| Argentina | |||
| Chile | |||
| Peru | |||
| Rest of South America | |||
Market Definition
- Butter - Butter is a yellow-to-white solid emulsion of fat globules, water, and inorganic salts produced by churning the cream from cows’ milk
- Dairy - Dairy product include milk and any of the foods made from milk, including butter, cheese, ice cream, yogurt, and condensed and dried milk.
- Frozen Desserts - Frozen dairy dessert means and includes products containing milk or cream and other ingredients which are frozen or semi-frozen prior to consumption, such as ice milk or sherbet, including frozen dairy desserts for special dietary purposes, and sorbet
- Sour Milk Drinks - Sour milk is thick, curdled milk, with a sour taste, obtained from the fermentation of milk. Sour milk drinks such as kefir, laban, buttermilk have been considered in the study
| Keyword | Definition |
|---|---|
| Cultured Butter | Cultured butter is prepared by having the raw butter go through chemical processing and has been added with certain emulsifiers and foreign ingredients. |
| Uncultured Butter | This type of butter is one which has not been processed in any way |
| Natural Cheese | The type of cheese in its most natural form. It is made from natural and simple products and ingredients, including fresh and natural salts, natural colors, enzymes, and high-quality milk. |
| Processed Cheese | Processed cheese undergoes the same processes as natural cheese; however, it requires more steps and many different forms of ingredients. Making processed cheese involves melting natural cheese, emulsifying it, and adding preservatives and other artificial ingredients or colorings. |
| Single Cream | Single cream contains around 18% fat. It’s a single layer of cream that appears over boiled milk. |
| Double Cream | Double cream contains 48% fat, more than double the amount of fat of single cream. It’s heavier and thicker than single cream |
| Whipping Cream | This has a much higher fat percentage than single cream (36%). Used to top cakes, pies, and puddings and as a thickener for sauces, soups, and fillings. |
| Frozen Desserts | Desserts that are meant to be eaten in frozen condition. E.g., sherbets, sorbets, frozen yogurts |
| UHT Milk (Ultra-high temperature milk) | Milk heated at a very high temperature. Ultra-high-temperature processing (UHT) of milk involves heating for 1–8 sec at 135–154°C. which kills the spore-forming pathogenic microorganism, resulting in a product with a shelf-life of several months. |
| Non-dairy butter/Plant-based butter | Butter made from plant-derived oil such as coconut, palm, etc. |
| Non-dairy Yogurt | Yogurt made from typically made from nuts, like almonds, cashews, coconuts, and even other foods like soybeans, plantains, oats, and peas |
| On-trade | It refers to restaurants, QSRs, and bars. |
| Off-trade | It refers to supermarkets, hypermarkets, on-line channels, etc. |
| Neufchatel cheese | One of the oldest kinds of cheese in France. It is a soft, slightly crumbly, mold-ripened, bloomy-rind cheese made in the Neufchâtel-en-Bray region of Normandy. |
| Flexitarian | It refers to a consumer preferring a semi-vegetarian diet, that is centered on plant foods with limited or occasional inclusion of meat. |
| Lactose Intolerance | Lactose intolerance is a reaction in digestive system to lactose, the sugar in milk. It causes uncomfortable symptoms in response to the consumption of dairy products. |
| Cream Cheese | Cream cheese is a soft and creamy fresh cheese with a tangy taste made from milk and cream. |
| Sorbets | Sorbet is a frozen dessert made using ice combined with fruit juice, fruit purée, or other ingredients, such as wine, liqueur, or honey. |
| Sherbet | Sherbet is a sweetened frozen dessert made with fruit and some sort of dairy product such as milk or cream. |
| Shelf stable | Foods that can be safely stored at room temperature, or "on the shelf," for at least one year and do not have to be cooked or refrigerated to eat safely. |
| DSD | Direct Store Delivery is the process in supply chain management wherein the product is delivered from manufacturing plant directly to the retailer. |
| OU Kosher | Orthodox Union Kosher is a kosher certification agency based in New York City. |
| Gelato | Gelato is a frozen creamy dessert made with milk, heavy cream and sugar. |
| Grass-fed Cows | Grass-fed cows are allowed to graze in pastures, where they eat a variety of grasses and clover. |
Research Methodology
Mordor Intelligence follows a four-step methodology in all our reports.
- Step-1: Identify Key Variables: In order to build a robust forecasting methodology, the variables and factors identified in Step 1 are tested against available historical market numbers. Through an iterative process, the variables required for market forecast are set, and the model is built on the basis of these variables.
- Step-2: Build a Market Model: Market-size estimations for the forecast years are in nominal terms. Inflation is not a part of the pricing, and the average selling price (ASP) is kept constant throughout the forecast period for each country.
- Step-3: Validate and Finalize: In this important step, all market numbers, variables, and analyst calls are validated through an extensive network of primary research experts from the market studied. The respondents are selected across levels and functions to generate a holistic picture of the market studied.
- Step-4: Research Outputs: Syndicated Reports, Custom Consulting Assignments, Databases & Subscription Platforms


