
Market Overview
| Study Period | 2021 - 2031 |
|---|---|
| Forecast Data Period | 2026 - 2031 |
| Base Year Market Size (2025) | USD 27.55 Billion |
| Market Size (2026) | USD 29.40 Billion |
| Market Size (2031) | USD 40.70 Billion |
| Growth Rate (2026 - 2031) | 6.72 % |
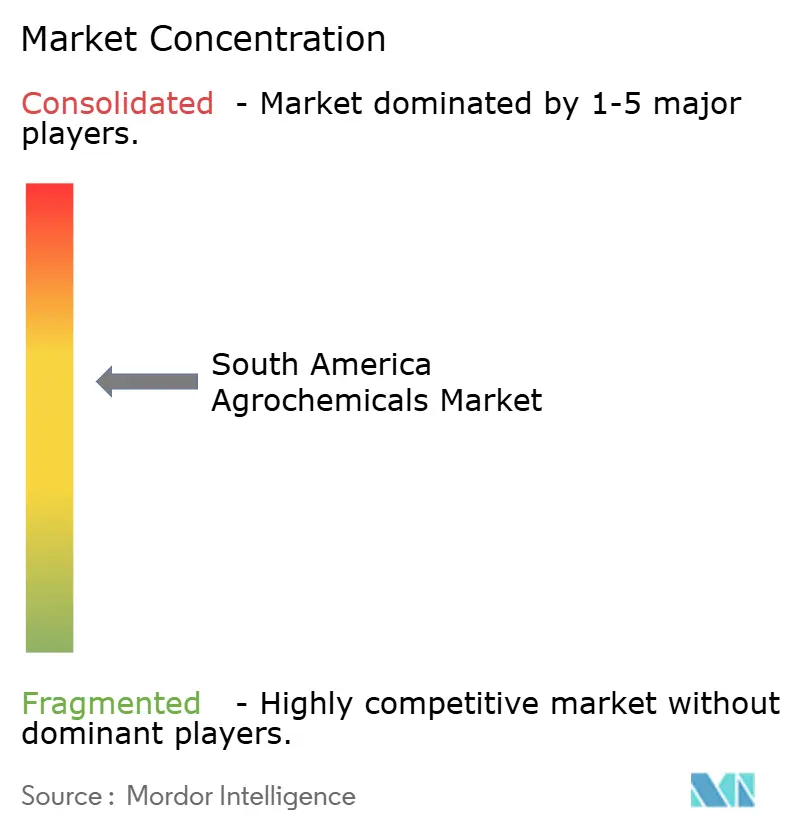
| Market Concentration | Medium |
Major Players *Disclaimer: Major Players sorted in no particular order Image © Mordor Intelligence. Reuse requires attribution under CC BY 4.0. | |
South America Agrochemicals Market Analysis by Mordor Intelligence
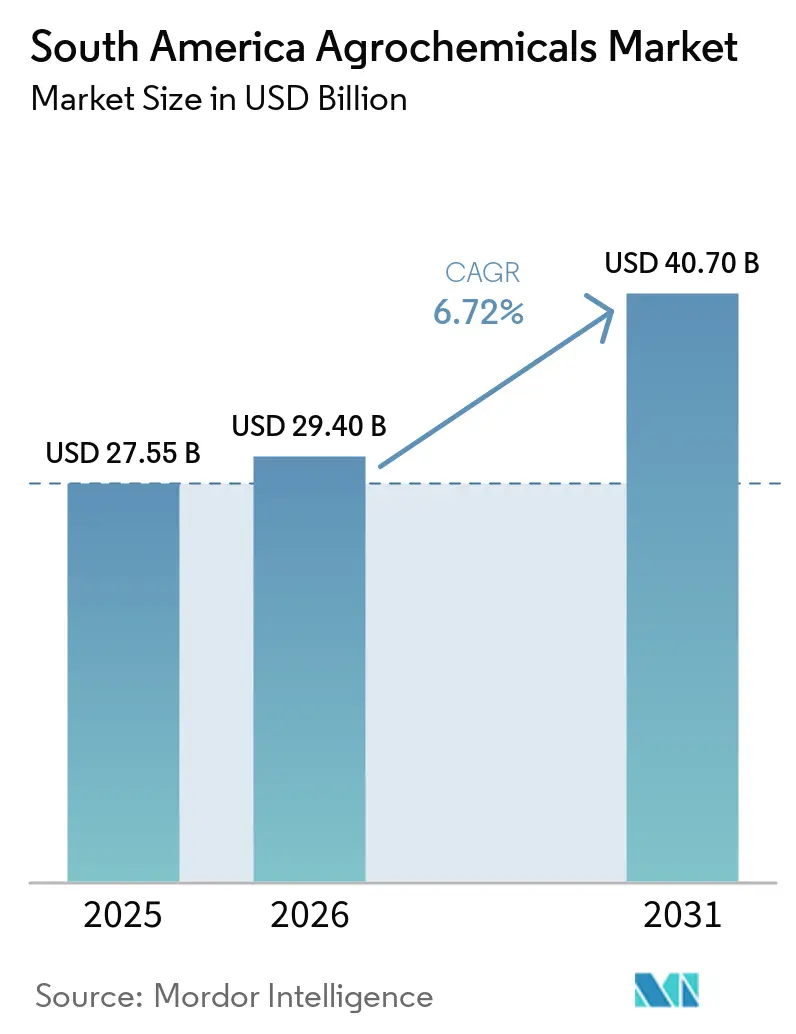
The South America agrochemicals market size was valued at USD 27.55 billion in 2025 and is estimated to reach USD 29.40 billion in 2026, further projected to grow to USD 40.70 billion by 2031, expanding at a CAGR of 6.72% over the forecast period (2026–2031). Rising soybean acreage in Brazil and Argentina, near-universal uptake of herbicide-tolerant seeds, and zero-tariff fertilizer imports in Brazil continue to anchor volume growth. Rapid adoption of fertigation and precision-spray systems is shifting demand toward liquid formulations and premium selective chemistries. Multinational companies are localizing formulation capacity to offset inland logistics delays, while regulatory phase-outs of paraquat, 2,4-D, and organophosphates are prompting a shift toward alternative chemical solutions. Export-oriented specialty crops in Chile and Peru are driving intensified fungicide and micronutrient programs to meet strict residue limits in North America and European markets.
Key Report Takeaways
- By product type, crop protection chemicals led with 65.8% of the South America agrochemicals market share in 2025, while adjuvants are projected to expand at a 9.2% CAGR through 2031.
- By crop type, the oilseeds and pulses segment commanded 35.4% share of the South America agrochemicals market in 2025, whereas fruits and vegetables are forecast to grow at an 8.3% CAGR through 2031.
- By country, Brazil captured 65.4% of the South America agrochemicals market size in 2025, yet Colombia is projected to register the fastest 7.6% CAGR through 2031.
Note: Market size and forecast figures in this report are generated using Mordor Intelligence’s proprietary estimation framework, updated with the latest available data and insights as of January 2026.
Market Trends and Insights
Drivers Impact Analysis of South America Agrochemicals Market*
| Driver | (~) % Impact on CAGR Forecast | Geographic Relevance | Impact Timeline |
|---|---|---|---|
| Expansion of soybean cultivation area | +1.8% | Brazil (Mato Grosso and Goiás) and Argentina (Pampas) | Medium term (2-4 years) |
| Adoption of herbicide-tolerant biotech seeds | +1.4% | Brazil, Argentina, and Paraguay border zones | Short term (≤ 2 years) |
| Government fertilizer subsidy programs | +1.1% | Brazil (zero-tariff) and Colombia (smallholder support) | Short term (≤ 2 years) |
| Growth in export-oriented specialty crops | +0.9% | Chile (blueberries, and grapes) and Peru (avocados and mangoes) | Medium term (2-4 years) |
| Climate-linked crop-insurance uptake | +0.6% | Brazil (Cerrado) and Argentina (drought zones) | Long term (≥ 4 years) |
| AI-driven precision-spraying technologies | +0.5% | Brazil (large estates) and Argentina (cooperatives) | Long term (≥ 4 years) |
| Source: Mordor Intelligence | |||
Expansion of soybean cultivation area
Brazil planted 46.2 million ha of soybeans in the 2024-2025 season, up 3.8% year on year, and Argentina reached 16.8 million ha in 2025, reversing prior drought losses. Larger acreage lifts herbicide volumes because each hectare receives 2-3 sequential applications, including glyphosate, residual pre-emergents, and burndown chemistries. Fertilizer demand is increasing steadily. The average NPK usage in Brazilian soybean cultivation rose to 185 kg per hectare in 2025, compared to 168 kg per hectare in 2020[1]. The intensified soy-corn double-crop model compresses spray windows, favoring ready-to-mix liquids applied via high-clearance sprayers. Herbicide-tolerant varieties now cover 97% of Brazilian soybean hectares, enabling over-the-top applications that streamline weed control but spur resistance in Amaranthus species.
Adoption of Herbicide-Tolerant Biotech Seeds
Glyphosate- and glufosinate-tolerant traits dominated the majority of soybean seed sales in Argentina and Brazil during the 2025 planting season. Corteva’s Enlist E3 platform gained a higher market share in Brazil, lifting sales of complementary herbicides Enlist One and Enlist Duo. BASF’s Credenz varieties with Xtend technology captured larger Argentine acreage, boosting Engenia volumes. Trait-chemistry linkages lock in recurring revenue for integrated suppliers but concentrate purchasing power among large growers that negotiate discounts. The use of certified seeds in Paraguay increased significantly between 2023 and 2025, driven by cooperatives offering bundled packages that included seeds, herbicides, and credit.
Government fertilizer subsidy programs
Brazil’s zero-tariff policy for potassic and nitrogenous fertilizers through December 2026 cut muriate-of-potash landed costs by 18% in 2025 versus 2021[2]. Colombia allocated COP 150 billion (USD 37 million) to subsidize fertilizer for smallholder coffee and cocoa producers in 2025. Argentina introduced province-level tax rebates covering up to 15% of balanced NPK costs for growers who submit soil tests, lifting soil-testing volumes by 28% in participating provinces. These incentives lower growers’ price sensitivity and sustain application rates even when global prices are volatile.
Climate-linked crop-insurance uptake
The Brazilian government’s Rural Insurance Premium Subsidy Programme (PSR) has been instrumental in subsidizing 20-45% of insurance premiums, thereby making insurance coverage more accessible to many smallholder farmers. Insurers often require insured farmers to follow recommended fungicide and fertility programs, indirectly boosting agrochemical demand. Argentina relaunched its crop insurance subsidy in 2025, budgeting USD 80 million to cover 30% of premiums for soybean, corn, and wheat growers. Satellite-based indices accelerate parametric payouts, while bundled micro-insurance options expand coverage to smallholders.
Restraints Impact Analysis of South America Agrochemicals Market*
| Restraint | (~) % Impact on CAGR Forecast | Geographic Relevance | Impact Timeline |
|---|---|---|---|
| Stricter bans on synthetic active ingredients | -1.2% | Brazil (Brazilian National Health Surveillance Agency) and Argentina (National Agri-Food Health and Quality Service) | Medium term (2-4 years) |
| Volatile raw-material costs | -0.9% | Import-dependent Chile and Peru | Short term (≤ 2 years) |
| Rising herbicide resistance in key weeds | -0.7% | Brazil (Cerrado) and Argentina (soy belt) | Long term (≥ 4 years) |
| Amazon corridor logistics bottlenecks | -0.5% | Brazil (Mato Grosso and Pará) | Medium term (2-4 years) |
| Source: Mordor Intelligence | |||
Stricter Bans on Synthetic Active Ingredients
Brazilian National Health Surveillance Agency (ANVISA) scheduled paraquat phase-out by December 2026 and restricted 2,4-D use to closed systems by 2027. Paraquat represented 8% of Brazilian herbicide volume in 2024. Substitution with glufosinate or saflufenacil raises per-hectare costs by up to 50% and requires new application timing. National Service of Agri-Food Health and Quality SENASA (Argentina) announced bans on chlorpyrifos and carbofuran by mid-2027, impacting corn and sugarcane insecticide programs. Compliance investments favor large farms. Smaller growers may cut application frequency, risking yield losses.
Volatile Raw-Material Costs (Oil-Derived Intermediates)
Crude prices fluctuated between USD 72 and USD 89 per barrel in 2025, swinging naphtha costs by 31%. Chilean distributors import 85-90% of formulations, so currency depreciation raised landed costs. Argentine natural gas spikes to USD 6.20 per million British Thermal Units in Q2 2025, forcing local urea plants to curtail output, increasing reliance on imports. Volatility makes growers delay purchases, creating erratic demand and pressuring distributors working capital.
*Our forecasts treat driver/restraint impacts as directional, not additive. The impact forecasts reflect baseline growth, mix effects, and variable interactions.
South America Agrochemicals Market Segment Analysis
By Product Type:
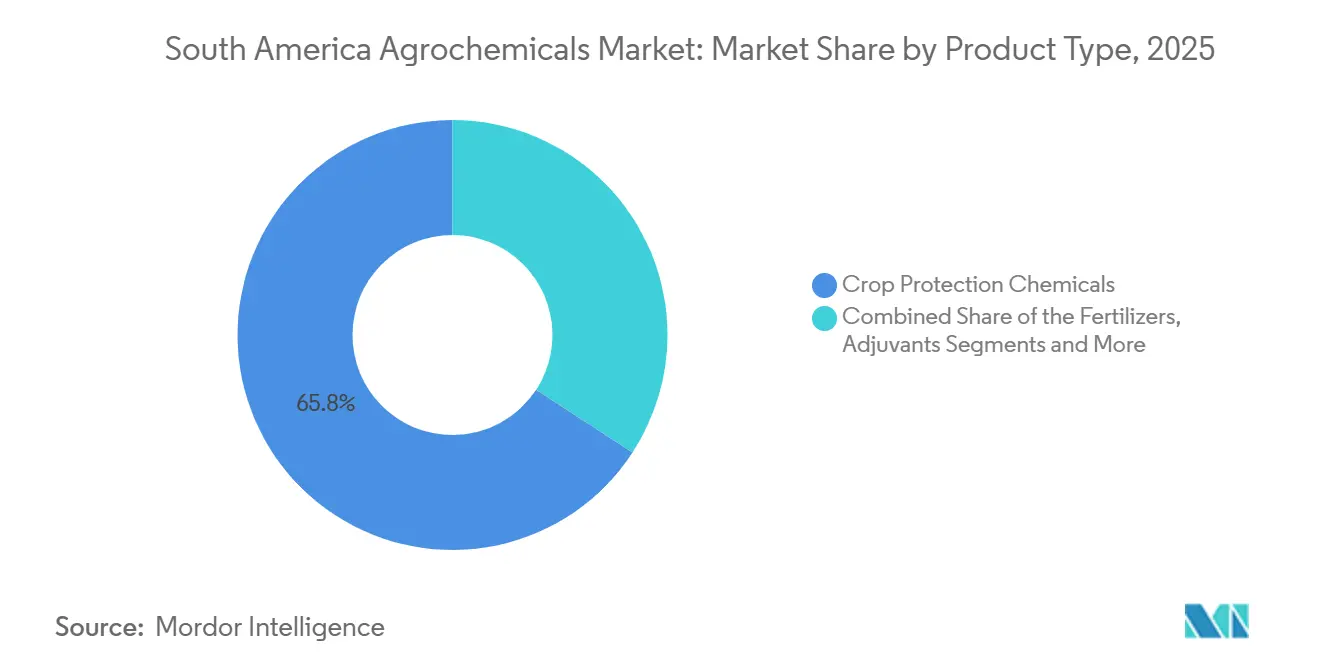
Crop Protection Dominates While Adjuvants Lead GrowthSouth America crop protection chemicals dominated the market in 2025, contributing 65.8% of product-type revenue. This emphasizes the role of herbicides, insecticides, fungicides, and other pesticides in protecting vast hectares of crops across the region. Fertilizers accounted for the next largest market share of revenue, supported by Brazil's zero-tariff import policy, which ensured high urea and potash volumes despite global price fluctuations. Adjuvants, while comprising a smaller share, emerged as the fastest-growing segment. This segment is projected to grow at a 9.2% CAGR through 2031, driven by the adoption of precision-spraying systems, drone applications, and the demand for advanced surfactants, drift-control agents, and pH conditioners in increasingly complex tank mixes.
Within crop protection, herbicides remain the key driver of demand, supported by herbicide-tolerant soybean systems. Insecticides and fungicides continue to play a vital role due to pest and disease pressures affecting crops such as cotton, corn, soybeans, grapes, and other high-value crops. Adjuvant growth is closely associated with the adoption of spot-spraying and variable-rate technologies, which boost adjuvant usage per treated hectare. Fertilizers continue to gain traction, particularly in nitrogenous and potassic products, supported by favorable policies and consistent demand. Plant growth regulators, while accounting for niche market value, show steady growth due to their high margins and expanding applications in sugarcane and export-oriented fruit crops. This niche segment is anticipated to experience specialized growth through 2031.

By Crop Type:
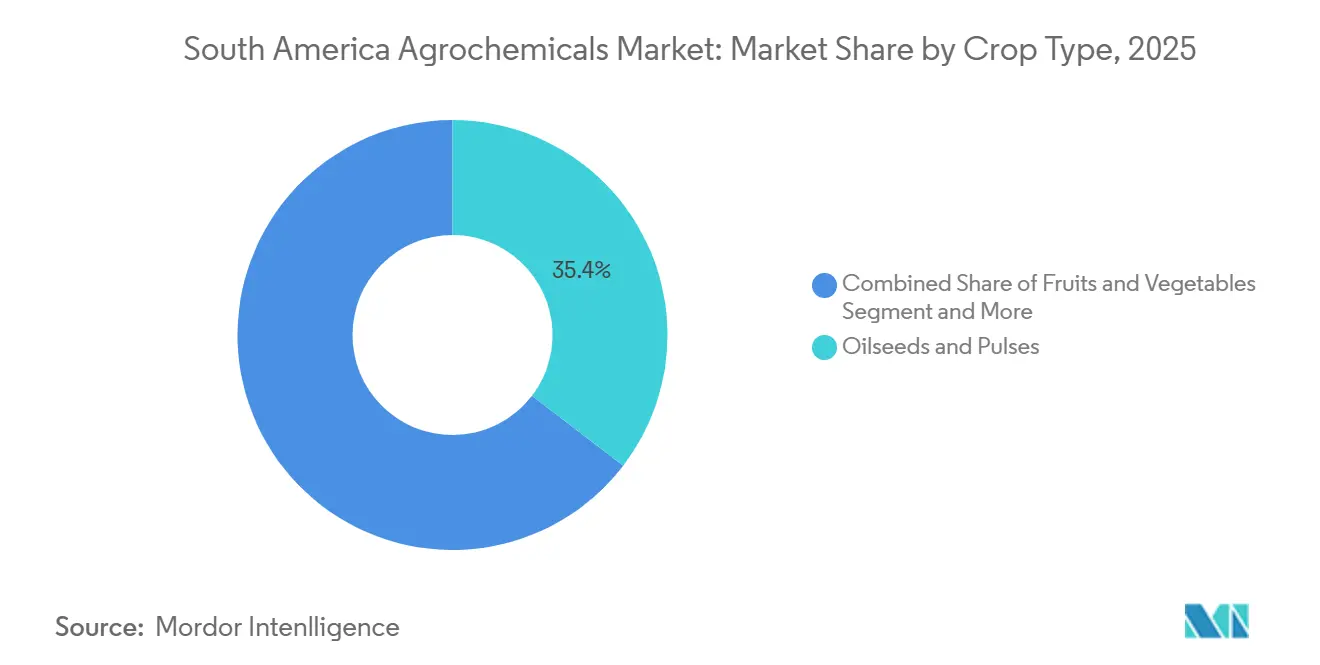
Specialty Crops Outpace Commodity GrainsOilseeds and pulses led revenue at 35.4% of the South America agrochemicals market size in 2025, with soybeans dominating herbicide and inoculant demand. Fruits and vegetables are forecast to grow at a CAGR of 8.3% during the forecast period 2026–2031, the fastest among crop types, supported by export-driven horticulture. The South America agrochemicals market share for fruits and vegetables is projected to reach a significant share by 2031. Cereals and grains held a significant share, while commercial crops like sugarcane and coffee contributed notably.
Blueberry growers in Chile averaged 9 fungicide sprays per season in 2025, up 18% from 2022 levels. Peruvian avocado plantations added 8,600 ha and rely on fertigation, lifting soluble fertilizer sales by 31%. Colombian coffee rehabilitation distributed 142 million rust-resistant seedlings, each requiring seed treatment and foliar micronutrients. Argentine wheat farmers boosted triazole fungicide use by 18% to curb Fusarium head blight.
Geography Analysis
Mato Grosso Agrochemicals Market
Brazil captured 65.4% of the South America agrochemicals market revenue in 2025. Mato Grosso alone accounted for 28% of national volumes due to intensive soy-corn rotations that average 185 kg NPK per ha[3]. Goiás and Mato Grosso do Sul added 1.8 million ha of soybeans from 2023-2025, intensifying herbicide resistance issues that drive multi-mode programs. Bayer committed USD 150 million in March 2025 to enlarge its Belford Roxo fungicide plant, underscoring confidence despite regulatory headwinds.
Argentina and Colombia Agrochemicals Market
Argentina accounted for a substantial share of regional revenue in 2025, achieving notable year-on-year growth following currency stabilization, which facilitated the import of inputs. This economic improvement enabled greater access to agricultural resources, supporting the modernization of farming practices. The adoption of variable-rate technologies witnessed significant expansion, reflecting increased technological integration and efficiency in agricultural operations, which contributed to enhanced productivity and resource management. Colombia is the fastest-growing geography, projected to expand at a CAGR of 7.6% during 2026–2031, driven by coffee renovation and 6,800 ha of new avocado orchards.
South America Agrochemicals Market
Chile’s revenue grew 6.8% in 2025 as driven by intensified fungicide programs aimed at meeting stricter European Union residue limits. These programs are being implemented to ensure compliance with evolving regulations and to maintain access to key export markets. Peru is projected to expand, supported by increased avocado and blueberry acreage that depends on fertigation, a method that enhances nutrient delivery and water efficiency. The rest of South America, led by Paraguay and Bolivia, collectively contributes to the remaining revenue share. Paraguay has seen a rise in certified HT seed adoption, which is improving crop yields and resilience, while Bolivia is adding 120,000 hectares of soybeans to boost its agricultural output and meet growing demand.
Regulatory Landscape
South American agrochemical regulation is tightening around health and environmental risk, while also moving toward more formalized, traceable submission and oversight processes. In Brazil, Law 14.785/2023 reinforces the federal registration framework with independent evaluation by MAPA (agriculture), IBAMA (environment), and ANVISA (health). From September 15, 2025, pesticide registration requests have been filed through MAPA as the single entry point that routes dossiers to IBAMA and ANVISA.
Across the region, regulators are updating procedural manuals and raising compliance expectations for registrants, formulators, and distributors. Argentina updated its phytosanitary product registration procedures through SENASA Resolution 458/2025, consolidating criteria and scopes within a revised manual and reinforcing the role of the National Registry of Phytosanitary Products in auditing establishments involved in formulation and commercialization. In Peru, agricultural pesticide registration requires an environmental risk assessment and a technical environmental report from the competent agrarian environmental authority, with non-compliance exposing companies to sanctions defined in Tax Units (UIT).
Competitive Landscape
The top five companies accounted for a significant portion of the market, reflecting moderate market concentration. Bayer AG leads the market, driven by its integrated seed and chemistry portfolio. Syngenta Group follows closely, supported by its broad-spectrum fungicide offerings. BASF SE holds a strong position, bolstered by its capacity expansion at Guaratinguetá. Corteva Agriscience's market presence is attributed to its Enlist traits and complementary herbicides, while FMC Corporation's position is supported by its diamide insecticides.
Localization is a core strategy. Multinational plants near São Paulo reduce dependency on congested Amazon corridors that add up to 15 days to inbound shipments. Syngenta’s November 2024 patent for microencapsulated herbicides aims to stretch residual activity by 30%. Digital agronomy platforms are emerging as tie-breakers among tech-forward cooperatives, with firms offering satellite disease forecasts and variable-rate prescriptions capturing incremental share.
Regional specialists are entering previously untapped categories. Lavoro capitalizes on its distribution network to offer bundled adjuvants and plant growth regulators, which represent a smaller portion of revenue but deliver strong margins. UPL Ltd., Nutrien Ltd., and Yara International ASA are enhancing fertilizer supply chains through long-term import agreements and the development of new terminals to address raw material volatility.
South America Agrochemicals Industry Leaders
-
BASF SE
-
Corteva Agriscience
-
FMC Corporation
-
Bayer AG
-
Syngenta Group
- *Disclaimer: Major Players sorted in no particular order
South America Agrochemicals Market Companies Covered in this Report
- Bayer AG
- Syngenta Group
- BASF SE
- Corteva Agriscience
- FMC Corporation
- UPL Ltd.
- Sumitomo Chemical Co., Ltd.
- Nufarm Ltd.
- Nutrien Ltd.
- Yara International ASA
- Lavoro Agro Holding S.A.
- Haifa Negev technologies LTD
- Albaugh LLC
- Compo Expert Brasil Fertilizantes Ltda. (Azoty Group S.A)
Market Opportunities and Future Outlook
Active-ingredient phase-outs and tighter registration scrutiny are accelerating product substitution and portfolio upgrades, with particular room for selective herbicides, resistance-management programs, and higher-value formulations suited to compressed spray windows in soy and corn systems. In Brazil, the paraquat phase-out scheduled by December 2026, along with closed-system requirements for 2,4-D use (by 2027), is pushing growers and distributors to re-optimize tank mixes and application sequences. That shift supports demand for compatible adjuvants and newer modes of action. Brazil's market scale also supports faster commercialization cycles for differentiated products, alongside continued approvals, including hundreds of chemical and biological registrations approved by mid-2026.
Biologicals and localized specialty-input manufacturing are moving from niche to scaled deployment, supported by visible investments and partnerships in Brazil and across the Southern Cone. Corteva expanded biological R&D capacity in Sao Paulo state (Mogi Mirim) and started domestic production of its Stimulate 10X bio-regulator at Cosmopolis, while BASF completed the acquisition of AgBiTech to strengthen biological insect control capabilities with emphasis on Brazil. On the nutrition side, large fertilizer projects are opening a parallel opportunity around supply security and tailored blends for fertigation-heavy horticulture and double-cropping row crops. Atome reached Final Investment Decision for a USD 665 million green fertilizer plant in Villeta, Paraguay with offtake secured by Yara International, and Petrobras signed contracts tied to completing the UFN-III nitrogen fertilizer plant in Três Lagoas (Mato Grosso do Sul), supporting more reliable regional nitrogen availability for high-application systems.
Recent Industry Developments in South America Agrochemicals Market
- July 2026: Corteva began domestic production of the bio-regulator Stimulate 10X at its Cosmopolis unit in Sao Paulo, citing a production capacity of 135 million liters per year. Local manufacturing improves lead times and supply reliability for biological and bio-based inputs, aligning with the shift toward higher-frequency, program-based applications in Brazilian row crops.
- June 2026: FMC Corporation and Corteva entered a co-exclusive strategic supply and license agreement for FMC’s rimisoxafen herbicide technology across corn and soybean markets in North and South America. The structure, including an upfront prepurchase payment by Corteva, is designed to accelerate access to a differentiated herbicide mode of action in a region where resistance management is driving upgrades in weed-control programs.
- May 2024: FMC Corporation obtained registration in Brazil for the Azugro and Ezanya herbicides for use in cotton, tobacco, and wheat. The approvals add additional labeled options for growers managing resistant weed pressure and broaden FMC’s addressed crop footprint in Brazil.
South America Agrochemicals Market Report Scope and Research Methodology
Market Definition and Coverage
For this methodology, the South America agrochemicals market is defined as the value of agricultural input chemicals used to improve crop yield and crop protection across South American farming systems, tracked in USD across the study period.
Scope exclusions: We exclude on-farm application service fees and farm equipment, and we also exclude raw crop commodity value and downstream food processing revenues.
Segments Covered in This Report
- By Product Type
- Fertilizers
- Nitrogenous
- Phosphatic
- Potassic
- Other Fertilizers
- Crop Protection Chemicals
- Herbicides
- Insecticides
- Fungicides
- Other Pesticides
- Adjuvants
- Plant Growth Regulators
- Fertilizers
- By Crop Type
- Cereals and Grains
- Oilseeds and Pulses
- Fruits and Vegetables
- Commercial Crops
- Turf and Ornamentals
- By Country
- Brazil
- Argentina
- Colombia
- Chile
- Peru
- Rest of South America
Data Sources, Market Sizing, and Validation
Desk Research
Desk research was used to anchor the model to measurable, repeatable signals about crop area, planted seasons, and input intensity by crop. We relied on public and official sources such as FAOSTAT, UN Comtrade trade statistics, USDA and national agriculture ministry releases, and pesticide and fertilizer regulatory portals where registrations and active ingredients are listed.
In parallel, we reviewed company annual reports, investor presentations, and credible press coverage to understand pricing direction, channel inventory shifts, and major product mix changes. Where needed, we used paid subscriptions for company financials and a paid import-export shipment-level database to sanity-check trade flows and supplier exposure by country. This helps reduce overcounting when products are re-exported. These sources are not exhaustive, and many other public documents and data tables were also used for collection, validation, and clarification.
Primary Interviews and Surveys
We use expert interviews and surveys with agrochemical producers, distributors, agronomists, crop advisers, and farm input managers across South America. Their views help check secondary data, fill gaps in product pricing and adoption, and test the assumptions used in the final analysis.
Distribution of primary research fieldwork respondents
| Company type | Respondent position |
|---|---|
| Top tier: 27% | CXOs: 15% |
| Mid tier: 48% | Functional/Unit leaders: 35% |
| Smaller Players: 25% | Managers: 50% |
Market-Sizing & Forecasting
The core model starts with a top-down build where crop area and cropping intensity, by key South American crops, are reconstructed into an input demand pool and then translated into value using country-level price and mix assumptions. We then cross-check results with selective bottom-up approximations, such as supplier revenue exposure to the region, channel checks on inventory corrections, and sampled price-per-hectare times treated area to adjust totals.
A few practical inputs that matter a lot for this market include planted area trends for soybeans, corn, and key commercial crops, pest and disease pressure by season, fertilizer application rates per hectare, the split between herbicides, insecticides, and fungicides within crop protection, and import dependence signals from trade data for major active ingredients and fertilizers. When data gaps exist at the country level, we interpolate using crop area weights and then confirm direction and magnitude through distributor and agronomist feedback.
For forecasting, scenario analysis is used to reflect how weather, commodity prices, and policy actions can swing in-season demand. Those scenarios are then tied back to expected crop area and input intensity changes. The final forecast is kept consistent with what respondents describe as realistic adoption and pricing paths, rather than assuming straight-line growth.
Data Validation & Update Cycle
Outputs are validated through multiple checks, starting with internal consistency tests such as the volume implied by value and price bands, followed by country roll-ups that must reconcile to regional totals without double counting. Large variances are reviewed against independent signals like crop area updates, import trends, and known inventory drawdowns or build-ups. After that, assumptions are reworked and re-tested.
Before sign-off, the model and narrative go through stepwise analyst reviews, and follow-up calls are triggered when a key parameter moves meaningfully or when desk signals disagree with interview feedback. Reports are refreshed annually, and interim updates are made when material events occur, after which a final pre-delivery pass is completed so clients receive the latest view.
Mordor Intelligence's South America Agrochemicals Market Estimate Compared With Other Published Estimates
It is normal to see different market sizes for South America agrochemicals because studies do not always count the same product boundaries, timing basis, or pricing level. The biggest spreads usually come from whether fertilizers are included with crop protection, whether values are taken at ex-manufacturer versus retail levels, and whether the year is treated as a calendar year or an agricultural season.
By tracking crop area and treated-hectare intensity and then refreshing pricing and channel inventory assumptions with interviews, Mordor Intelligence keeps the value tied to actual farm-use demand while separating adjacent items like services and equipment that can inflate totals.
Benchmark comparison
| Source | Market Size | Gaps in Research Methodology |
|---|---|---|
| Mordor Intelligence | USD 27.55 B (2025) | |
| Trade Journal A | USD 23.31 B (2024) | Uses an agricultural-year basis and focuses on crop protection only at an ex-manufacturer value level, which excludes fertilizers and can shift the timing versus a calendar-year view. |
| Global Consultancy A | USD 43.80 B (2025) | Appears to apply a broader value perimeter and country set, and the inclusion of additional agrochemical categories and different price realization points can lift the total versus a tighter farm-use boundary. |
Across the table, the gap is largely explained by what is counted inside agrochemicals, how the year is defined, and which price level is used. Our approach stays traceable to crop area, intensity, and realistic price assumptions, which makes the outcome easier to replicate and to update when conditions change.
Key Questions Answered in the Report
How large is the South America agrochemicals market in 2026?
The South America agrochemicals market size is USD 29.40 billion in 2026 and is projected to reach USD 40.70 billion by 2031.
Which product type leads regional sales?
Crop Protection Chemicals are the largest product type, holding 65.8% of 2025 revenue, led by glyphosate use in herbicide-tolerant soybean systems.
Why is Colombia the fastest-growing geography?
Colombia’s 7.6% CAGR is fueled by coffee rehabilitation programs and rapid avocado acreage expansion that increase fungicide and micronutrient demand.
Which companies dominate the competitive landscape?
Bayer AG, Syngenta Group, BASF SE, Corteva Agriscience, and FMC Corporation collectively hold a significant share of the regional market.