
Market Overview
| Study Period | 2020 - 2031 |
|---|---|
| Forecast Data Period | 2026 - 2031 |
| Base Year Market Size (2025) | USD 10.87 Billion |
| Market Size (2026) | USD 11.21 Billion |
| Market Size (2031) | USD 13.07 Billion |
| Growth Rate (2026 - 2031) | 3.12 % |
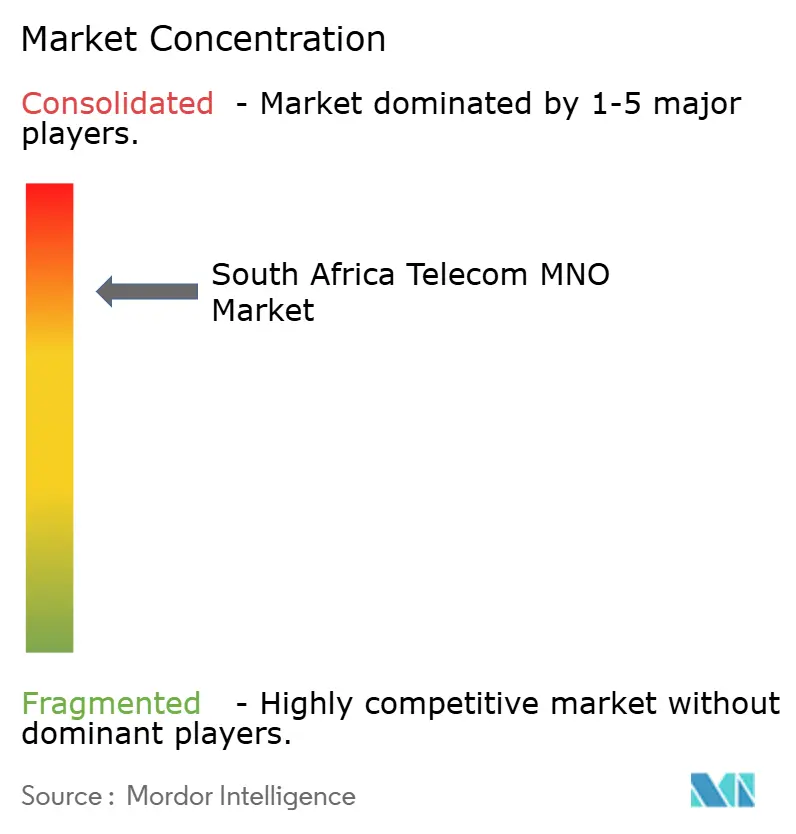
| Market Concentration | High |
Major Players *Disclaimer: Major Players sorted in no particular order Image © Mordor Intelligence. Reuse requires attribution under CC BY 4.0. | |
South Africa Telecom MNO Market Analysis by Mordor Intelligence
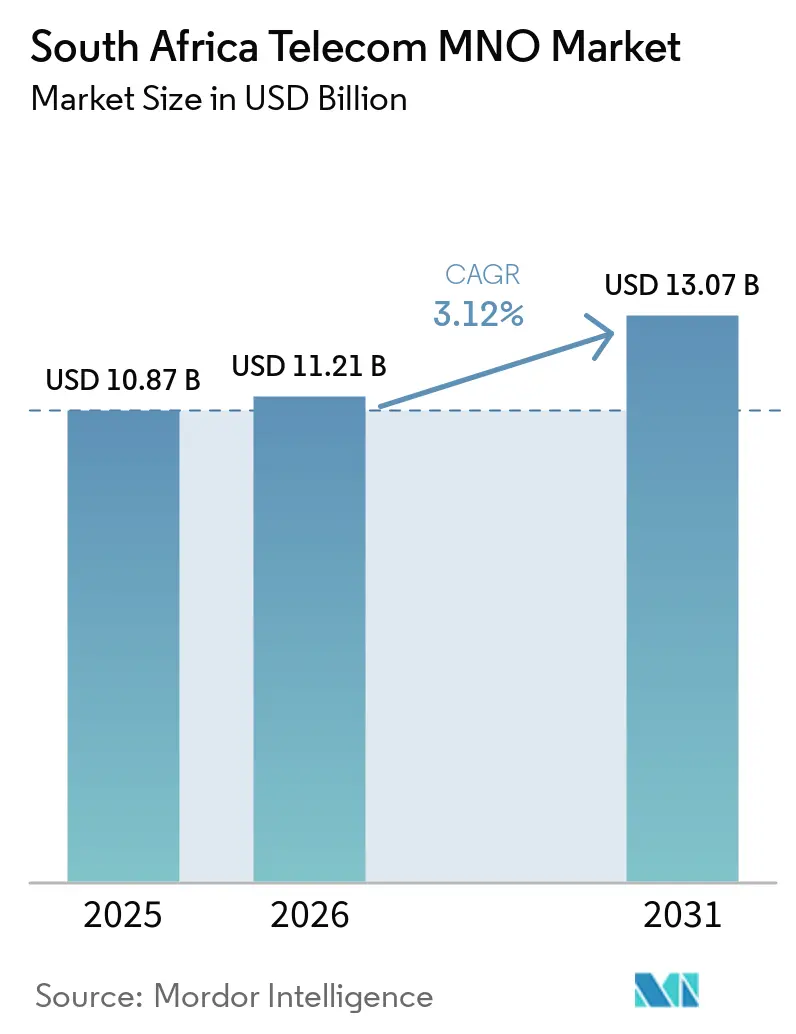
The South Africa Telecom MNO Market size is projected to be USD 10.87 billion in 2025, USD 11.21 billion in 2026, and reach USD 13.07 billion by 2031, growing at a CAGR of 3.12% from 2026 to 2031. In terms of subscriber volume, the market was valued at 123.54 million subscribers in 2025 and is expected to grow from 126.38 million subscribers in 2026 to 141.60 million subscribers by 2031, at a CAGR of 2.30% during the forecast period (2026-2031).
Muted growth reflects a mature voice business, recurring load-shedding costs and tight pricing oversight, even as data-centric revenues, 5G launches and fintech services deepen digital engagement. Device subsidies, spectrum refarming and open-access infrastructure keep subscriber additions positive, while cloud-linked enterprise connectivity lifts average revenue per user. Regulatory support for a 2G/3G switch-off by December 2027, together with open-access tower and fiber models, helps operators pivot capex toward 4G and 5G densification. Persistent power instability, high data prices and occasional subsea-cable faults remain the most visible growth brakes.
Key Report Takeaways
- By service type, Data and Internet Services led with 55.56% of South Africa telecom MNO market share in 2025, while IoT and M2M is advancing at a 3.22% CAGR through 2031.
- By end-user, Consumer subscriptions accounted for 80.84% of the South Africa telecom MNO market size in 2025, while Enterprise services are forecast to record the fastest 3.67% CAGR to 2031.
Note: Market size and forecast figures in this report are generated using Mordor Intelligence’s proprietary estimation framework, updated with the latest available data and insights as of 2026.
South Africa Telecom MNO Market Trends and Insights
Drivers Impact Analysis*
| Driver | (~) % Impact on CAGR Forecast | Geographic Relevance | Impact Timeline |
|---|---|---|---|
| Smartphone adoption | +0.8% | Urban Gauteng and Western Cape | Medium term (2-4 years) |
| Fibre-to-the-home expansion | +0.6% | Metros nationwide | Long term (≥4 years) |
| 5G spectrum auctions | +0.5% | Major cities nationwide | Medium term (2-4 years) |
| Enterprise cloud and IoT demand | +0.7% | Business districts nationwide | Long term (≥4 years) |
| Open-access fibre and neutral-host towers | +0.4% | Underserved rural areas | Long term (≥4 years) |
| Fintech–telco convergence | +0.5% | Urban centers nationwide | Medium term (2-4 years) |
| Source: Mordor Intelligence | |||
Soaring Smartphone Adoption Drives Mobile Data Traffic
Rapid smartphone uptake multiplies data consumption, shifting revenues toward higher-margin bundles. MTN’s plan to seed 1.2 million low-cost 4G handsets in 2025 directly tackles affordability hurdles and accelerates migration off legacy networks.[1] The strategy aligns with the December 2027 2G/3G sunset, compelling operators to manage capacity upgrades while subsidizing devices. Network traffic across MTN South Africa climbed 35.7% to 9,054 PB in H1 2024, validating the revenue upside as adoption scales. [2]
Enterprise Cloud and IoT Connectivity Demand Surges
Hyperscalers’ local zones—from AWS Cape Town to Google Cloud Johannesburg—anchor South African firms’ digital-first roadmaps. [3]Vodacom Business earned AWS Direct Connect status, giving enterprises low-latency, secure links to cloud workloads. Large banks such as Standard Bank accelerated workload migration in 2024, driving demand for managed VPNs, SD-WAN and NB-IoT connections. Expanded IoT deployments—spanning agriculture sensors to municipal smart meters—support the segment’s 3.38% CAGR outlook.
5G Spectrum Auctions Unlock Premium-ARPU Services
The 2022 multiband auction assigned spectrum to six players, catalyzing differentiated 5G rollouts. Rain lit Africa’s first standalone 5G network, carving a data-only niche despite early execution headwinds. MTN’s ultra-range maritime 5G test off Mossel Bay illustrates the technology’s ability to tap previously unreachable revenue pools. Population coverage exceeded 50% by end-2024, supporting 10.8 million 5G users and R28.4 billion in service revenue.
Fintech–Telco Convergence Creates Sticky Revenue Streams
Integrating payments and lending into the mobile wallet cements loyalty and lifts ARPU. Mastercard’s USD 200 million minority stake valued MTN’s fintech arm at USD 5.2 billion, highlighting investor appetite for scaled digital-finance platforms. Vodacom processes R23 billion in daily mobile-money flows, showing the transaction volume achievable when telecom networks leverage financial inclusion. MTN’s fintech revenue jumped 59.1% year-on-year in H1 2024, demonstrating scalability.
Restraints Impact Analysis*
| Restraint | (~) % Impact on CAGR Forecast | Geographic Relevance | Impact Timeline |
|---|---|---|---|
| High data prices and affordability gap | -0.9% | Rural and low-income areas nationwide | Short term (≤2 years) |
| Market concentration and price regulation | -0.4% | National | Medium term (2-4 years) |
| Load-shedding raises opex and outages | -0.7% | National | Short term (≤2 years) |
| Subsea-cable outages risk bandwidth | -0.3% | National | Short term (≤2 years) |
| Source: Mordor Intelligence | |||
High Data Prices and Affordability Gap Limit Usage
At USD 2.67 per GB, South Africa ranks 136th worldwide for mobile-data affordability, limiting uptake of premium plans. Inflation, load-shedding fuel costs and a weak rand pressure operator margins, prompting cautious discounting strategies. Regulator ICASA relaxed data-expiry rules in 2024, implicitly acknowledging the tight economics confronting networks. Affordability constraints hit rural and prepaid users hardest, slowing full market digital inclusion.
Load-Shedding Disrupts Network Availability and Opex
Rolling blackouts divert capital into generators and batteries instead of coverage expansion. MTN spent USD 100 million on backup power in 2025 alone, underscoring how energy scarcity reshapes balance-sheets. Vodacom’s R60 billion five-year plan allocates sizeable power-resilience budgets, while tower operators pivot to power-as-a-service models. Outages dent network-quality scores and heighten churn risk, keeping operating costs structurally high.
*Our forecasts treat driver/restraint impacts as directional, not additive. The impact forecasts reflect baseline growth, mix effects, and variable interactions.
Segment Analysis
By Service Type: Data Services Anchor Revenue Transformation
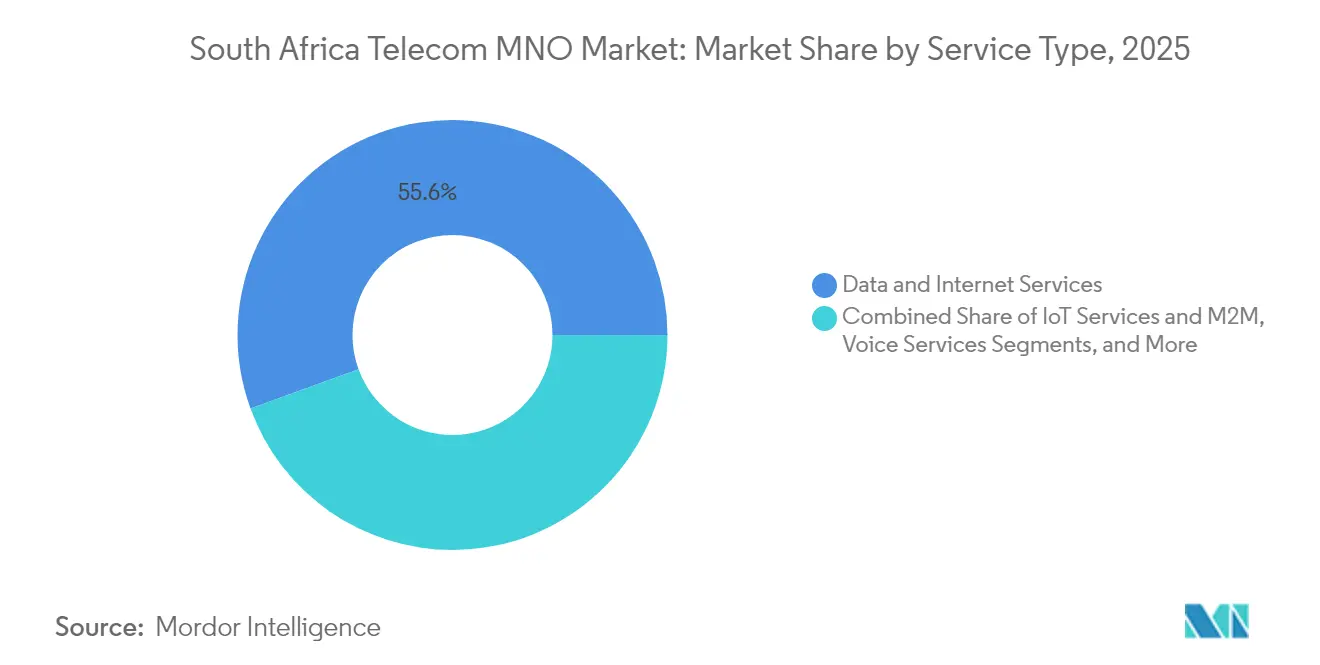
Data and Internet Services held a 55.56% South Africa telecom MNO market share in 2025 and contributed 48.3% of MTN’s service revenue in Q1 2025. Voice and SMS volumes continue secular decline as over-the-top apps offload legacy traffic, yet dual-SIM penetration preserves a baseline of paid minutes. IoT and M2M, though only 1.96% of 2025 revenues, is the fastest-growing slice and underpins a projected 3.22% CAGR to 2031, aided by Vodacom’s nationwide NB-IoT network.
The South Africa telecom MNO market size attached to IoT and M2M is set to expand alongside provincial smart-city budgets and private-sector fleet-tracking contracts. OTT video drives Pay-TV partnerships such as Telkom-Netflix, while bundled value-added services—from cybersecurity to cloud backup—defend margins against pure-play data commoditization. Operators’ ability to package fintech wallets with data bundles adds retention levers absent from traditional service menus.

By End-User: Enterprise Demand Gains Momentum
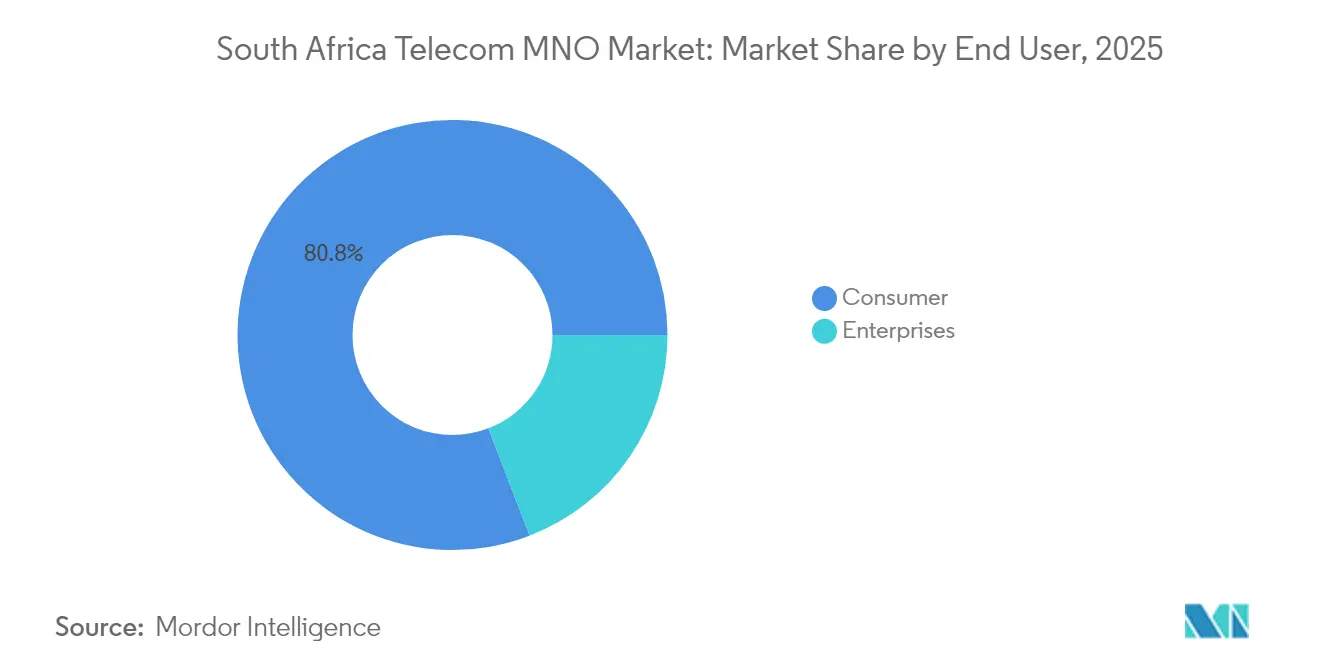
Consumers still generated 80.84% of South Africa telecom MNO market revenue in 2025, yet enterprise lines are forecast to grow at a 3.67% CAGR on surging cloud and SD-WAN demand. Consumer ARPU pressures persist as aggressive bundle promotions offset high data-cost perceptions, but fintech services add incremental yield per user.
Enterprise connectivity contracts often bundle dedicated internet access, MPLS replacements and managed security, lifting contract sizes well above mass-market rates. The South Africa telecom MNO market size relevant to corporates will benefit from public-sector digitalization and multinationals’ cloud landing zones. Operators cultivating vertical-specific solutions—agri-IoT, retail analytics, industrial private-LTE—are positioned to defend margins amid slowing consumer growth.
Geography Analysis
Nationwide, 5G population coverage surpassed 50% by end-2024, with the Western Cape and Gauteng provinces capturing the bulk of early deployments. The South Africa telecom MNO market faces a rural connectivity shortfall as open-access fiber and neutral-host towers only gradually close coverage gaps. Nine subsea cables, including the new Equiano system, give the country bandwidth depth; nonetheless, a July 2025 WACS outage throttled international traffic, exposing reliance on coastal landing points.
Load-shedding impacts differ by province: Eastern Cape sites suffer longer outages due to sparse grid maintenance, whereas Gauteng operators deploy larger on-site batteries. Fibre-to-the-home adoption spikes in Cape Town, Johannesburg and Durban suburbs, stimulating fixed-mobile substitution and driving 5G fixed-wireless propositions. Government’s Digital Economy Master Plan targets a 15-20% GDP digital contribution by 2025, anchoring policy measures such as accelerated spectrum refarming and SA Connect rural-broadband tenders.
Regulatory Landscape
South Africa's telecom MNO market is regulated by the Independent Communications Authority of South Africa (ICASA) under the Electronic Communications Act framework, with policy direction from the Department of Communications and Digital Technologies. In August 2025, the Minister of Communications and Digital Technologies issued a policy direction requiring ICASA to inquire into the need for new Individual Electronic Communications Network Services (I-ECNS) licences, adding a competition-policy lever to ongoing pricing oversight in a highly concentrated market.
In 2026, network rollout governance and numbering administration received additional scrutiny. ICASA convened public hearings on 13-14 July 2026 on the Draft Regulations on Rapid Deployment of Electronic Communications Networks and Facilities (2026), focused on reducing deployment friction across jurisdictions. Parliament also advanced the Electronic Communications Amendment Bill (B12-2026), which introduces national standard by-laws for rapid deployment and strengthens the framework for wholesale pricing and access. ICASA further published final amendments to the Numbering Plan Regulations in July 2026 (Fourth Amendment), tightening rules for number administration, including mobile number churn and deactivation, and reinforcing compliance expectations for service providers.
Competitive Landscape
MTN and Vodacom control a combined 70% South Africa telecom MNO market share, shaping a duopolistic tone that nevertheless faces regulatory pushback. The Competition Tribunal’s rejection of Vodacom’s Maziv purchase in November 2024 flagged concerns about vertical integration choking wholesale fiber access. MTN poured R10 billion into network modernization in 2024, achieving the country’s highest 82.48 Mbps average download speed. Vodacom leverages Vodafone’s scale for cloud alliances, while Rain’s standalone-5G bet aims at data-heavy cord-cutters.
Cell C’s migration to a virtual-operator model on MTN’s radio network slashes capex, yet brand positioning and service quality remain watch-points. Telkom monetized its Swiftnet tower unit for USD 371.5 million in March 2025, freeing cash for fiber expansion and mobile-ARPU uplift. Towercos such as American Tower and SBA Communications deploy power-as-a-service offers, turning energy crisis into an annuity opportunity. Fintech partnerships—MTN-Mastercard, Vodacom-Alipay—signal that future differentiation may rest more on platform ecosystems than on raw spectrum holdings.
South Africa Telecom MNO Industry Leaders
-
MTN Group Limited
-
Vodacom South Africa
-
Telkom SA SOC Limited
-
Cell C Limited
-
Rain (Pty) Ltd
- *Disclaimer: Major Players sorted in no particular order
Market Opportunities and Future Outlook
The 2G/3G switch-off roadmap by December 2027, alongside device affordability initiatives, gives operators a clearer pathway to accelerate migration to 4G and 5G at scale while maintaining prepaid inclusion. A direct reference point is MTN's plan to seed 1.2 million low-cost 4G handsets (announced for 2025), which supports the handset replacement cycle needed for the legacy-network sunset and helps operators shift traffic into higher-value data bundles as voice and SMS continue to face structural declines.
Meanwhile, 2025-2026 regulatory and legislative workstreams create headroom in wholesale access, MVNO enablement, and faster network deployment, opening options beyond traditional reseller MVNO models. The Electronic Communications Amendment Bill (B12-2026), introduced in 2026, includes national standard by-laws for rapid deployment and clearer wholesale pricing rules, while ICASA's spectrum planning work, including a Long-Term Spectrum Outlook through 2028, improves visibility for capacity planning and network densification. These changes connect to enterprise connectivity opportunities tied to local hyperscaler zones (AWS Cape Town and Google Cloud Johannesburg) and operator-grade cloud interconnect, with Vodacom Business earning AWS Direct Connect status to support demand for managed SD-WAN, secure internet, and IoT connectivity delivered over MNO access networks.
Recent Industry Developments
- July 2026: Rain launches LoopPhone and upgrades RainOne Unlimited plan, a 5G mobile and home Wi-Fi bundle priced at R995 per month. The new product adds to Rain's portfolio and supports ARPU through bundled services focused on data-centric engagement.
- July 2026: Rain (Pty) Ltd and Huawei are deploying a sub-1GHz massive MIMO 5G network across South Africa to improve coverage and indoor penetration. The deployment is intended to accelerate nationwide 5G rollouts and expand capacity in areas where indoor experience has been a constraint.
- June 2026: MTN Group adopts the LotusFlare DNO Cloud platform to power a digital customer experience under the new Pi brand. The platform deployment is positioned to enable faster digital branding and service orchestration, supporting cloud-native offerings that can lift ARPU.
Research Methodology Framework and Report Scope
Market Definition and Coverage
For this study, the market is defined as telecom operator revenue generated within South Africa from delivering connectivity and related telecom services to consumers and enterprises, including mobile and fixed offerings where the service is billed in-country.
Scope exclusions: We exclude pure device hardware sales and standalone IT services that do not belong to telecom service revenue (such as generic enterprise software).
Segmentation Overview
- Overall Telecom Revenue and ARPU
- Service Type
- Voice Services
- Data and Internet Services
- Messaging Services
- IoT and M2M Services
- OTT and PayTV Services
- Other Services (VAS, Roaming and International Services, Enterprise and Wholesale Services, etc.)
- End-User
- Enterprises
- Consumer
Data Sources, Market Sizing, and Validation
Desk Research
Desk research was used to set the outer guardrails for demand and supply, and to align the market model with how the country tracks telecom activity. We leaned on public statistics and official publications such as ICASA sector reports, Statistics South Africa releases, International Telecommunication Union indicators, and World Bank macro series to understand service adoption and spending capacity.
On top of this, we reviewed operator disclosures like annual reports, investor presentations, and public tariff updates, which helped us map service mix changes from voice to data and broadband. When needed, we also referenced paid subscriptions for company financials, news and financials, import export shipment level trade signals, and patent databases to cross-check investment cycles and technology intensity. These sources are illustrative only, and many additional references were used to collect, validate, and clarify data points during the work.
Primary Interviews and Surveys
Primary work was used to pressure-test assumptions that are hard to read directly from public data, including pricing movement, bundle behavior, and the pace of customer migrations across access technologies. We spoke with a mix of operator-side experts, enterprise buyers, channel participants, and ecosystem specialists across South Africa so gaps from desk research could be closed before final sizing.
Distribution of primary research fieldwork respondents
| Company type | Respondent position |
|---|---|
| Top tier: 36% | CXOs: 17% |
| Mid tier: 44% | Functional/Unit leaders: 24% |
| Smaller Players: 20% | Managers: 59% |
Market-Sizing & Forecasting
Market sizing was built by first reconstructing the telecom demand pool from national revenue signals and service-level indicators, and then allocating that total across service areas based on observed mix shifts. The top-down approach was anchored on reported telecom sector revenue trends and then adjusted using adoption and usage clues that explain why data-led categories rise even when legacy voice lines fall.
To keep the totals realistic, we corroborated the outputs with selective bottom-up approximations such as sampled operator revenue splits, subscriber base movements, and implied ARPU checks from published tariffs and bundle structures. Inputs that mattered most included mobile and fixed subscriber counts, data traffic growth signals, smartphone and broadband penetration indicators, headline price movement and discounting behavior, and enterprise connectivity spend direction (especially where outages and backup needs affect usage). Forecasts were produced using scenario analysis, where near-term pricing and mix assumptions were aligned to what interviewees expect for upgrades, network investment pacing, and customer affordability. Where a bottom-up data point was missing, we used conservative ranges and then rechecked the implied result against the national totals before locking the final number.
Data Validation & Update Cycle
Validation is done by triangulating the model outputs against independent signals, and then investigating any large variances before the dataset is finalized. Our checks include consistency across historic growth, service-mix logic, and whether implied ARPU and subscriber trends move in a way that matches what is being observed on the ground.
Anomalies trigger a deeper review, which can include revisiting assumptions, re-running sensitivity cases, and re-contacting relevant interviewees when the gap is material. Each report is refreshed on an annual cycle, with interim updates when major policy, pricing, or macro events can shift short-term expectations. Before delivery, a final analyst pass is completed so clients receive the latest updated view based on the most recent available public releases and field inputs.
Mordor Intelligence's South Africa Telecom Market Size Compared Against Other Published Estimates
Published market sizes for South Africa telecom can differ even when the topic label looks the same, because the underlying scope and measurement choices vary. Differences usually come from what is counted as telecom operator revenue, how service categories are grouped, and which year and currency timing are used.
In this study, the spread is mainly explained by whether adjacent digital services are bundled into telecom totals, how mobile versus fixed connectivity is treated, and whether growth is modeled using a base case or a more aggressive price and usage path. Counting only the telecom MNO revenue pool and keeping service lines tied to subscriber and revenue consistency checks creates a different 2025 value than estimates that fold in broader ICT spend, a modeling choice applied by Mordor Intelligence.
Benchmark comparison
| Source | Market Size | Gaps in Research Methodology |
|---|---|---|
| Mordor Intelligence | USD 10.87 B (2025) | |
| Industry Regulator Brief A | USD 12.74 B (2025) | Uses reported telecom sector revenue in local currency and converted to USD, which can sit higher if it includes non-MNO telecom lines or applies a different exchange-rate timing across the year. |
| Trade Journal Summary B | USD 11.90 B (2024) | Anchors the market to a prior-year revenue headline and may not fully separate one-off revenue items from recurring service revenue, which can shift the level when rolled forward to a different base year. |
The table shows that most gaps are not about math errors, but about what is inside the scope and how the base year is translated into USD. When we keep the model tied to service-revenue drivers like subscriber movements, pricing logic, and mix shifts, the final total stays traceable and easier to replicate for planning.
Key Questions Answered in the Report
How large is the South Africa telecom MNO market in 2026?
The South Africa telecom MNO market size stands at USD 11.21 billion in 2026 and is set to reach USD 13.07 billion by 2031.
What CAGR is forecast for mobile network operators through 2031?
Market revenue is projected to grow at a 3.12% CAGR between 2026 and 2031.
Which service type contributes the most revenue?
Data and Internet Services account for 55.56% of 2025 revenue and remain the dominant growth engine.
Why is IoT considered a high-growth segment?
Enterprise digitization and nationwide NB-IoT coverage underpin a 3.22% CAGR for IoT and M2M services through 2031.
How does load-shedding impact telecom operators?
Grid instability forces operators to invest heavily in generators and batteries, raising opex and diverting funds from network expansion.
Who are the leading players by market share?
MTN and Vodacom jointly command more than 70% of mobile service revenue, giving the market a high concentration score.