
Market Overview
| Study Period | 2021 - 2031 |
|---|---|
| Forecast Data Period | 2026 - 2031 |
| Base Year Market Size (2025) | USD 1.90 Billion |
| Market Size (2026) | USD 2.04 Billion |
| Market Size (2031) | USD 2.88 Billion |
| Growth Rate (2026 - 2031) | 7.18 % |
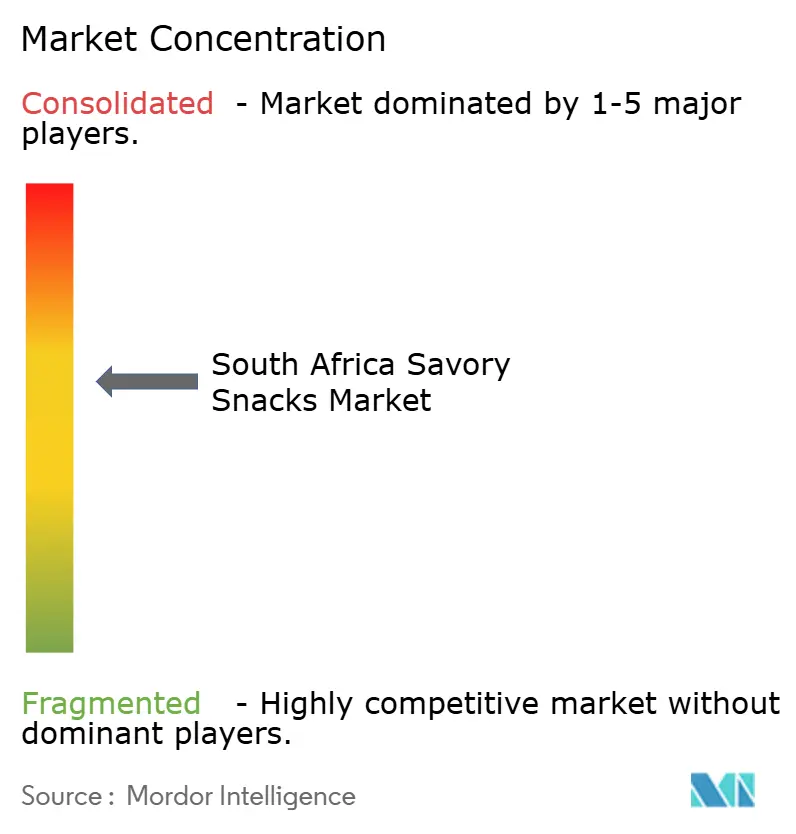
| Market Concentration | Medium |
Major Players *Disclaimer: Major Players sorted in no particular order Image © Mordor Intelligence. Reuse requires attribution under CC BY 4.0. | |
South Africa Savory Snacks Market Analysis by Mordor Intelligence
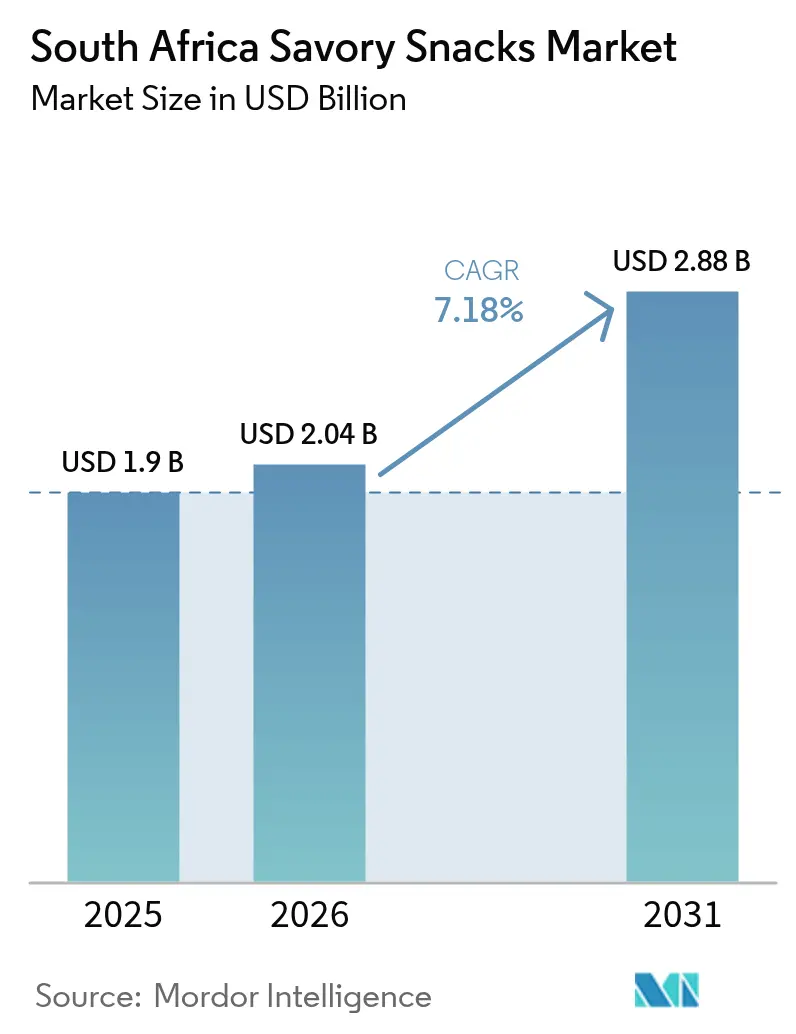
South Africa savory snacks market size in 2026 is estimated at USD 2.04 billion, growing from 2025 value of USD 1.90 billion with 2031 projections showing USD 2.88 billion, growing at 7.18% CAGR over 2026-2031. Growth rests on three pillars: expanding middle-class spending power, a national preference for bold flavors, and rising demand for on-the-go formats that fit busy urban lifestyles[1]. Manufacturers respond with local flavor innovations while aligning with global wellness trends, spurring the launch of baked and pulse-based products that meet forthcoming front-of-package labeling rules. Supermarkets underpin volume, yet rapid e-commerce growth—illustrated by Checkers Sixty60’s USD 534 million equivalent in annual turnover—signals a structural shift in retail. Volatile potato and maize prices continue to squeeze margins, but anticipated La Niña rains are expected to ease cost pressures and stabilize supply chains.
Key Report Takeaways
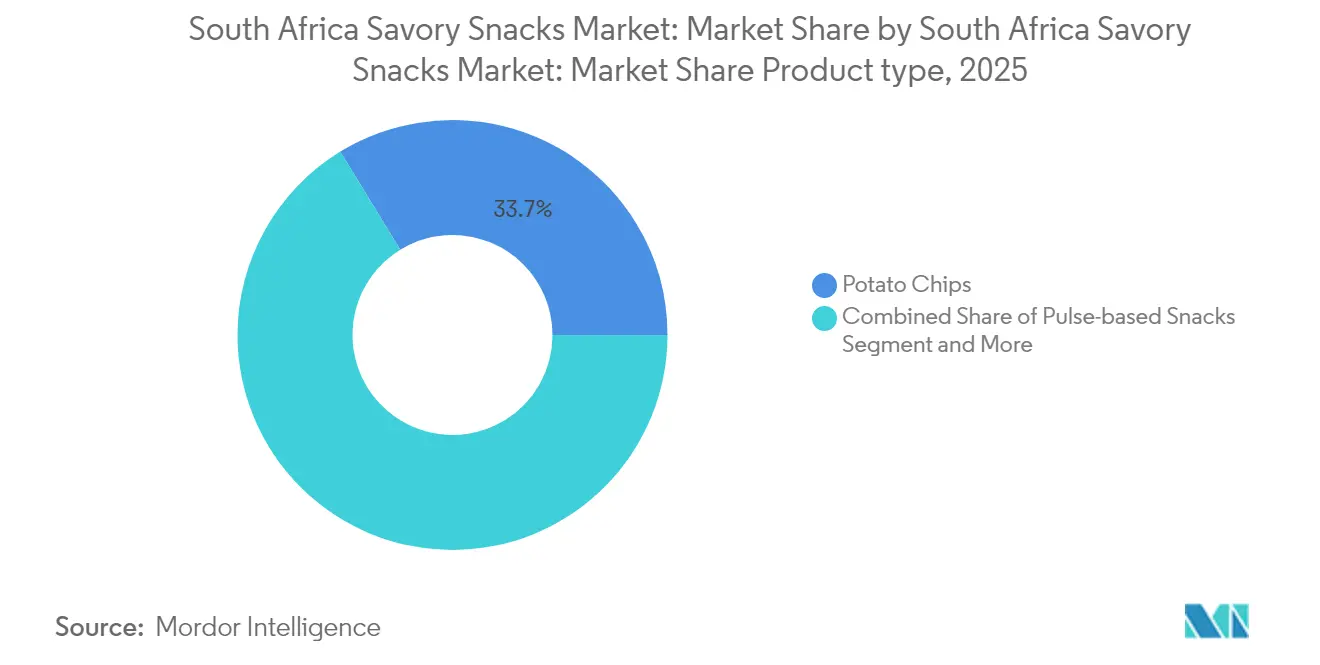
- By product type, potato chips led with 33.74% of the South Africa savory snacks market share in 2025, while pulse-based snacks are forecast to advance at an 8.41% CAGR through 2031.
- By category, fried snacks accounted for 63.05% of the South Africa savory snacks market size in 2025 and baked snacks are expected to post an 8.12% CAGR to 2031.
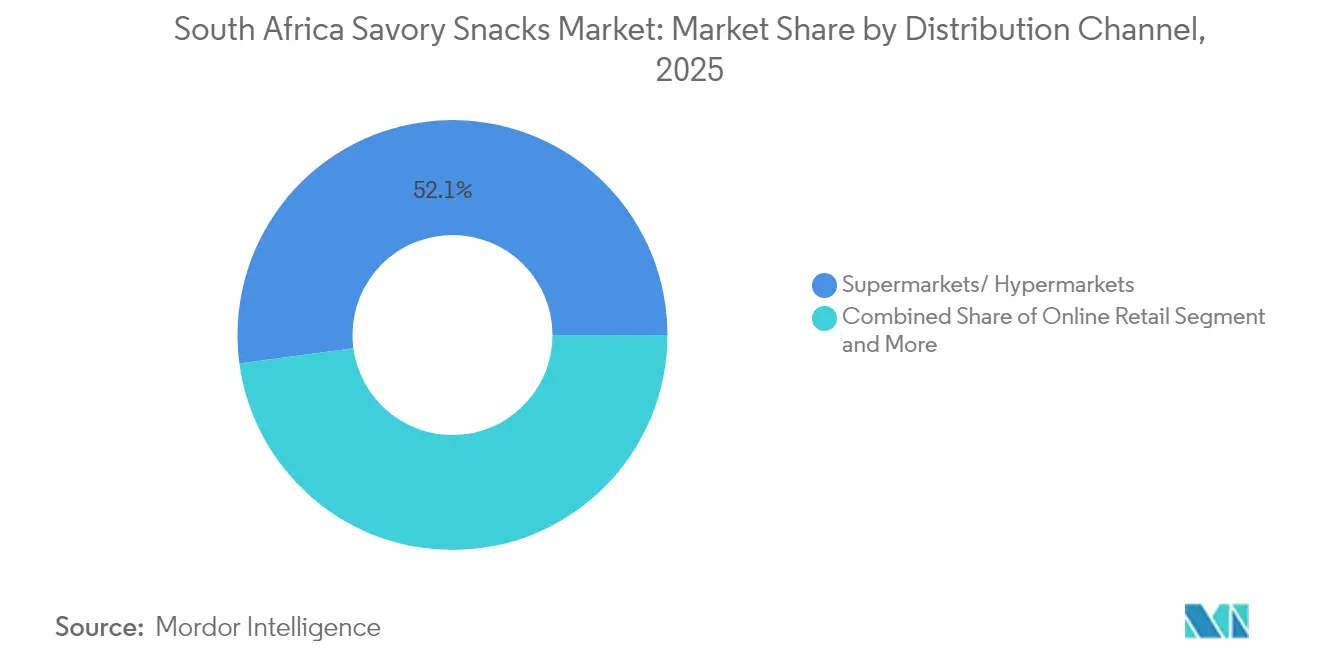
- By distribution channel, supermarkets and hypermarkets held 52.11% revenue share in 2025; online retail is set to expand at a 9.36% CAGR through 2031.
- By geography, Gauteng commanded 35.01% of 2025 sales, and KwaZulu-Natal is projected to register a 7.32% CAGR between 2026 and 2031.
Note: Market size and forecast figures in this report are generated using Mordor Intelligence’s proprietary estimation framework, updated with the latest available data and insights as of 2026.
Market Trends and Insights
Drivers Impact Analysis of South Africa Savory Snacks Market*
| Driver | % Impact on CAGR Forecast | Geographic Relevance | Impact Timeline |
|---|---|---|---|
| Demand for convenient snacking options | 1.2% | National, with concentration in Gauteng and Western Cape urban centers | Medium term (2-4 years) |
| Spice tolerance & heat-seeking preferences | 0.9% | National, strongest in KwaZulu-Natal and Eastern Cape | Long term (≥ 4 years) |
| Rising disposable income among middle-class | 1.4% | Gauteng, Western Cape, with spillover to KwaZulu-Natal | Medium term (2-4 years) |
| Shift toward healthier & organic snack formats | 1.1% | Western Cape and Gauteng affluent demographics | Long term (≥ 4 years) |
| Digitalisation of township spaza-shop networks | 0.9% | National township areas, early gains in Gauteng, Western Cape | Short term (≤ 2 years) |
| Indigenous plant-based protein snack innovation | 0.7% | National, with manufacturing concentration in KwaZulu-Natal | Long term (≥ 4 years) |
| Source: Mordor Intelligence | |||
Demand for Convenient Snacking Options
Urban consumers buy savory items during commutes, at petrol stations, and through delivery apps, helped by 16.28 million adults purchasing fast food monthly. Improved power supply has lifted factory uptime, enabling consistent store replenishment[2]. Mobile payments and same-day delivery broaden reach, with 55% of users now ordering groceries online each month. Checkers Sixty60’s 63.1% sales increase validates the omni-channel model that pairs bricks-and-mortar inventory with app-driven convenience. As township spaza shops connect to digital ordering platforms, impulse snack purchases rise even in areas once served solely by informal trade. Packaging innovations that extend shelf life further support this uptake, keeping products fresh across long supply chains.
Spice Tolerance & Heat-Seeking Preferences
A cultural appetite for bold flavors shapes product pipelines: chili, peri-peri, and masala variants secure shelf space countrywide. PepsiCo developed localized Lay’s and Doritos iterations after in-house sensory panels confirmed that 75% of tasters sought “noticeable burn” in potato chips[3]. KwaZulu-Natal’s growth reflects its culinary heritage that marries spice with indigenous ingredients such as rooibos. Manufacturers in Durban leverage proximity to spice suppliers to reduce formulation costs and accelerate flavor testing. Spice affinity also opens export doors: Halaal-certified fiery snacks now ship to Middle-East partners that view South Africa as a taste-matched sourcing hub. By meeting domestic and diaspora palates, brands build defensible niches against generic imports.
Rising Disposable Income Among Middle-Class
Real household consumption continues climbing, surpassing USD 160 billion annually when measured at current exchange rates. New entrants target aspirational shoppers with premium seasoning blends, resealable packs, and influencer-backed campaigns that signal status without straining budgets. Gauteng’s high-income suburbs favor value-added multipacks, while mid-tier shoppers in secondary cities gravitate toward larger “family share” formats for cost savings. Retail competition intensifies: Shoprite’s aggressive price-lock promotions pull volumes from rivals and keep branded snacks affordable. Rising incomes also expand formal employment, supporting stable snacking budgets even as interest rates fluctuate.
Shift Toward Healthier & Organic Snack Formats
Regulators finalized draft rule R3337 that mandates clear sugar, salt, and saturated-fat icons on front panels, prompting reformulations that replace palm oil with sunflower or explore air-popped bases. Baked launches grew 21% in 2024 by SKU count, and bean-based puffs that deliver 20.4 g protein per 100 g secured listings at major chains.. Western Cape startups draw on local fynbos extracts for antioxidant claims, while Gauteng co-packers invest in gluten-free extrusion lines. Consumers with lifestyle diseases now trade fried chips for low-oil lentil curls positioned as “school-safe” snacks. Although healthier varieties carry 15–20% price premiums, survey data show parents still purchase them monthly, prioritizing nutrient density over volume.
Restraints Impact Analysis of South Africa Savory Snacks Market*
| Restraint | % Impact on CAGR Forecast | Geographic Relevance | Impact Timeline |
|---|---|---|---|
| Health-driven shift to meal replacements | -0.9% | Urban areas in Gauteng and Western Cape | Medium term (2-4 years) |
| Volatile potato and maize input prices | -1.2% | National, with manufacturing concentration impact | Short term (≤ 2 years) |
| Competition from confectionery and baked goods | -0.7% | National, with stronger impact in Western Cape and Gauteng | Medium term (2-4 years) |
| Emerging single-use-plastic regulations | -0.6% | National, with early implementation in Western Cape | Long term (≥ 4 years) |
| Source: Mordor Intelligence | |||
Health-Driven Shift to Meal Replacements
Heightened awareness of obesity and micronutrient gaps leads some urban consumers to skip snacks in favor of protein shakes, oat cups, or fortified bars. Food-basket costs climbed to USD 291 per household in May 2025, focusing budgets on essentials. Regulators accentuate this pivot by requiring larger nutrient panels that highlight sodium counts in chips. Category incumbents counter with “mini-meal” positioning, adding legumes and seeds to raise protein while keeping snack sensorial cues. Retailers create adjacent shelf sets that blur traditional categories, prompting co-merchandising of savory bites with functional drinks.
Volatile Potato and Maize Input Prices
Potato prices rose 7% month-on-month in May 2025 as flood-damaged Free State farms curtailed supply. Maize harvests in 2024 fell 19% under El Niño stress, lifting cost curves for corn-based extruded snacks. Manufacturers hedge with forward contracts and diversify into cassava flour and chickpea grit. Expected La Niña precipitation in late 2025 should increase the summer-crop estimate to 14.56 million tonnes, easing feedstock pressure. Still, volatility hampers long-term price points, complicating promotions and retailer negotiations.
*Our forecasts treat driver/restraint impacts as directional, not additive. The impact forecasts reflect baseline growth, mix effects, and variable interactions.
South Africa Savory Snacks Market Segment Analysis
By Product Type:
Pulse-Based Innovation Disrupts Potato DominancePotato chips retained 33.74% of the 2025 value, but input price swings and nutrition labeling scrutiny constrain long-term upside. Extruded corn curls hold steady due to low-cost scalability and the ability to absorb spicy seasonings that resonate nationally. Popcorn advances modestly, marketed as a low-calorie cinema-style treat. Nuts, seeds, and trail mixes cater to affluent urbanites, yet higher price points limit mass reach.
Pulse-based snacks post the fastest 8.41% CAGR, propelled by 20.4 g protein per 100 g formulations that satisfy gym-goers and parents seeking school-approved items. Indigenous legumes add provenance stories that differentiate SKUs from global rivals. Meat and biltong snacks ride cultural affinity but struggle with 15% beef price surges tied to disease outbreaks. As reformulations multiply, the South Africa savory snacks market embraces hybrid products blending pulses with potato or maize to hedge cost risk and please evolving palates.

By Category:
Health Regulations Accelerate Baked Segment GrowthFried snacks dominated 63.05% in 2025, thanks to entrenched taste expectations and lower unit costs. Retailers rely on this segment for volume promotions and cross-category basket building. Nonetheless, sodium and saturated-fat warnings soon to appear on packs may temper growth, steering shoppers to alternatives.
Baked lines register an 8.12% CAGR, benefitting from oil-reduction messaging and school nutrition guidelines that ban deep-fried snacks at tuck shops. Companies retrofit facilities with conveyor ovens, cutting frying oil spend by up to 40%. Air-popped and dehydrated styles begin to surface in specialty outlets, carrying a 30% price premium yet boasting triple-digit sell-through in pilot stores. Regulatory bodies, including the National Regulator for Compulsory Specifications, continuously audit these facilities, supporting consumer trust.
By Distribution Channel:
Digital Transformation Reshapes Retail LandscapeSupermarkets and hypermarkets commanded 52.11% in 2025 value sales, leveraging weekly specials and loyalty programs to capture family shoppers. Shoprite’s lead derives from efficient distribution centers and fixed-price strategies that absorb some input cost shocks. Convenience stores thrive on impulse buys near petrol stations, while specialty outlets highlight artisanal and allergen-free lines.
Online retail posts the quickest 9.36% CAGR, driving the South Africa savory snacks market closer to real-time demand fulfillment. Checkers Sixty60 moved more than 3.5 million snack units in 2024 alone, a figure projected to double by 2026. Free delivery thresholds encourage basket-building across snack categories. Spaza shop apps extend the digital wave into townships, where licensed operations now access bulk-buy pricing once reserved for formal trade.
Geography Analysis
Gauteng dominates the South Africa savory snacks market, reflecting its economic might and sophisticated retail grid that enables same-day fulfillment. High brand visibility, aggressive promotions, and a concentration of middle-income households keep per-capita snack expenditure well above the national average. Western Cape secures the second-largest stake through an affluent consumer base that values origin stories and low-oil preparation, spurring artisanal baked launches stocked in premium grocers and farmers’ markets.
KwaZulu-Natal is the fastest riser, supported by a robust Halaal certification framework that dovetails with its cultural preference for spicy snacks. The province houses two Tiger Brands plants producing 33 snack brands, ensuring local supply and export readiness. Infrastructure improvements around Durban port also streamline outbound logistics, reducing lead times to Gulf markets. Eastern Cape and a cluster of smaller provinces offer untapped upside as digital ordering and road infrastructure reduce the historic service gap between urban and rural outlets. Government investment in township business upgrades further formalizes retail nodes, deepening market penetration for established brands.
Competitive Landscape
Moderate concentration characterizes the South Africa savory snacks market. PepsiCo steers category leadership through Simba, Lay’s, and Doritos, tailoring seasoning levels to local spice thresholds and securing nationwide cold-chain coverage. AVI Limited’s Willards and Bakers portfolios leverage legacy shopper trust and multi-price-point packs to defend share at both premium and value tiers. Tiger Brands operates Fritos under license, marrying local maize know-how with international flavor IP. Kellogg’s Pringles maintains a premium stack-chip niche that appeals to urban consumers seeking international flair.
White-space innovation centers on pulse-based chips and indigenous protein crisps, where smaller firms such as Herbivore Earthfoods launch cowpea curls positioned as 100% plant-based. Multinationals form joint ventures with R&D spin-offs to secure early access to these crops, ensuring supply certainty. Packaging sustainability gains board-level attention: Guala Closures’ acquisition of Coleus Packaging strengthens local sourcing of metal caps and supports fully recyclable snack tins. Cost pressures prompt network optimization: PepsiCo shuttered a 50-year-old Frito-Lay plant to upgrade to high-throughput lines elsewhere, signaling continued footprint rationalization. Overall, a balance of global scale and local agility defines success in the competitive arena.
South Africa Savory Snacks Industry Leaders
-
PepsiCo Inc
-
AVI Limited
-
The Kellogg Company
-
Frimax Foods Private Limited
-
Truda Foods Private Limited
- *Disclaimer: Major Players sorted in no particular order
South Africa Savory Snacks Market Companies Covered in this Report
- PepsiCo Inc.
- The Kellogg Company
- AVI Limited
- Siyaya Brands Pty Ltd
- Picola Foods
- Frimax Foods (Pty) Ltd
- Super Snacks
- Truda Foods (Pty) Ltd
- Messaris Snack Foods
- Lorenz Snack-World
Recent Industry Developments in South Africa Savory Snacks Market
- June 2026: PepsiCo South Africa upgraded and refreshed parts of its Simba chips portfolio as competitive intensity increased in South African potato chips. The move emphasized product renovation to protect shelf visibility and defend brand preference as shoppers compare value and quality across established brands and private labels.
- August 2025: PepsiCo officially introduced Cheetos in South Africa, rolling out variants such as Cheetos Puffs Cheese, Cheetos Puffs Chicken, Cheetos Brix BBQ, and Cheetos Brix Spicy Tomato. The launch broadened PepsiCo's savory-snacks portfolio in the country and strengthened its ability to compete across multiple snacking occasions and price points.
- November 2024: PepsiCo South Africa completed the installation of a R746 million potato chip production line at its Isando factory, lifting production capacity by 29%. The added capacity supported higher local output and manufacturing efficiency, improving service levels to modern trade and fast-moving channels during periods of input-cost volatility.
South Africa Savory Snacks Market Report Scope and Research Methodology
Market Definition and Coverage
We define the South Africa savory snacks market as packaged savory snack foods sold for at-home and on-the-go consumption, captured in value terms across the country through retail and equivalent sales channels.
Scope exclusions: We exclude sweet snacks and desserts, as well as meals and freshly prepared hot foods sold for immediate consumption.
Segments Covered in This Report
- By Product Type
- Potato Chips
- Extruded Snacks
- Popcorn
- Nuts, Seeds, and Trail Mixes
- Meat Snacks
- Other Product Types
- By Distribution Channel
- Supermarkets/Hypermarkets
- Convenience Stores
- Online Retail Stores
- Other Distribution Channels
Data Sources, Market Sizing, and Validation
Desk Research
Desk work starts by locking the category definition and then anchoring the sizing to public demand and price signals that are available year over year. We refer to non-paywalled sources such as Statistics South Africa (consumer price and spending indicators), South African Reserve Bank series (exchange rates and inflation context), and South African Revenue Service publications for trade and customs direction, which helps explain value movement.
We also review public nutrition and food classification references, such as Codex Alimentarius guidance, to keep common snack descriptions consistent when mapping inclusions and exclusions. Annual reports, investor presentations, company press releases, and reputable business journalism are used to understand portfolio emphasis, distribution reach, and major product launches. Where helpful, we use paid subscriptions for company financials and news intelligence, and selectively, shipment-level import-export databases to sanity-check direction for ingredients and finished snack flows. These sources are not exhaustive, and other public documents were reviewed to validate inputs and clarify open questions.
Primary Interviews and Surveys
Primary work is used to validate how the category is priced, promoted, and distributed in practice, especially across chips, extruded snacks, popcorn, nuts and seeds, and meat snacks. We speak with manufacturers, distributors, retailers, and category managers in South Africa, and then use their feedback to confirm channel mix assumptions and realistic price progression before finalizing the model.
Distribution of primary research fieldwork respondents
| Company type | Respondent position |
|---|---|
| Top tier: 29% | CXOs: 17% |
| Mid tier: 50% | Functional/Unit leaders: 36% |
| Smaller Players: 21% | Managers: 47% |
Market-Sizing & Forecasting
For sizing, we start from a top-down build where South Africa savory snack value is reconstructed using observed retail price movement and category consumption direction, and then translated into annual USD value using the relevant average exchange rate timing. The output is corroborated with selective bottom-up approximations, such as sampled average pack prices times estimated channel throughput, followed by distributor and retailer checks to adjust totals when a mismatch shows up.
A few practical inputs guide the model, including snack price inflation versus overall food inflation, promotion intensity in modern retail, mix shifts toward convenience and forecourt stores, the pace of online retail adoption for packaged snacks, and commodity-linked cost pressure that can influence pricing for potato- and maize-based items. Where public data is thin, gaps are handled using interview-led ranges, and the assumption is kept visible so it can be revisited during validation. Forecasts are built using scenario analysis, where base, faster, and slower cases are linked to expected pricing behavior, household budget pressure, and distribution expansion, and then aligned to the consensus view from interviewed market participants.
Data Validation & Update Cycle
Outputs are checked through multiple steps so the final totals do not depend on one indicator. We compare implied per-capita savory snack spending direction with household expenditure signals, review whether value growth is being driven mainly by price or also by volume, and then pressure-test channel shares using what distributors and retailers say is happening on the ground.
When anomalies are found, the driver is traced back to a specific assumption, and follow-up calls are triggered if the variance cannot be explained with public evidence. Reports are refreshed annually, and interim updates are made when material events occur, such as sharp currency moves or unusually large price resets. Before delivery, an analyst runs a fresh pass on key series and the model outputs so clients receive the latest updated view.
Mordor Intelligence's South Africa Savory Snacks Market Estimate Compared With Other Published Estimates
Published market sizes for South Africa savory snacks can differ even when the category name looks identical, because each publisher can choose a different set of included products, a different value capture point, and a different timing for currency conversion. We keep the logic simple and repeatable so the same inputs can be rechecked quickly when new price or channel information becomes available.
The biggest gaps usually come from scope, and then from how price growth is applied through the forecast years and how often assumptions get refreshed. Some estimates fold adjacent packaged foods into the snack total or use broad snacks as a starting pool and then allocate shares, which changes the final value even if the growth rate looks reasonable.
Benchmark comparison
| Source | Market Size | Gaps in Research Methodology |
|---|---|---|
| Mordor Intelligence | USD 1.90 B (2025) | |
| Industry Data Publisher A | USD 2.40 B (2025) | Likely includes a wider definition that can pull in broader nuts and seeds baskets and other adjacent packaged foods, and it may also assume a higher retail value capture point across channels. |
| Trade Portal B | USD 0.75 B (2025) | Appears closer to a narrow savory snack products view, which can undercount mainstream chips and extruded snacks in modern retail, and it may reflect conservative price growth and different USD conversion timing. |
The spread is explained mainly by what is counted as a savory snack and how pricing and USD conversion are handled in the base year. The main gap comes from category inclusion, where Mordor Intelligence counts nuts and seeds only when positioned and sold as snack packs, which reduces spillover from cooking nuts and broader grocery assortments and keeps the total tied to snack purchasing behavior.
Key Questions Answered in the Report
How big is the South Africa Savory Snacks Market?
The South Africa Savory Snacks Market size is expected to reach USD 2.04 billion in 2026 and grow at a CAGR of 7.18% to reach USD 2.88 billion by 2031.
What is the current South Africa Savory Snacks Market size?
In 2026, the South Africa Savory Snacks Market size is expected to reach USD 2.04 billion.
Who are the key players in South Africa Savory Snacks Market?
PepsiCo Inc, AVI Limited, The Kellogg Company, Frimax Foods Private Limited and Truda Foods Private Limited are the major companies operating in the South Africa Savory Snacks Market.
What years does this South Africa Savory Snacks Market cover, and what was the market size in 2025?
In 2025, the South Africa Savory Snacks Market size was estimated at USD 2.04 billion. The report covers the South Africa Savory Snacks Market historical market size for years: 2019, 2020, 2021, 2022, 2023 and 2024. The report also forecasts the South Africa Savory Snacks Market size for years: 2026, 2027, 2028, 2029, 2030 and 2031.