
Market Overview
| Study Period | 2022 - 2031 |
|---|---|
| Forecast Data Period | 2026 - 2031 |
| Base Year Market Size (2025) | 2.31 gigawatt |
| Market Volume (2026) | 2.49 gigawatt |
| Market Volume (2031) | 3.65 gigawatt |
| Growth Rate (2026 - 2031) | 7.92 % |
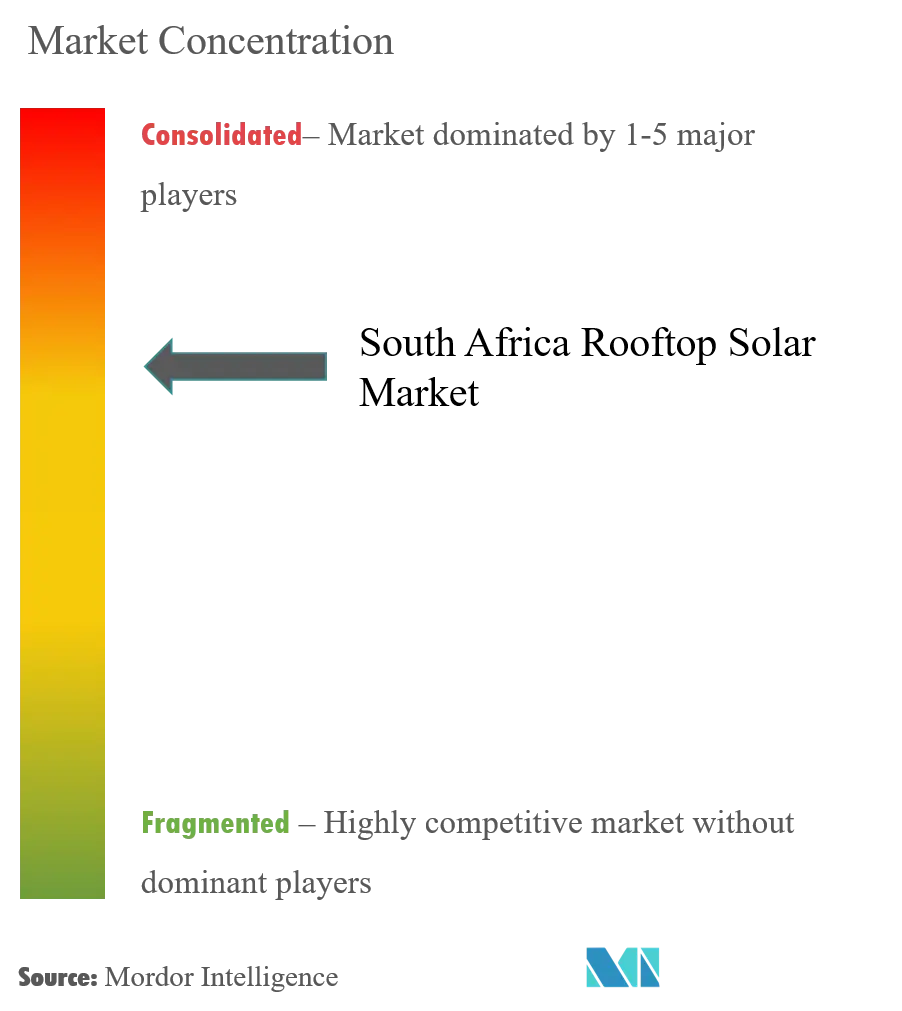
| Market Concentration | Medium |
Major Players *Disclaimer: Major Players sorted in no particular order Image © Mordor Intelligence. Reuse requires attribution under CC BY 4.0. | |
South Africa Rooftop Solar Market Analysis by Mordor Intelligence
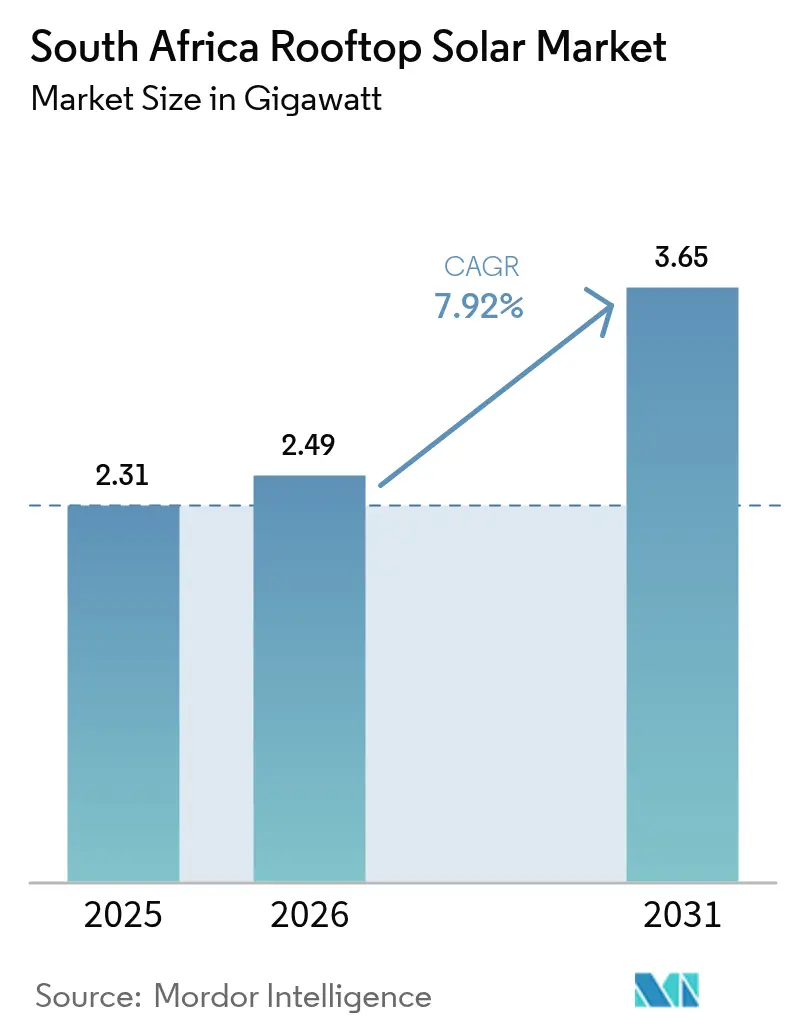
South Africa Rooftop Solar market size in 2026 is estimated at 2.49 gigawatt, growing from 2025 value of 2.31 gigawatt with 2031 projections showing 3.65 gigawatt, growing at 7.92% CAGR over 2026-2031.
Although the market studied was negatively impacted by the COVID-19 pandemic in 2020, it has recovered and reached pre-pandemic levels. The growing government support and falling cost of rooftop solar panels purchase, installation, and maintenance are expected to support the uptake of solar PV and associated systems in South Africa, driving the solar rooftop PV market's growth in the country during the forecast period. However, the high cost of solar rooftop systems and the associated need for batteries for electricity storage are expected to restrain the market's growth.
The increasing blackouts in the country are leading to the electricity crisis. Increasing demand for continuous power is expected to create several opportunities for the market players in South Africa to bridge the supply and demand gap.
Note: Market size and forecast figures in this report are generated using Mordor Intelligence’s proprietary estimation framework, updated with the latest available data and insights as of 2026.
South Africa Rooftop Solar Market Trends and Insights
The Commercial and Industrial Segment is Expected to Dominate the Market
As of 2021, the commercial and industrial sectors accounted for more than 50% of the rooftop solar installations in South Africa. Supportive policies and the development of innovative technologies are necessary for the commercial and industrial sector's growth. South African policymakers need to plan for rooftop solar systems and storage rather than just rooftop solar systems with a grid as storage (net/gross metering). The combination is cost-effective for electricity generation compared to the traditional grid supply and diesel generators.
By 2021, solar and storage were cheaper than grid supply for most commercial and industrial customers across South Africa. According to the Institute for Energy Economics and Financial Analysis, the levelized cost of energy for a 1 MW rooftop solar installation, coupled with a 250-kilowatt energy storage system, was estimated at ZAR 1.32 - 1.36/kWh in 2022. The cost of installing solar rooftop systems for commercial and industrial consumers is expected to decline during the forecast period compared to grid tariffs and the cost of the power produced by diesel generators.
The commercial and industrial sector in South Africa is expected to witness significant growth in the market during the forecast period due to affordability and the need for technology. The commercial and industrial sector generally incurs higher electricity costs for being one of the highest energy users. The sector has the best-use profiles and stands to benefit from installing rooftop solar PV systems across large roof spaces.
In March 2022, Investec Property planned to construct a solar PV rooftop plant at Cornubia Mall in Kwa-Zulu Natal, South Africa. The plant is estimated to have a DC capacity of 5.25 MWp and an AC capacity of 4.29 MW and will power the entire mall and reduce stress on the electricity grid.
Rooftop solar systems generate electricity during daylight, coinciding with the peak hours of most factory operations. Hence, while the sun is out, manufacturing facilities can either limit their dependence on the national grid or abandon it.
Commercial and industrial organizations across South Africa are gradually seeking opportunities to reduce their dependence on the state utility, which has been facing financial and operational issues.
In South Africa, commercial and industrial enterprises have many options to finance their electricity requirements. Rooftop solar systems remain the most favorable alternative to grid electricity in the country.
A growing number of commercial properties in South Africa are opting for fixed-roof rental options. Here, the unused roofs are monetized through a long-term rental agreement. The energy generated is used by the commercial property, and excess energy is sent to the grid for further distribution.
The South African government identified the significant potential of solar energy and is making efforts to increase the adoption of solar photovoltaic (PV) technology in the country's power sector.
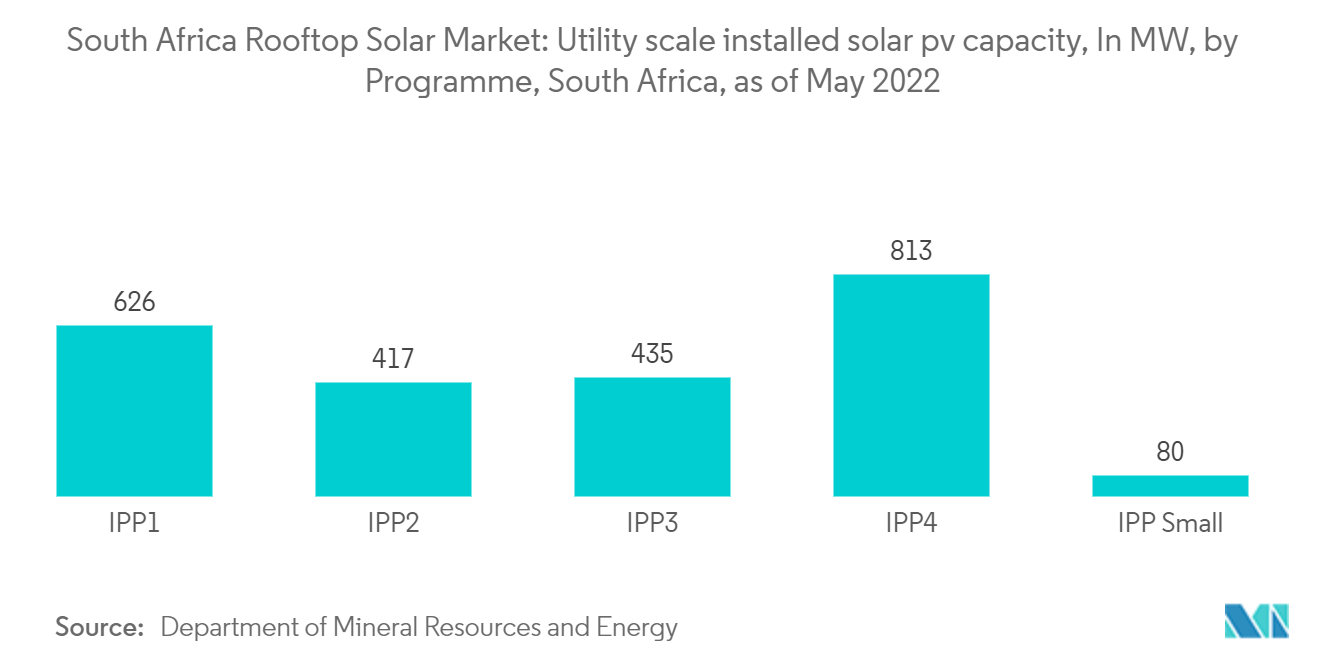
Until the introduction of the Renewable Energy Independent Power Producers Program (REIPPP) in 2011, the solar power sector was nearly non-existent. However, after the program's start, with different rounds like IPP1 with 626 MW, IPP2 with 417 MW, IPP3 with 435 MW, IPP4 with 813 MW, and IPP small with 80MW, the installed capacity for the utility-scale solar PV reached more than 2.37 GW as of May 2022. The development of such agreements in South Africa is expected to boost the demand in the commercial and industrial sectors during the forecast period.
High Domestic Solar Potential is Expected to Drive the Market's Growth
South Africa is a large country with a low population density, and due to its geographical position, the country receives a high amount of solar irradiation throughout the year. The South African government has identified the high photovoltaic potential of the country, and efforts are underway to maximize the utilization of the country's solar potential by accelerating the country-wide adoption of rooftop solar PV capacity.
South Africa has an average of more than 2,500 hours of sunshine per year, and the average solar radiation levels range between 4.5 and 6.5 kWh/m2 per day. The country's Northern Cape is one of the most attractive solar resource areas, with a daily average solar PV output capacity above 5.6 kWh/kWp.
As South Africa's climate results in year-long sunshine, the annual 24-hour global solar radiation average is about 220 W/m2. This is significantly higher when compared to certain regions in the United States (150 W/m2), Europe, and the United Kingdom (<100 W/m2).
However, due to rising energy consumption, South Africa faced an acute energy shortage, with 1130 hours of planned power cuts experienced in 2021. In March 2022, ESKOM declared that it planned 61 days of load-shedding between April 1, 2022, and August 31, 2022.
To combat this power crisis and provide energy security to its citizens, the government has been actively promoting the adoption of rooftop solar PV systems in the residential and commercial sectors. The South African government has already committed to a target of achieving net-zero emissions by 2050 and set a concrete target of an increase in the share of renewable energy from the current state of 11% to about 41% of the total electricity generation by 2030 with the hope to reduce the share of fossil fuels from 80% to about 51%. Solar PV is expected to account for nearly 8,288 MW of this total planned renewable capacity.
Most remote and indigenous communities have started to switch to rooftop solar photovoltaics to provide energy security in off-grid regions. South Africa has a huge mining industry; most mineral resources and mines are situated in the interior of the country, and the mining companies are another significant user of solar PV panels. Due to the ongoing electricity crisis, many commercial and industrial consumers are starting to invest in the installation of rooftop solar PV panels in roofs in their buildings and other facilities to power operational requirements.
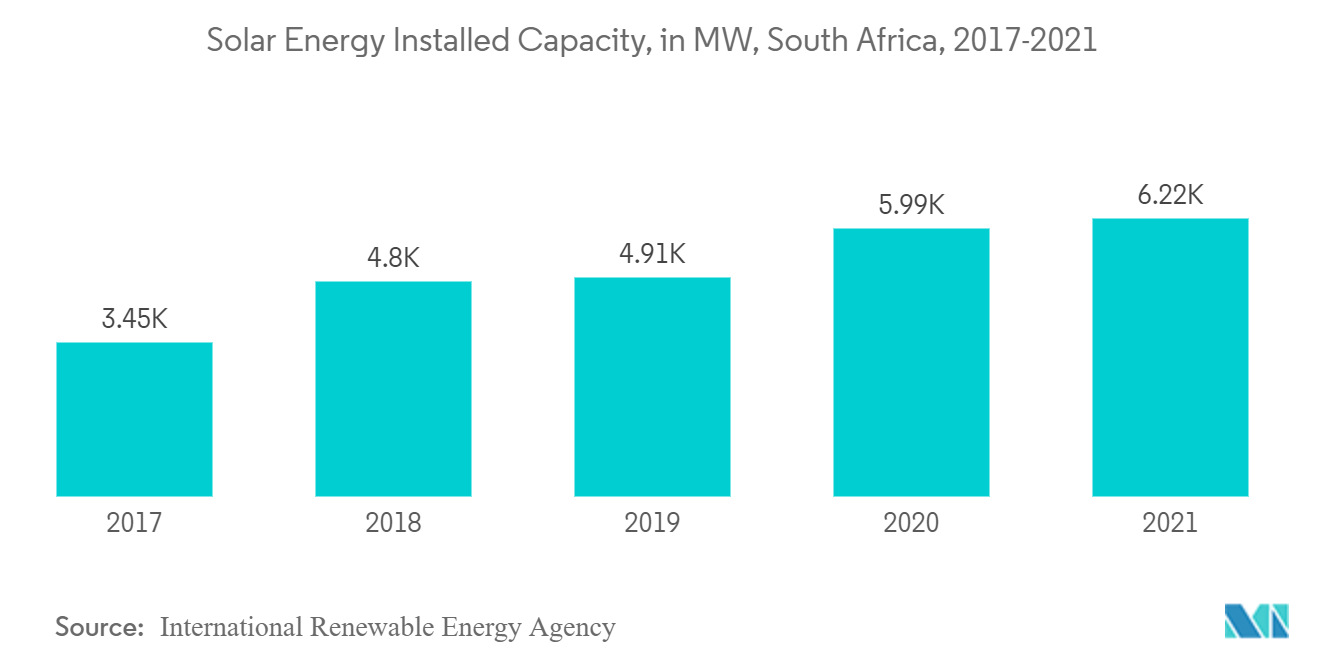
The South African solar energy capacity rose from 3450 MW in 2017 to 6221 MW in 2021, registering a growth rate of 80%.
In April 2022, Apple continued accelerating its transition toward carbon neutrality across its entire global supply chain. As part of its Power for Impact program, Apple provides local communities around the world with access to renewable energy. Solar projects in South Africa provide affordable and reliable electricity to communities suffering from significant energy challenges. In the densely populated township of Diepsloot, new solar installations have provided access to electricity to 3,500 households.
Such efforts and investments to guarantee energy security by capitalizing on the country's high photovoltaic potential are expected to drive the growth of the South African rooftop solar market during the forecast period.
Regulatory Landscape
South Africa's rooftop solar market operates under the Electricity Regulation Act framework, updated by the Electricity Regulation Amendment Act 38 of 2024, which commenced on 1 January 2025 and sets requirements that support formal integration of distributed generation. For Small-Scale Embedded Generation (SSEG), registration is tied to grid connectivity and system size: systems of 100 kW or less register with the local distributor (Eskom or the relevant licensed municipality), while systems above 100 kW register directly with NERSA. Off-grid systems without a point of grid connection are exempt.
Technical compliance for grid-tied rooftop PV is anchored by standards such as NRS 097-2 for utility interface requirements and SANS 10142-1-2 for installations from the point of supply to generator terminals. In July 2026, NERSA published draft rules to require distributors to maintain an official national register of SSEG facilities under 100 kW, with a public comment process running into August 2026, indicating continued tightening and standardization of registration and data requirements. Net-billing frameworks approved by NERSA also provide a regulated basis for prosumer export tariffs through licensed distributors, supporting more consistent compensation models where export is enabled.
Value Chain Analysis
The rooftop solar value chain in South Africa relies on imported upstream hardware (modules, inverters, and battery systems), with local assembly penetration estimated at under 15%. Local manufacturing and supply strength is higher in selected balance-of-system components, including combiner boxes, cables, monitoring systems, switchgear, and transformers, while module and battery cell supply remains highly dependent on imports and exposed to currency and logistics risks.
Downstream, market delivery is shaped by OEM presence and local entities (for example Seraphim Solar South Africa and ILB Helios Southern Africa), national wholesalers and distributors such as SegenSolar South Africa and SOLARWORLD Africa, and a large base of EPC and installer networks serving residential and C&I customers. Permitting and grid interconnection are recurring friction points, particularly where municipal processes differ and where distributor requirements apply. These constraints intersect with evolving compliance obligations under standards such as the NRS 097 series and SANS 10142-1. Trade and industrial policy measures also affect sourcing decisions, including the introduction of a 10% import duty on solar modules in July 2024 and ongoing industry feedback via SAPVIA on gaps affecting localization investment.
Competitive Landscape
The South African rooftop solar market is moderately consolidated in nature. Some of the key players in the market (in no particular order) include GENERGY, Valsa Trading (Pty) Ltd, JA Solar Holdings, Solareff (Pty) Ltd, and BrightBlack Energy, among others.
South Africa Rooftop Solar Industry Leaders
-
GENERGY
-
Valsa Trading (Pty) Ltd
-
JA Solar Holdings
-
Solareff (Pty) Ltd
-
BrightBlack Energy
- *Disclaimer: Major Players sorted in no particular order
Market Opportunities and Future Outlook
Behind-the-meter deployment creates a practical base for services beyond basic rooftop PV installation. By July 2026, installed rooftop solar capacity in South Africa had exceeded 8.3 GW, and formal market mechanisms are expanding around grid export and aggregation. NERSA-approved Net-Billing Rules (approved in December 2024) enable licensed distributors to establish tariffs for prosumers exporting surplus energy, giving customers with appropriately approved, grid-tied systems a clearer commercial route for compensation.
Opportunities are also emerging in compliance enablement and distributed flexibility. Eskom extended a waiver of registration and connection fees for SSEG systems up to 50 kVA until 30 September 2026 and included a free smart meter, supporting uptake among customers seeking compliant grid connection and potential export readiness. At the same time, aggregation and orchestration of residential batteries is becoming more mainstream, highlighted by the Plentify and Deye initiative announced in July 2026 to coordinate a large fleet of existing home batteries into a virtual power plant. On the supply side, local procurement policy actions are gaining relevance for equipment vendors and installers, with a 2026 preliminary determination considering designation of solar panels, inverters, and trackers for local procurement under the Public Procurement Act 28 of 2024, which can alter supplier qualification and sourcing strategies for project developers and distributors.
Recent Industry Developments
- July 2026: Plentify partnered with Deye to coordinate 160,000 existing residential batteries in South Africa into a virtual power plant with about 2.7 GWh of controllable capacity. The initiative shifts rooftop solar economics toward managed flexibility and grid services, increasing the role of software platforms and device interoperability alongside hardware sales.
- June 2026: Volkswagen Group Africa completed a 0.88 MW solar PV installation at its components plant in Kariega, Eastern Cape, comprising 1,410 panels. The project highlights ongoing C&I adoption, where rooftops and adjacent facilities are used to reduce grid dependence and stabilize operating costs.
- July 2024: A 10% import duty on solar modules was introduced in South Africa, adding a new cost and compliance layer for import-reliant rooftop PV supply. The change increased the importance of distributor procurement strategies and strengthened industry attention on localization pathways for modules and related components.
Research Methodology Framework and Report Scope
Market Definition and Coverage
This market covers rooftop solar photovoltaic (PV) systems installed in South Africa and tracked as installed capacity connected behind the meter across homes and commercial and industrial sites.
Scope exclusions: We exclude utility-scale ground-mounted solar plants and other non-rooftop deployment formats, even when they serve similar power needs.
Segmentation Overview
- By End User
- Residential
- Commercial and Industrial
Data Sources, Market Sizing, and Validation
Desk Research
Desk work helps us set the guardrails before sizing begins, so the model stays tied to real deployment signals in South Africa. We review public energy statistics and policy notes that influence rooftop adoption, using sources such as the Department of Mineral Resources and Energy, Statistics South Africa, the National Energy Regulator of South Africa, and the South African Revenue Service for trade indicators where relevant.
We also use market signal documents such as the South African Photovoltaic Industry Association updates, municipal tariff and embedded generation guidance, and reputable press coverage of load-shedding and electricity tariff movements. Where helpful, our analysts refer to paid subscriptions for company financials and news screening, and a patent database for technology direction checks. This list is not exhaustive, and many other sources were used for data collection, validation, and clarification during research.
Primary Interviews and Surveys
Primary work is used to pressure-test the desk assumptions, especially around rooftop project size mix, typical build timelines, and which parts of the pipeline are actually being commissioned. We speak with installers, EPC teams, developers, distributors, large site owners, and financing or advisory participants across major provinces, and responses are compared across residential and C&I buying behavior to close data gaps.
Distribution of primary research fieldwork respondents
| Company type | Respondent position |
|---|---|
| Top tier: 27% | CXOs: 17% |
| Mid tier: 52% | Functional/Unit leaders: 40% |
| Smaller Players: 21% | Managers: 43% |
Market-Sizing & Forecasting
Sizing is built around a top-down capacity reconstruction, where commissioning trends, embedded generation uptake signals, and rooftop project activity are converted into annual installed capacity additions and then rolled into an installed base. To keep it practical, the totals are then cross-checked with selective bottom-up approximations such as installer throughput checks, sampled system-size averages by customer type, and distributor channel discussions, which are used to adjust for over-counting and timing differences.
Key inputs used in the model include rooftop system size mix by end user (residential versus C&I), installation lead times, inverter and module availability conditions, electricity tariff changes that shift payback periods, and the pace of grid-connection and registration processes. When a bottom-up view is incomplete in a province or customer group, we fill gaps using conservative penetration assumptions that are later re-tested through follow-up calls. For forecasting, scenario analysis is applied so the outlook reflects different load-shedding intensity and policy enforcement outcomes, and the chosen scenario is aligned with expert consensus gathered during interviews.
Data Validation & Update Cycle
Outputs are validated through several checks so the final series is internally consistent and explainable. We compare modeled annual additions and installed base changes with independent market signals, and any sharp jumps are reviewed against known events like policy changes, tariff revisions, or supply constraints.
Before sign-off, the model goes through an analyst review path that includes variance checks versus earlier editions and a reasoned explanation for every major delta. When conflicts appear between desk indicators and interview feedback, respondents are re-contacted to confirm definitions and timing. Reports are refreshed annually, and interim updates are made when material events shift installations, pricing behavior, or registration dynamics, followed by a final pre-delivery review to ensure figures remain current.
Mordor Intelligence's South Africa Rooftop Solar Market Size Versus Other Published Estimates
Published numbers for South Africa rooftop solar often do not match because the underlying metric is not always the same, and some studies mix rooftop with broader distributed or total solar capacity. Differences also show up when one publisher reports cumulative installed base while another reports annual additions, which can look similar in words but lead to very different totals.
The biggest gaps typically come from scope boundaries and timing, such as whether private behind-the-meter systems are counted only after commissioning, and how partial-year installations are treated when activity is volatile. Currency conversion is another driver when values are published in USD, and the conversion month chosen can shift the number, especially in fast-moving periods.
Benchmark comparison
| Source | Market Size | Gaps in Research Methodology |
|---|---|---|
| Mordor Intelligence | USD 2.31 B (2025) | |
| Industry Association A | USD 6.17 B (2024) | This figure reflects private solar PV capacity reported in MW and can include non-rooftop private installations and timing cutoffs, so it does not line up with a rooftop-only installed base in a single base year. |
| Trade Journal B | USD 6.68 B (2024) | This estimate is tied to total installed solar capacity, which can fold in utility-scale projects alongside rooftops, and it may mix installed base with forward-looking statements without a consistent commissioning filter. |
The table points to a scope and metric mismatch more than a true disagreement about rooftop momentum, and in Mordor Intelligence's model the total is expressed as rooftop installed capacity for a defined base year, with utility-scale and broader solar totals kept outside the count. Once the same boundary and timing rules are applied, the remaining spread is usually explained by how commissioning dates and partial-year additions are handled, which is why our approach stays traceable to clear, repeatable inputs.
Key Questions Answered in the Report
How big is the South Africa Rooftop Solar Market?
The South Africa Rooftop Solar Market size is expected to reach 2.49 gigawatt in 2026 and grow at a CAGR of 7.92% to reach 3.65 gigawatt by 2031.
What is the current South Africa Rooftop Solar Market size?
In 2026, the South Africa Rooftop Solar Market size is expected to reach 2.49 gigawatt.
Who are the key players in South Africa Rooftop Solar Market?
GENERGY, Valsa Trading (Pty) Ltd, JA Solar Holdings, Solareff (Pty) Ltd and BrightBlack Energy are the major companies operating in the South Africa Rooftop Solar Market.
What years does this South Africa Rooftop Solar Market cover, and what was the market size in 2025?
In 2025, the South Africa Rooftop Solar Market size was estimated at 2.31 gigawatt. The report covers the South Africa Rooftop Solar Market historical market size for years: 2020, 2021, 2022, 2023, 2024 and 2025. The report also forecasts the South Africa Rooftop Solar Market size for years: 2026, 2027, 2028, 2029, 2030 and 2031.