
Market Overview
| Study Period | 2020 - 2031 |
|---|---|
| Forecast Data Period | 2026 - 2031 |
| Base Year Market Size (2025) | USD 4.21 Billion |
| Market Size (2026) | USD 4.55 Billion |
| Market Size (2031) | USD 6.69 Billion |
| Growth Rate (2026 - 2031) | 8.02 % |
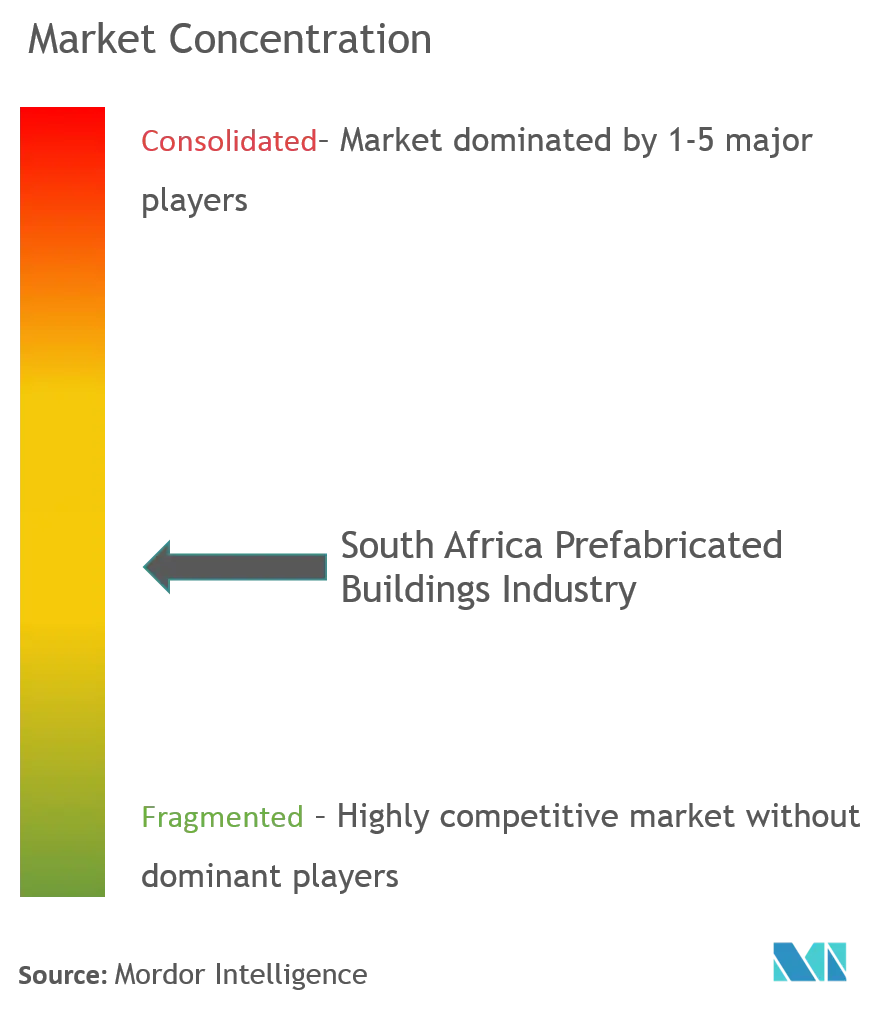
| Market Concentration | Medium |
Major Players *Disclaimer: Major Players sorted in no particular order Image © Mordor Intelligence. Reuse requires attribution under CC BY 4.0. | |
South Africa Prefabricated Buildings Market Analysis by Mordor Intelligence
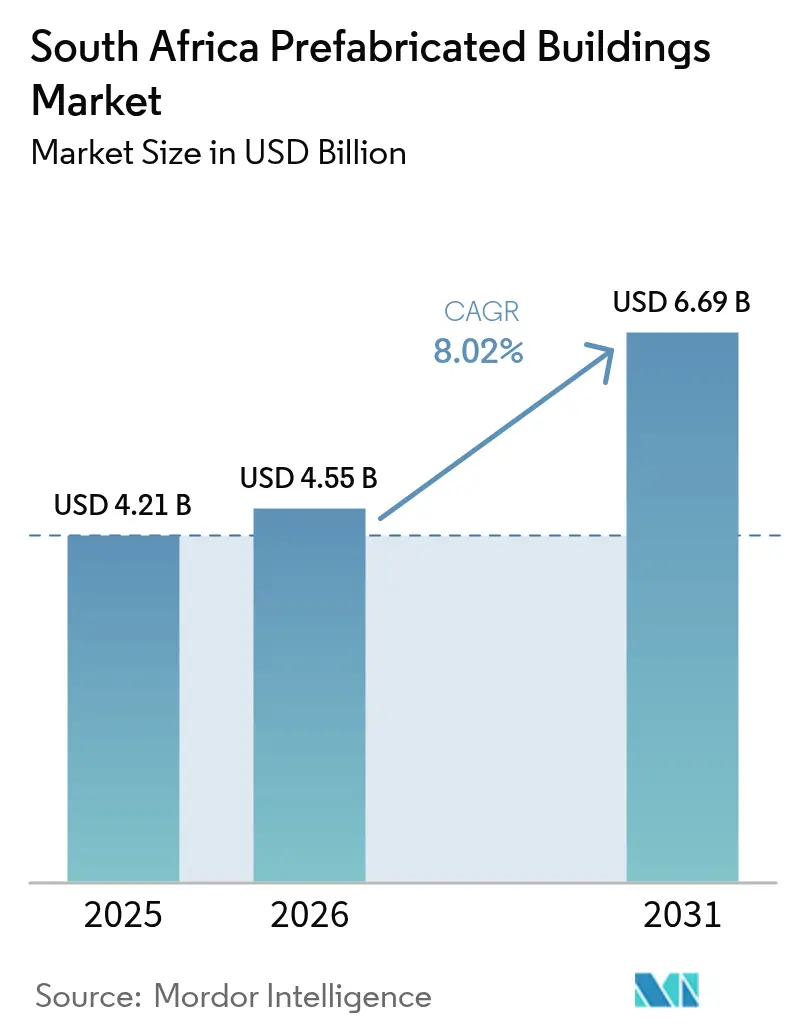
The South Africa prefabricated buildings market size is expected to grow from USD 4.21 billion in 2025 to USD 4.55 billion in 2026 and is forecast to reach USD 6.69 billion by 2031 at 8.02% CAGR over 2026-2031. Rising demand stems from a 2.3 million-unit housing deficit, the government’s fast-track infrastructure programs, and chronic power-supply disruptions that favor factory-built, solar-ready structures. The Reconstruction and Development Programme (RDP) backlog and a shift toward performance-based public tenders amplify the need for rapid-deployment solutions that avoid traditional site delays. Corporations and mining houses accelerate adoption to house workforces efficiently, while green-building mandates and load-shedding concerns position low-carbon, photovoltaic-integrated modules as premium offerings. Investors view the segment as a hedge against labor shortages and material inflation, fueling factory automation and vertical-integration strategies among leading manufacturers[1].
Key Report Takeaways
- By material, concrete systems held 43.62% of South Africa's prefabricated buildings market share in 2025; timber solutions recorded the fastest 8.76% CAGR through 2031.
- By application, residential captured 50.62% of the South Africa prefabricated buildings market size in 2025, while commercial deployments expand at an 8.37% CAGR to 2031.
- By product type, modular buildings led with 57.74% of South Africa's prefabricated buildings market share in 2025, and panelized systems posted the quickest 8.64% CAGR to 2031.
- By key city, Johannesburg accounted for 24.18% of the South Africa prefabricated buildings market size in 2025; Cape Town advances at a 8.88% CAGR through 2031.
Note: Market size and forecast figures in this report are generated using Mordor Intelligence’s proprietary estimation framework, updated with the latest available data and insights as of 2026.
Market Trends and Insights
Drivers Impact Analysis of South Africa Prefabricated Buildings Market*
| Driver | (~) % Impact on CAGR Forecast | Geographic Relevance | Impact Timeline |
|---|---|---|---|
| RDP housing backlog accelerating rapid-build demand | +1.8% | National: Gauteng, Western Cape, KwaZulu-Natal | Medium term (2-4 years) |
| Urbanisation-led 2.3 million-unit deficit | +1.5% | Johannesburg, Cape Town, Durban | Long term (≥ 4 years) |
| Mining camp demand for remote modular accommodation | +1.2% | Northern Cape, Limpopo, North West | Short term (≤ 2 years) |
| Load-shedding-proof solar-integrated modules | +1.1% | National, premium in commercial segments | Short term (≤ 2 years) |
| Edge-certified low-carbon prefab recognition | +0.9% | Western Cape, Gauteng | Medium term (2-4 years) |
| Insurance discounts for fire-resistant light-steel frames | +0.7% | High-risk areas; informal settlement upgrades | Medium term (2-4 years) |
| Source: Mordor Intelligence | |||
RDP Housing Backlog Accelerating Rapid-Build Demand
Government housing completions collapsed from more than 235,000 units in 1998-99 to 34,000 units in 2022-23, forcing municipalities to embrace modular options that slash delivery times from 18-24 months to 6-9 months. President Ramaphosa’s USD 55.6 million Northern Cape program for 4,000 units within 18 months exemplifies this urgency. Performance-based tenders now reward firms that guarantee schedules, channeling contracts toward manufacturers with proven factory capacity. Metropolitan registers in Cape Town alone list 375,000 applicants—further intensifying demand. Consequently, South Africa's prefabricated buildings market participants scale production lines to capture RDP-linked volumes.
Urbanisation-Led 2.3 Million-Unit Deficit
Formal-housing occupancy rose to 83.5% in 2024, yet the absolute shortage widened to 2.3 million units, hitting middle-income earners excluded from RDP subsidies. Prefabricated homes priced between USD 11,100-27,800 fill this gap at volumes traditional builders struggle to serve. Sustained immigration: 3.9% of residents now originate mainly from SADC statesconcentrating pressure in Gauteng and Western Cape. Financial innovators bundle mortgages with factory orders, easing access for salaried buyers. These dynamics underpin the long-run expansion of South Africa's prefabricated buildings market.
Mining Camp Demand for Remote Modular Accommodation
Kumba Iron Ore’s USD 622 million upgrade extending Sishen mine to 2044 typifies capital projects that need scalable worker housing. Modular dormitories travel by road to remote Northern Cape, Limpopo, and North West, arriving ready-wired and furnished within weeks. Operators favor relocatable units that flex with commodity cycles. Safety standards improve because assembly occurs under controlled factory conditions, lowering on-site risk. Suppliers of South Africa's prefabricated buildings market increasingly embed telecoms and solar arrays to meet miners’ off-grid requirements[2].
Load-Shedding-Proof Solar-Integrated Modules
Electricity rationing reached stage-6 levels in 2024, delaying conventional projects and inflating costs. Prefab makers pre-install PV panels and battery rails, ensuring immediate autonomy once sited. National PV capacity climbed to 8.97 GW in 2024, with private arrays contributing two-thirds of the total. Legislation enabling private wheeling accelerates rooftop adoption, making solar-ready modules the logical choice for retailers and clinics. As reliability concerns persist, solar-integrated offerings anchor premium pricing within South Africa's prefabricated buildings market.
Restraints Impact Analysis of South Africa Prefabricated Buildings Market*
| Restraint | (~) % Impact on CAGR Forecast | Geographic Relevance | Impact Timeline |
|---|---|---|---|
| Scarce domestic structural-timber supply | -1.4% | Nationwide, timber-prefab value chain | Long term (≥ 4 years) |
| Public-sector bias for brick-and-mortar tenders | -1.1% | All tiers of government | Medium term (2-4 years) |
| Prefab is perceived as “temporary” in townships | -0.8% | Township and informal areas | Long term (≥ 4 years) |
| Oversized-transport permit bottlenecks | -0.6% | Inter-provincial corridors | Short term (≤ 2 years) |
| Source: Mordor Intelligence | |||
Scarce Domestic Structural-Timber Supply
Local mills cannot meet the rising demand for graded lumber, forcing builders to import at elevated prices and longer lead times. Recent droughts degraded pine yields in regional plantations, compounding shortages. Timber-based providers hedge by blending laminated veneer lumber with recycled steel, but volume scalability remains constrained. Government forestry plans focus on conservation, so structural supply gaps may persist into the next decade, limiting the timber segment’s full potential in South Africa's prefabricated buildings market.
Public-Sector Bias for Brick-and-Mortar Tenders
Procurement officers trained on conventional standards often score modular bids lower for “innovation risk” despite cost advantages. The new Public Procurement Act adds transparency layers that could inadvertently slow approvals for unfamiliar techniques. Contractors spend extra months securing plan approvals, eroding prefab speed benefits. Industry bodies lobby for standardized specifications to level scoring criteria, but widespread adoption remains a medium-term prospect.
*Our forecasts treat driver/restraint impacts as directional, not additive. The impact forecasts reflect baseline growth, mix effects, and variable interactions.
South Africa Prefabricated Buildings Market Segment Analysis
By Material:
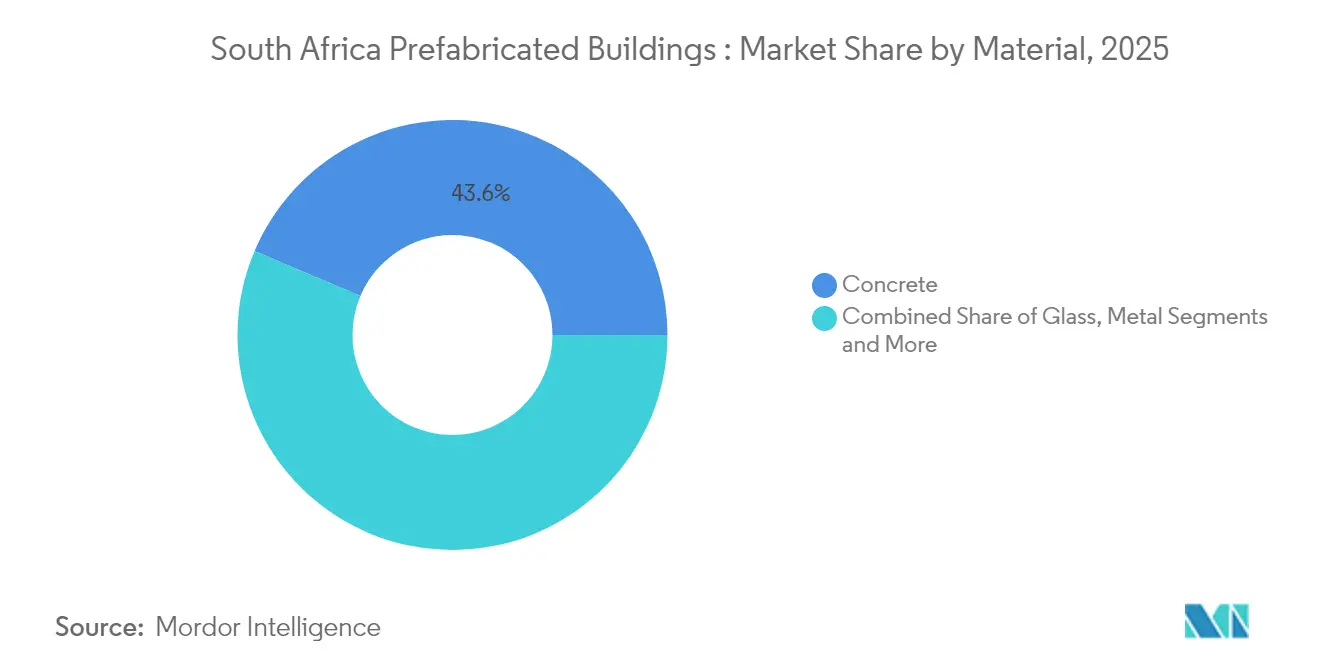
Concrete Leads While Timber Gains PaceConcrete-based units commanded 43.62% of South Africa's prefabricated buildings market share in 2025, benefiting from established codes and ready municipal acceptance. Manufacturers leverage pre-stressed panels and 3-D volumetric pods to speed high-rise social housing in Gauteng, aligning with insurers’ fire-rating criteria. Timber systems, though limited by supply, boast the quickest 8.76% CAGR on the strength of sustainability certifications and weight advantages that cut freight costs.
Concrete’s dominance also reflects well-developed domestic cement supply chains and contractors’ familiarity with load-bearing capacities. Nonetheless, timber’s low-carbon footprint meets corporate ESG mandates, drawing investment into cross-laminated-timber (CLT) pilot plants near Durban. Hybrid assemblies combining steel skeletons with timber infill emerge as compromise solutions addressing both supply and regulation. Collectively, these dynamics cement material diversification within South Africa's prefabricated buildings market.

By Application:
Residential Still Rules, Commercial AcceleratesResidential projects held 50.62% of South Africa's prefabricated buildings market size in 2025 on the back of public RDP contracts and private gap-market schemes. Modular suburbs around Johannesburg and Cape Town showcase single-family designs delivered in under 90 days. Commercial demand, while smaller, expands at an 8.37% CAGR as mines, retailers, and data-center operators favor relocatable buildings that scale with operations.
Mining camps require durable dorms for rotating crews, and corporate head offices adopt modular annexes to sidestep zoning delays. Education and healthcare modules also rise, tapped by the USD 266.7 billion national infrastructure pipeline to deliver rural clinics swiftly. Load-shedding resilience adds momentum across all end-uses, pushing developers toward integrated PV-battery packages.
By Product Type:
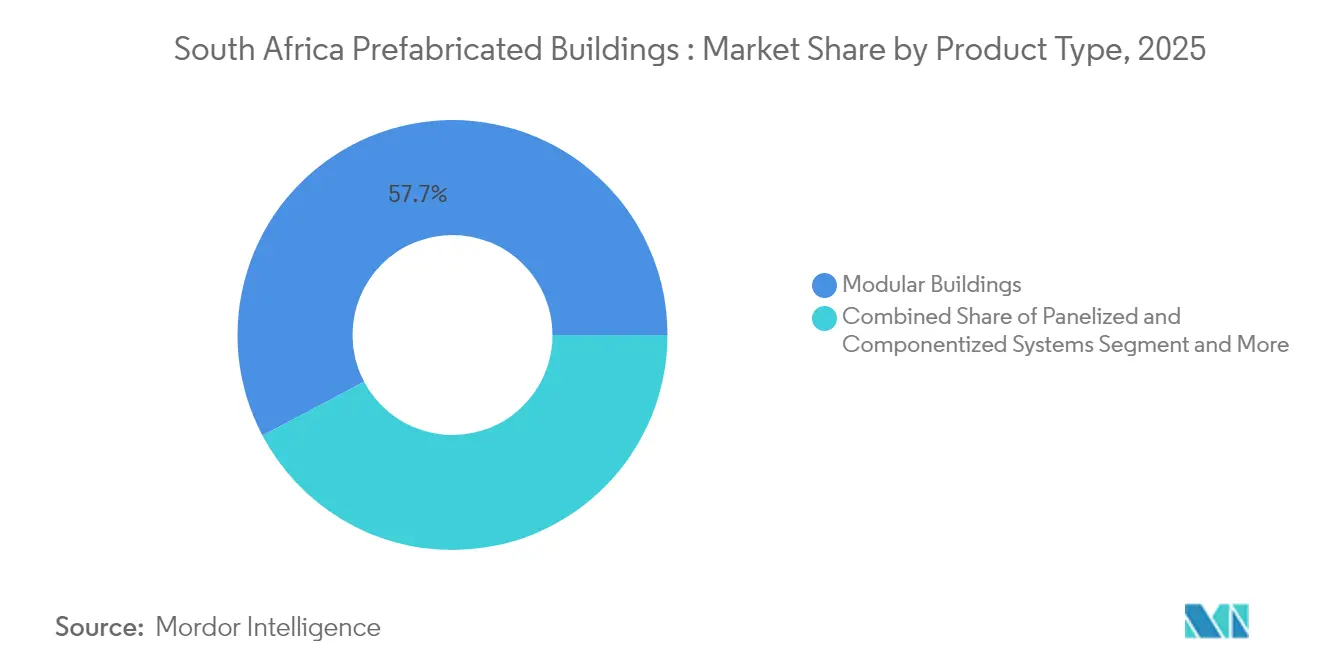
Modular Dominates, Panelized SurgesFully assembled modular blocks captured 57.74% of South Africa's prefabricated buildings market share in 2025, capitalizing on acute skilled-labor shortages. Factory automation ensures predictable quality and halves onsite labor hours. Panelized kits gain ground at an 8.64% CAGR because they fit standard trucks, reducing escort costs and simplifying inter-provincial shipping.
Growth in panelized solutions also links to rooftop-solar integration carried out on production lines for precise mounting angles. Componentized frames serve niche sectors such as telecom shelters. Looking ahead, digital twins and BIM-enabled factories will likely enhance accuracy, supporting tighter tolerances demanded by green-building schemes, further boosting both modular and panelized adoption.
Geography Analysis
South Africa's prefabricated buildings market clusters around Gauteng, where Johannesburg’s 24.18% share reflects the province’s economic gravity, high homeless headcount, and the presence of corporate headquarters seeking flexible offices. Load-shedding vulnerability in the region accelerates demand for solar-integrated modules that keep operations running during grid curtailments. Proximity to cement and steel suppliers further cements Gauteng’s leadership.
Western Cape delivers the fastest 8.88% CAGR through 2031 as Cape Town rolls out inclusionary-housing bylaws and green-building incentives. Developers target vacant inner-city parcels with vertical modular blocks that satisfy density goals while meeting Six-Star Green Star benchmarks. The city’s tech sector, hosting Amazon’s regional campus, values quick-fit offices and data-center shells that minimize disruption.
KwaZulu-Natal, Eastern Cape, and Free State contribute incremental growth. Durban’s port logistics upgrade spurs prefab warehouses, while Eastern Cape’s auto hubs need supplier parks erected to tight schedules. Free State municipalities pilot modular clinics under the national health-insurance rollout. In the Northern Cape, mining investments such as Sishen’s life-extension drive large orders for dormitories and process buildings, reinforcing the technology’s credibility in extreme environments.
Remote rural areas collectively account for growing volumes as the USD 55.6 million Northern Cape housing drive showcases prefab viability under sparse infrastructure conditions. Government agencies embrace containerized classrooms and clinics to meet service obligations quickly. Rising immigrant settlement outside metros broadens geographic demand, making South Africa's prefabricated buildings market genuinely nationwide.
Regulatory Landscape
South Africa regulates prefabricated buildings under the National Building Regulations and Building Standards Act, 1977 (Act 103 of 1977) and the National Building Regulations, with SANS 10400 setting the performance-based framework used by local authorities to assess compliance. Where applicable, prefabricated and modular systems can use deemed-to-satisfy provisions, while novel systems typically require technical assessment and certification to support plan approvals.
Agrément South Africa (ASA) is a key pathway for Innovative Building Technologies (IBTs) and other non-standard systems that do not have a dedicated SANS standard. ASA certification is frequently used by municipalities and project stakeholders as the primary technical proof point for acceptance. For housing delivery, the National Home Builders Registration Council (NHBRC) shapes compliance and inspection requirements, including IBT-focused programs for subsidised housing, while structural elements such as timber roof trusses need competent-person sign-off in line with engineering-profession requirements and the related inspection processes.
Value Chain Analysis
The value chain runs from design and engineering (architects, competent persons, and BIM-enabled detailing) to input supply (cement and aggregates, steel and light-steel framing, glazing, fasteners, insulation, and imported graded structural timber where needed), then factory manufacturing for panelised systems, volumetric modules, and sub-assemblies. It continues through logistics, including abnormal-load transport, escorts, and inter-provincial permitting, before on-site installation, commissioning, and lifecycle services such as maintenance, relocation, and refurbishment. Standards and certification are built into each step, with SANS 10400 alignment, Agrément South Africa certification for innovative systems, and NHBRC-related requirements influencing what can be produced, insured, and financed for housing applications.
In 2026, government actions pushed demand signals deeper into the chain, encouraging manufacturers and suppliers to align capacity, traceability, and documentation with public-sector procurement and compliance needs. The Department of Human Settlements requirement that provinces and metropolitan municipalities allocate at least 2% of 2026/27 housing grants to IBTs, along with the February 2026 IBT Summit in Nasrec, Johannesburg, which formed a Social Compact with industry and financiers, strengthened the pipeline for certified off-site solutions and increased the importance of factory capability, quality systems, and financeability.
Competitive Landscape
The competitive landscape in 2024 remains moderately fragmented, with several key players driving innovation and growth. Kwikspace Modular Buildings and Waco Modular, leveraging national depot networks, ensure the delivery of turn-key camps within a swift two-week timeframe. Both companies are investing in robotic welding lines and digital-traceability systems to meet the latest procurement audit requirements. Meanwhile, Concor’s Modular Division stands out by offering tailored financing packages for "missing middle" buyers, effectively addressing the needs of the gap-housing segment.
Emerging players are focusing on specialized niches, such as solar-ready and fire-resistant solutions. For example, Eco-Frame is developing light-steel assemblies pre-wired for 10 kW rooftop solar arrays, catering to clients seeking alternatives to mitigate load-shedding challenges. TimberFrame SA collaborates with plantation owners to secure FSC-certified materials, emphasizing material traceability for environmentally conscious developers. Additionally, strategic partnerships with insurance companies provide premium discounts, influencing purchase decisions in favor of these solutions. Foreign interest in the market is driving increased M&A activity. A European prefab company is reportedly exploring a minority stake in a Gauteng factory to establish a presence in Southern Africa. Local companies are responding by scaling up their operations—Kwikspace, for instance, has announced a 25,000 m² expansion at its Pretoria facility. They are also adopting Building Information Modeling (BIM) to reduce design-to-manufacture cycles to just 10 days. In the South African prefabricated buildings market, success is increasingly defined by a combination of innovation and scalability.
South Africa Prefabricated Buildings Industry Leaders
-
Kwikspace Modular Buildings
-
Waco Modular (Pty) Ltd
-
Module Solutions Africa
-
Afripanel Building Systems
-
Concor (Modular Division)
- *Disclaimer: Major Players sorted in no particular order
South Africa Prefabricated Buildings Market Companies Covered in this Report
- Kwikspace Modular Buildings
- Waco Modular (Pty) Ltd
- Module Solutions Africa
- Afripanel Building Systems
- Concor (Modular Division)
- Robin Johnson Engineering
- BMarko Structures SA
- Abod Shelters
- Green Modular Systems
- SANJO Structures
- Rapid Deployable Shelters
- Johnson Crane Hire (module logistics)
- Stefanutti Stocks (Industrial Modules)
- Raubex Housing
- GASS Architecture Studios (Prefab Design)
- FFG Building Solutions
- Vulindlela Holdings
- Murray & Dickson Modular
- Badger Holdings Modular Homes
- Absa Modular Finance
Read Analysis of South Africa Prefabricated Buildings Companies
Market Opportunities and Future Outlook
A key white-space is scaling IBTs from episodic pilots into repeatable, financeable housing delivery models, supported by the policy shift anchored in the 2024 White Paper on Human Settlements and the 2026/27 requirement to channel at least 2% of provincial and metropolitan housing grants to IBTs. This opens near-term procurement room for manufacturers with Agrément South Africa-certified systems and NHBRC-aligned quality practices, particularly for panelised and modular typologies that can be replicated across provinces and metros. Standard-setting and technical validation also remains a practical lever, given government work to finalize performance-based national norms and standards and the use of validation platforms such as the Eric Molobi Housing Innovation Hub to help shorten approvals and broaden municipal acceptance.
Outside state housing, resilience and energy-ready modules provide investable demand proof points, especially where continuity during load-shedding is valued. Commercial deployments also support repeat demand for relocatable buildings where speed translates into downtime avoidance. With national PV capacity at 8.97 GW in 2024 and private installations contributing a large share, solar-ready prefab packages and pre-wired balance-of-system integration offer a product-led route to premium offerings for retailers, clinics, and industrial users. On the supply side, domestic structural-timber scarcity keeps room for hybrid designs and alternative material strategies, while logistics and permitting constraints support demand for more panelised formats, regional assembly hubs, and partnerships with abnormal-load transport specialists.
Recent Industry Developments in South Africa Prefabricated Buildings Market
- May 2026: Kwikspace Modular Buildings achieved BS EN 1365-1:2012 compliance for fire resistance of load-bearing walls for its Kwik Fire Wall Panel, positioning it as a differentiated local supplier for fire-rated modular and panelised applications. The milestone strengthens acceptance in specifications where third-party fire performance evidence is required, supporting broader use beyond temporary buildings.
- April 2026: Waco Modular completed an expansion of its Jet Park factory in Boksburg, adding 660 m2 of undercover assembly area to double output capacity. Higher throughput and improved production flow supports shorter lead times and larger multi-site rollouts for sectors such as education and mining.
- August 2024: Kumba Iron Ore committed USD 622 million to extend the life of the Sishen mine, reinforcing demand for modular camps and relocatable workforce accommodation in remote operating areas. Mine-linked capex of this scale sustains repeat orders for durable modules and associated services such as logistics, installation, and refurbishment.
South Africa Prefabricated Buildings Market Report Scope and Research Methodology
Market Definition and Coverage
For this study, the market covers prefabricated buildings in South Africa that are manufactured offsite and then transported for on-site installation, including modular and panelized building solutions sold for residential, commercial, and other building needs.
Scope exclusions: We exclude conventional on-site construction work that does not materially use factory-built building modules or panelized structural systems.
Segments Covered in This Report
- By Material
- Concrete
- Glass
- Metal
- Timber
- Other Materials
- By Application
- Residential
- Commercial
- Others
- By Product Type
- Modular Buildings
- Panelized & Componentized Systems
- Other Prefab Types
- By Key Cities
- Johannesburg
- Cape Town
- Durban
- Port Elizabeth
- Bloemfontein
- Pretoria
- Rest of South Africa
Data Sources, Market Sizing, and Validation
Desk Research
Desk work was used to set the market boundaries, identify the most common prefab formats used locally, and build a clean demand map across housing, commercial builds, and temporary site needs. We leaned on public construction and macro signals from sources such as Statistics South Africa, the South African Reserve Bank, National Treasury budget documents, and the Department of Trade, Industry and Competition releases to understand activity levels and investment priorities.
To avoid relying on one single dataset, we also checked supporting indicators such as building plans and completions published in national statistics, public procurement notices and tender portals, and import and export disclosures for relevant building materials (where prefabrication pull-through is visible). Company annual reports, investor presentations, and reputable press coverage were used to validate project timing and pricing direction. Subscription databases for company financials, patent activity, and shipment-level trade were referenced selectively to close gaps. The sources listed here are illustrative, and many other public documents and data points were also used for validation and clarification during the work.
Primary Interviews and Surveys
Primary interviews and surveys were used to pressure-test the model assumptions on prefab penetration, typical project sizing, and price movement across modular and panelized solutions. We spoke with a mix of manufacturers, distributors, project contractors, and large buyers (including housing and commercial project stakeholders) across major metros and secondary cities. We then re-checked key inputs where responses did not align with desk signals.
Distribution of primary research fieldwork respondents
| Company type | Respondent position |
|---|---|
| Top tier: 31% | CXOs: 14% |
| Mid tier: 54% | Functional/Unit leaders: 34% |
| Smaller Players: 15% | Managers: 52% |
Market-Sizing & Forecasting
Sizing starts from a top-down build that reconstructs the addressable prefab demand pool from construction activity in South Africa and the share of projects that practically adopt offsite-built structures. We then corroborate totals using selective bottom-up approximations, such as sampled project values by building type, typical module counts for common site formats, and a price-per-square-meter check gathered through channel discussions. The totals are adjusted only when the checks consistently point in one direction.
A few inputs carry most of the weight in this market model, which is why they were tracked closely and refreshed through interviews. These include the pace of residential starts and completions, commercial building activity in key metros, public infrastructure and housing pipeline visibility, import intensity for metal and timber building inputs, and the observed spread between temporary and permanent prefab structures in the project mix. Pricing was handled through ranges for installed system value, followed by an assumption set for how steel, cement, and transport costs flow into prefab selling prices.
Forecasts were built using scenario analysis that links construction activity, public spending intent, and prefab adoption trends into a base case, with alternative cases to reflect swings in project approvals and input cost volatility. Where bottom-up evidence was thin in smaller cities or niche applications, gaps were filled using conservative penetration rates and then re-checked with supplier and contractor feedback to keep totals realistic.
Data Validation & Update Cycle
Validation is done by comparing model outputs against independent signals, such as national construction indicators, visible project pipelines, and price movement consistency with key material cost trends. Any sharp swings by year, application, or material type are reviewed, the assumptions are revisited, and respondents are re-contacted when the variance cannot be explained by a clear market event.
Before sign-off, the model and key inputs go through multi-step analyst review so the math, definitions, and year-to-year movements are internally consistent. The report is refreshed annually, and interim updates are triggered when material events occur, such as policy shifts, major procurement cycles, or large changes in building input costs. Right before delivery, we do a fresh pass to make sure clients receive the most up-to-date view available.
Mordor Intelligence's South Africa Prefabricated Buildings Market Estimate Compared With Other Published Estimates
Published market values for prefabricated buildings in South Africa often look different because the scope line is drawn differently and because pricing and adoption assumptions are handled in different ways. The year selected as the anchor also matters, since construction cycles and material prices can shift quickly and change the value outcome.
Some estimates fold in broader offsite construction spend, including adjacent site services and conventional building components sold through general construction channels. In Mordor Intelligence, the value is counted only for factory-built building structures that are delivered for on-site assembly, and the total is then checked against project activity and realistic installed pricing ranges.
Benchmark comparison
| Source | Market Size | Gaps in Research Methodology |
|---|---|---|
| Mordor Intelligence | USD 4.21 B (2025) | |
| Industry Association A | USD 3.70 B (2025) | Uses a narrower lens that leans toward formal, permanent building programs and may undercount temporary and mixed-use prefab deployments, and it can apply conservative installed price assumptions during periods of input-cost volatility. |
| Trade Journal B | USD 5.10 B (2025) | Often captures a wider offsite construction basket, which can blend prefab building systems with related site works and general construction components, and it may rely on headline project values without a consistent adjustment for what is truly prefabricated. |
The spread in the table is mainly explained by what gets counted as prefab value and how installed pricing is normalized across project types. By tying the model to observable construction activity, a practical adoption rate, and price ranges that can be re-checked in the channel, the estimate stays traceable to clear steps that a buyer can revisit and update.
Key Questions Answered in the Report
What is the 2026 value of South Africa prefabricated buildings market?
The market is estimated at USD 4.55 billion for 2026, reflecting robust housing and infrastructure demand.
How fast is the market expected to grow to 2031?
Revenues are projected to rise to USD 6.69 billion by 2031, translating into an 8.02% CAGR over 2026-2031.
Which material dominates current prefab adoption?
Concrete systems lead with 43.62% market share in 2025 share due to regulatory familiarity and strong local supply chains.
Why are solar-integrated modules gaining popularity?
Chronic load-shedding and a 8.97 GW national PV base encourage customers to choose factory-fitted photovoltaic roofs that keep buildings operational during outages.
Which city offers the highest growth potential?
Cape Town records the fastest 8.88% CAGR through 2031 as green-building rules and an acute housing backlog spur modular adoption.
How does public procurement affect vendors?
The new Public Procurement Act’s tech-driven transparency raises compliance hurdles but could favor prefab firms that provide standardized, data-rich project documentation.