
South Africa Paints And Coatings Market Size and Share
Market Overview
| Study Period | 2020 - 2031 |
|---|---|
| Forecast Data Period | 2026 - 2031 |
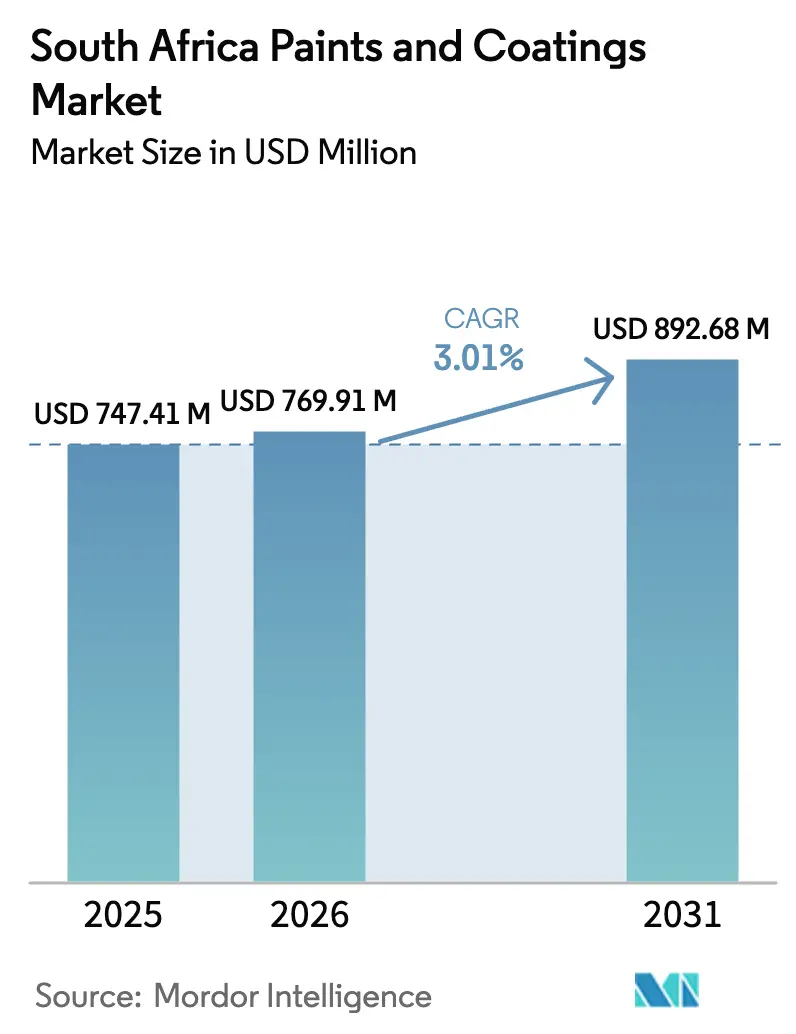
| Base Year Market Size (2025) | USD 747.41 Million |
| Market Size (2026) | USD 769.91 Million |
| Market Size (2031) | USD 892.68 Million |
| Growth Rate (2026 - 2031) | 3.01 % |
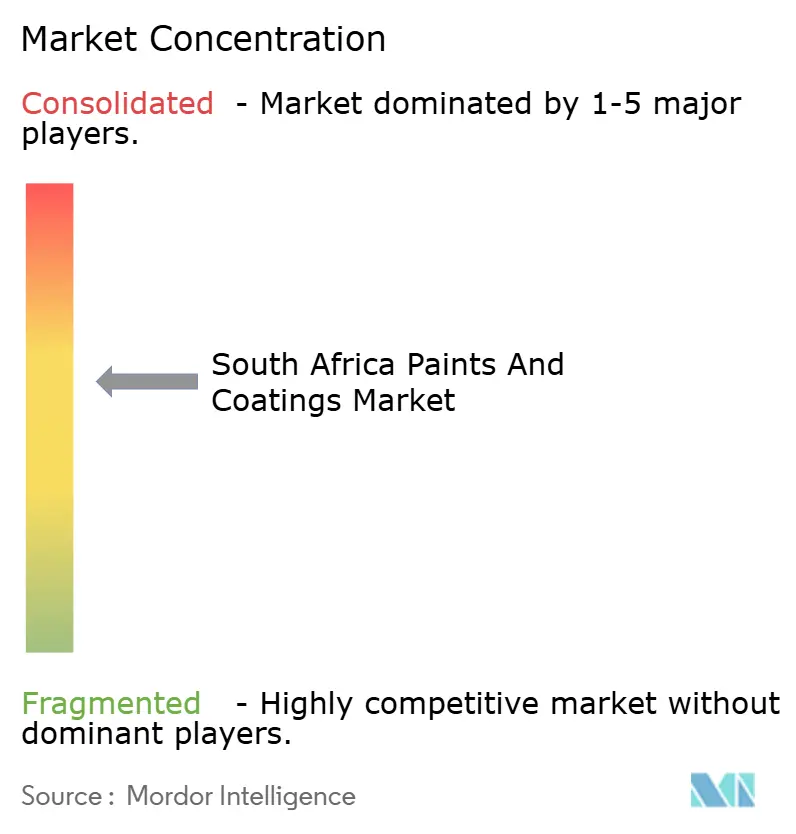
| Market Concentration | Medium |
Major Players *Disclaimer: Major Players sorted in no particular order Image © Mordor Intelligence. Reuse requires attribution under CC BY 4.0. | |
South Africa Paints And Coatings Market Analysis by Mordor Intelligence
South Africa Paints and Coatings Market size in 2026 is estimated at USD 769.91 million, growing from 2025 value of USD 747.41 million with 2031 projections showing USD 892.68 million, growing at 3.01% CAGR over 2026-2031. Demand benefits from a USD 54.5 billion public-sector infrastructure pipeline, an end to power-supply interruptions, and progressive environmental regulation that accelerates water-borne and bio-based technology adoption. Local OEM vehicle production is scaling up, spurring high-performance refinish demand, while the renewable-energy build-out opens niche opportunities for corrosion-resistant protective systems. Input-cost pressures tied to titanium dioxide volatility and escalating carbon-tax liabilities temper margins, yet they also encourage reformulation and operational efficiencies. Competitive intensity remains pronounced as multinational leaders and well-resourced local firms emphasize sustainable product portfolios, robust distribution, and digital color-matching tools to cultivate customer loyalty.
Key Report Takeaways
- By resin type, acrylic formulations held 37.62% of the South Africa paints and coatings market size in 2025, and polyurethane resins are forecast to grow the fastest at a 2.98% CAGR.
- By technology, water-borne systems captured 50.10% of the South Africa paints and coatings market share in 2025 while advancing at a 4.19% CAGR through 2031.
- By end-user industry, automotive applications posted the highest projected growth at a 3.39% CAGR to 2031, whereas architectural coatings retained 65.62% revenue share in 2025.
Note: Market size and forecast figures in this report are generated using Mordor Intelligence’s proprietary estimation framework, updated with the latest available data and insights as of 2026.
South Africa Paints And Coatings Market Trends and Insights
Drivers Impact Analysis*
| Drivers | (~) % Impact on CAGR Forecast | Geographic Relevance | Impact Timeline |
|---|---|---|---|
| Rising construction and infrastructure pipeline (2025–2030) | +1.2% | National, concentrated in Gauteng, Western Cape, KwaZulu-Natal | Medium term (2-4 years) |
| Expanding automotive OEM and aftermarket paint demand | +0.8% | National, centered in Gauteng automotive hub | Medium term (2-4 years) |
| Surge in water-borne and bio-based formulations post-carbon-tax | +0.6% | National, with early adoption in major industrial centers | Short term (≤ 2 years) |
| Growth in renewable-energy assets needing corrosion protection | +0.4% | Northern Cape, Western Cape renewable energy corridors | Long term (≥ 4 years) |
| OEM warranty extension spurring high-performance refinish | +0.3% | National, focused on major metropolitan areas | Medium term (2-4 years) |
| Source: Mordor Intelligence | |||
Rising Construction and Infrastructure Pipeline Drives Protective Coatings Demand
Government commitments totaling USD 54.5 billion through 2027 encompass transport corridors, power generation, and water projects that all require large coating volumes. Municipal wastewater upgrades, such as Cape Town’s ZAR 45 billion program, need chemical-resistant linings, while national highway refurbishments consume high-build alkyd alternatives. Renewable-energy corridors call for UV-stable and anti-corrosive systems that withstand arid conditions. These multipronged programs extend through 2030, ensuring predictable demand even though execution delays and funding constraints could soften annual volumes.
Automotive Sector Expansion Accelerates OEM and Refinish Growth
Vehicle output climbed to 667,399 units in 2024 as BMW, Stellantis, and others invested nearly ZAR 7 billion to expand or retool local plants[1]. The Automotive Production Development Program’s localization incentives funnel procurement toward domestic coating suppliers that can meet OEM performance specifications. A 13.3 million-unit vehicle parc sustains aftermarket repaint volumes, while prolonged ownership cycles and extended warranties increase the need for higher-end polyurethane clearcoats. Although battery-electric vehicles represent under 1% of new sales, specialized insulative and thermal-management coatings are gaining traction among Tier-1 suppliers.
Water-Borne Formulation Adoption Accelerated by Environmental Compliance
Water-borne systems already dominate with a 50.22% share, and Kansai Plascon has commercialized sub-5 g/L VOC products that align with emerging air-quality norms. Domestic startups such as A-Gain leverage industrial byproduct streams to formulate eco-friendly coatings certified by Agrément South Africa. Market acceptance is accelerating because water-borne chemistries now offer comparable durability, better indoor-air quality, and increasingly competitive cost of application.
Renewable-Energy Infrastructure Creates Specialized Coatings Opportunities
The government targets a 49% renewable share in the power mix by 2030, complemented by a green-hydrogen roadmap that could add 3.6% to GDP[2]. Northern Cape electrolyzer projects and coastal ammonia bunkering terminals require advanced epoxy and polysiloxane coatings capable of withstanding chemical attack and salt-spray corrosion. Wind-turbine towers and solar tracker systems demand UV-stable polyurethane topcoats that can handle thermal cycling in desert climates. Certification needs and higher technical complexity narrow supplier pools, allowing experienced players to secure premium pricing and long-term service agreements.
Restraints Impact Analysis*
| Restraints | (~) % Impact on CAGR Forecast | Geographic Relevance | Impact Timeline |
|---|---|---|---|
| Volatile TiO₂ and solvent input prices | -0.9% | National, affecting all manufacturers | Short term (≤ 2 years) |
| Tightening VOC and HAP regulations | -0.4% | National, with stricter enforcement in major metros | Medium term (2-4 years) |
| Load-shedding-related production downtime | -0.2% | National, historically concentrated in industrial hubs | Short term (≤ 2 years) |
| Source: Mordor Intelligence | |||
Titanium Dioxide Price Volatility Pressures Manufacturing Margins
TiO₂ comprises 20-30% of the typical formulation cost, and delivered prices rose 2024-2025 as EU anti-dumping duties redirected Chinese surplus toward Africa. Logistics bottlenecks at Durban and Cape Town ports raised freight surcharges by 12-18%. Limited global producer diversity constrains bargaining power, forcing local manufacturers either to absorb costs or risk market-share erosion if they raise prices. Margin compression diverts funds from research and development and capacity expansion, especially for small and midsize firms.
Environmental Regulations Increase Compliance Costs and Reformulation Requirements
A 90 ppm lead limit became mandatory in May 2025, obliging producers to test every new batch and issue declarations of conformity. VOC emission standards under the National Environmental Management: Air Quality Act require continuous monitoring and annual reporting, entailing capital outlays for abatement systems. Carbon-tax escalation further burdens solvent-based operations. Firms lacking research and development scale or environmental engineers may exit or merge, elevating compliance barriers and potentially reducing customer choice.
*Our forecasts treat driver/restraint impacts as directional, not additive. The impact forecasts reflect baseline growth, mix effects, and variable interactions.
Segment Analysis
By Resin Type: Acrylic Dominance Faces Polyurethane Momentum
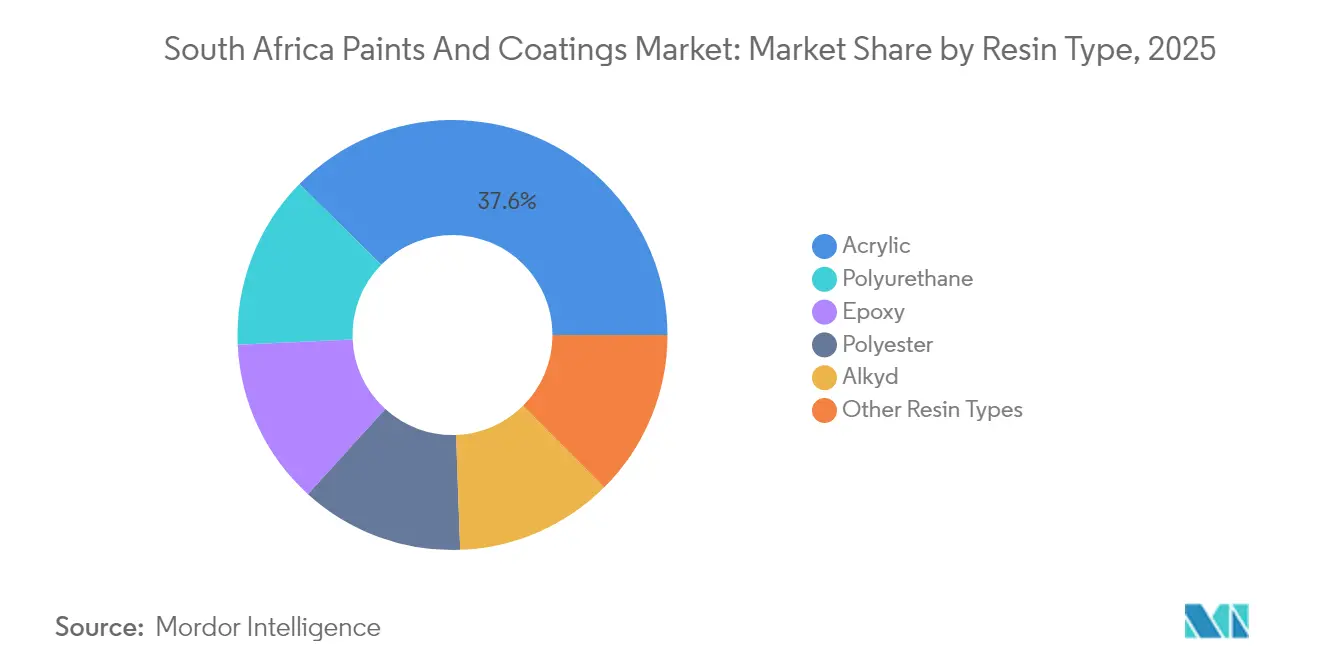
Acrylic formulations retained 37.62% of the South Africa paints and coatings market share in 2025 because they pair well with water-borne systems and offer superior weatherability for architectural façades. Polyurethane demand is rising at a 2.98% CAGR, mainly from automotive clearcoats, industrial maintenance, and protective topcoats that must resist abrasion, chemicals, and UV degradation. Alkyd volumes are easing as long-drying, high-VOC profiles become untenable under stricter air-quality rules. Epoxy systems hold niche but critical slots in chemical plants, offshore rigs, and potable-water tanks where adhesion and barrier performance outweigh price premiums. Polyester resins sustain a limited foothold in powder-coating lines, while silicones and fluoropolymers address extreme-temperature or anti-graffiti needs.
Polyurethane’s ascent mirrors a market preference for coatings that extend maintenance intervals, thereby reducing lifecycle costs for infrastructure owners and fleet operators. Formulators leverage aliphatic grades for color-fast exterior applications and aromatic grades in factory floors and heavy-equipment primers. As OEM warranties lengthen, collision-repair shops gravitate toward higher-solids polyurethane clearcoats that can restore factory gloss in fewer layers, keeping labor inputs low and throughput high.

By Technology: Water-Borne Systems Lead a Broad Environmental Transition
Water-borne coatings controlled 50.10% of the South Africa paints and coatings market in 2025 and hold the fastest growth trajectory at a 4.19% CAGR, underscoring regulatory pull and performance parity with solvent-borne equivalents. Solvent-borne products retain share in automotive metallics, marine systems, and certain industrial lines where flow and chemical resistance remain paramount, but continuous solvent-reduction innovations are chipping away at these bastions. Powder coatings carve out volumes in appliances, metal furniture, and vehicle rims, offering zero-VOC credentials and near-100% material utilization. UV-cured coatings are gaining mindshare for plastic parts and flooring because instantaneous curing accelerates production, though adoption is tempered by equipment costs.
Capital expenditure on water-borne scale-up—such as new resin reactors and stainless-steel pipes—presents an entry barrier, favoring incumbents with balance-sheet strength. Technological collaboration with multinational raw-material suppliers accelerates local know-how transfer, enabling domestic firms to supply compliant, performance-verified products without importing finished goods.
By End-User Industry: Architectural Base with Accelerating Automotive Upside
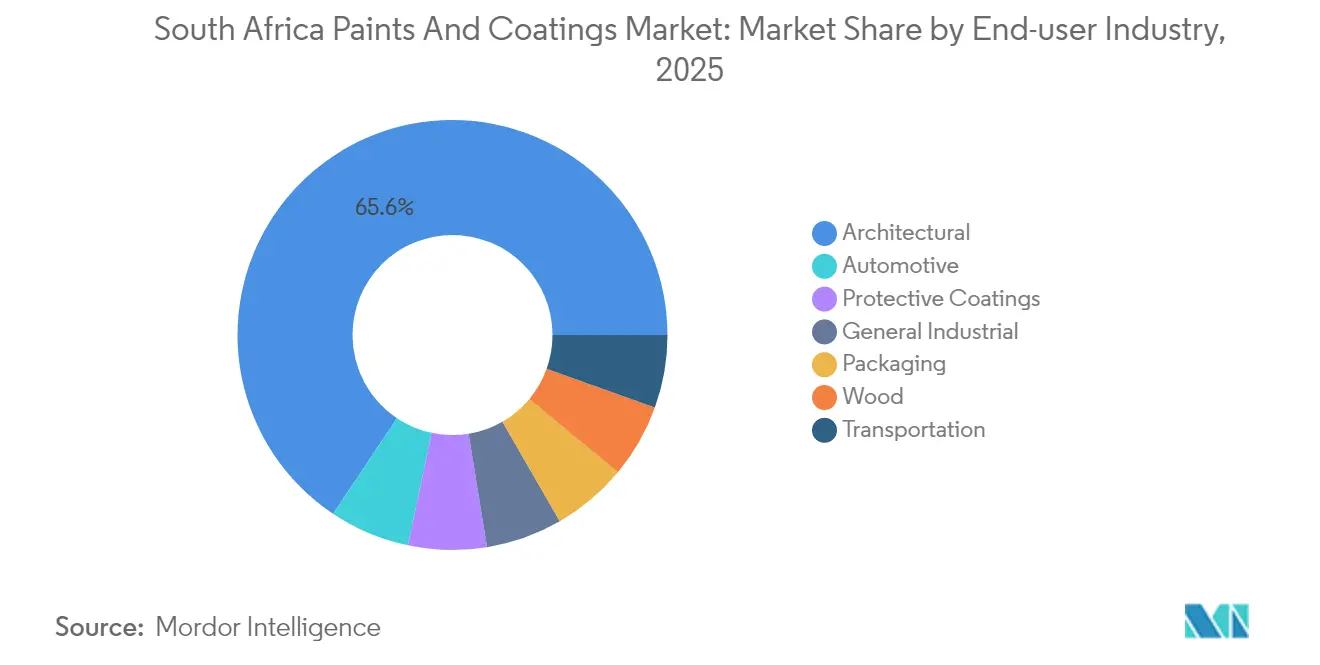
Architectural applications accounted for 65.62% of 2025 revenue thanks to recurring repaint cycles, commercial property refurbishments, and public-sector housing programs. The automotive vertical is set to grow the quickest at a 3.39% CAGR as new OEM lines ramp up and a sizable vehicle parc demands refinishing. Protective-coating volumes rise alongside energy, water, and transport mega-projects, requiring epoxy-polyamide primers and polysiloxane topcoats to mitigate corrosion. Wood-coating demand benefits from a resilient furniture export segment and timber-frame housing trials, while general industrial coatings mirror trends in machinery production and packaging. Transportation coatings for railcars and buses register stable demand, although electrification creates new material compatibility requirements.
Vehicle-parc aging in lower-income segments spurs more frequent refinishing, encouraging distributors to stock faster-curing, weather-resistant polyurethane lines. Meanwhile, indoor-air-quality standards in public buildings are driving low-VOC architectural solutions, nudging brands to expand odor-free emulsion ranges.
Geography Analysis
Gauteng remains the single largest demand node, combining Johannesburg’s financial district, Pretoria’s administrative hub, and Rosslyn’s automotive cluster into a dense consumption ecosystem spanning OEM coatings, industrial maintenance, and architectural refurbishments. Water-borne demand here is particularly robust because metropolitan air-quality officers enforce VOC caps stringently.
KwaZulu-Natal’s coastal humidity and petrochemical plants create niche corrosion-protection opportunities, while its proximity to the Port of Durban simplifies feedstock imports for nearby manufacturers. Northern Cape’s renewable-energy corridor is an emerging but strategic outlet for polysiloxane, epoxy, and thermally conductive coatings applied to solar trackers, wind towers, and planned green-hydrogen electrolysis units. Eastern Cape’s automotive factories generate predictable OEM volumes, and Limpopo’s mining complexes use heavy-duty protective systems to mitigate acid-mine drainage effects on steel. Although rural districts exhibit lower per-capita consumption, government-backed housing grants and road resurfacing projects keep baseline architectural and traffic-marking demand intact. Coastal regions, exposed to salt-laden winds, lean toward higher-grade solvent-borne or hybrid polysiloxane topcoats to extend service life.
Regulatory Landscape
South Africa regulates paints and coatings through product safety controls and emissions compliance. Under the Hazardous Substances Act, a 90 ppm lead limit for paint became mandatory in May 2025, requiring batch-level compliance declarations and testing. This framework accelerates substitution away from legacy lead-containing pigments and additives. On product compliance and market access, the National Regulator for Compulsory Specifications (NRCS), mandated under the NRCS Act 5 of 2008, enforces Compulsory Specifications and can require a Letter of Authority (LoA) for regulated product categories before legal sale.
Environmental and waste obligations also influence formulation and plant operations. VOC emission requirements under the National Environmental Management: Air Quality Act increase monitoring and reporting expectations, especially in major metros where enforcement is more visible. This supports continued water-borne and low-VOC transitions already underway in architectural and maintenance segments. The Department of Forestry, Fisheries and the Environment (DFFE) oversees chemicals and waste management policy implementation, while the South African Bureau of Standards (SABS) supports voluntary standards and certification that many suppliers use to demonstrate quality and fitness-for-purpose to public and industrial buyers.
Value Chain Analysis
The South African paints and coatings value chain starts with imported and locally sourced inputs, including titanium dioxide, resins (acrylic, epoxy, polyurethane), solvents, additives, and packaging, before moving into local blending and manufacturing, tinting and color-matching, and distribution. Supply exposure is meaningful because key raw materials are globally priced and frequently imported through major ports, notably Durban and Cape Town. Recent logistics friction has translated into higher delivered costs and longer lead times for manufacturers and distributors.
Downstream, products move through multi-channel routes to market that include large retail and hardware chains, independent paint stores, automotive refinish distributors, and direct-to-site supply for industrial and infrastructure users. Application is carried out by professional contractors and in-house maintenance teams. The South African Paint Manufacturing Association (SAPMA) represents about 90% of domestically manufactured paint, providing an industry coordination layer for standards awareness and technical engagement. Manufacturer-led training and digital tools, including tinting systems and color matching, increasingly influence contractor productivity and brand loyalty at the point of application.
Competitive Landscape
South Africa's paints and coatings market is moderately fragmented. Multinationals such as AkzoNobel (Dulux), PPG, Sherwin-Williams, BASF, and Axalta vie against entrenched local producers, including Kansai Plascon, Atlas Paints, and Dekro Paints, for contracts across retail, industrial, and OEM channels. Acquisition attempts, illustrated by AkzoNobel’s aborted bid for Kansai Paint Africa, signal global players’ appetite for market scale but also reveal antitrust sensitivities. Operational efficiency gains feature prominently; AkzoNobel announced 2,000 global job cuts to streamline supply chains, while BASF equipped its Boksburg plant with onsite solar generation and battery storage to hedge against residual load-shedding.
South Africa Paints And Coatings Industry Leaders
-
Akzo Nobel N.V.
-
PPG Industries, Inc.
-
The Sherwin-Williams Company
-
Atlas Paints
-
Kansai Plascon
- *Disclaimer: Major Players sorted in no particular order
Market Opportunities and Future Outlook
Regulatory and compliance pull is creating room for low-lead, low-VOC, and water-borne systems across architectural repaint, public buildings, and light industrial maintenance. The May 2025 90 ppm lead limit under the Hazardous Substances Act raises the cost of non-compliance and increases demand for suppliers with documented batch conformity. That, in turn, favors players with stronger quality systems and lab capacity. VOC compliance under the National Environmental Management: Air Quality Act supports continued substitution away from high-VOC alkyd and solvent-heavy systems, creating room for water-borne acrylics, higher-solids polyurethane clears, and compliant primers backed by documented performance.
Project-led demand pockets also support specialized protective coatings where technical qualification narrows the supplier pool. In this report context, South Africa’s public-sector infrastructure pipeline totals USD 54.5 billion through 2027, and the energy transition agenda includes renewable corridors that require corrosion protection, chemical-resistant linings, and UV-stable topcoats for assets in coastal and arid conditions. For automotive refinish, suppliers that combine premium polyurethane systems with digital mixing and color-matching workflows continue to differentiate through shop productivity and repeatable color accuracy, with evidence tied to PPG ecosystem deployments and training activity around automated mixing and color tools in South Africa during 2026.
Recent Industry Developments
- June 2026: Sherwin-Williams terminated pursuit with Nippon Paint Group of AkzoNobel joint acquisition. The action signals a regulatory and competitive landscape shift in South Africa's coatings market. This reduces consolidation risk and maintains competitive balance among global players operating in SA.
- June 2026: Sherwin-Williams entered long-term strategic partnership with Do it Best Group; manufacturing for EasyCare and Best Look; Majic and Shur-Line brands acquired. The partnership expands channel and brand consolidation in SA retail and DIY coatings. It strengthens distribution and private-label reach and broadens the manufacturing footprint and brand portfolio in decentralized channels.
- May 2026: PPG Industries celebrated 15 years of direct business operations in South Africa; network of 14 branches highlighted. The milestone underscores company level footprint expansion and local market commitment. It reinforces PPGs local penetration and service capability and may support increased local reformulation and color matching service adoption.
Research Methodology Framework and Report Scope
Market Definition and Coverage
For this study, the market is defined as the value of paints and coatings sold for use within South Africa across major end-use demand, counted at the point where the coating product is purchased for application and expressed in USD.
Scope exclusions: We exclude raw materials used to make coatings (such as resins, pigments, and solvents) and we also exclude application service revenue.
Segmentation Overview
- By Resin Type
- Acrylic
- Alkyd
- Epoxy
- Polyurethane
- Polyester
- Other Resin Types
- By Technology
- Water-borne
- Solvent-borne
- Powder Coatings
- UV Cured Coating
- By End-User Industry
- Architectural
- Automotive
- Wood
- Protective Coatings
- General Industrial
- Transportation
- Packaging
Data Sources, Market Sizing, and Validation
Desk Research
Desk research was used to build the basic demand and supply picture before any assumptions were finalized. We relied on public sources such as Statistics South Africa releases, South African Revenue Service trade statistics, the South African Bureau of Standards (SABS) publications, and Department of Trade, Industry and Competition updates to understand construction activity, manufacturing output, and regulation signals that influence coatings consumption.
We also reviewed annual reports and investor presentations of relevant producers and distributors, plus association websites and industry news, to contextualize pricing and identify capacity or distribution changes. Where needed, we used paid subscriptions for company financials and intelligence, shipment-level import and export records, and patent databases to cross-check technology shifts. The desk research sources listed here are illustrative only, and additional public and paid references were used for data collection, validation, and clarification.
Primary Interviews and Surveys
Primary work was completed through expert interviews and structured surveys with manufacturers, distributors, contractors, and large end users in building, industrial maintenance, and automotive refinishing. These discussions helped address items that desk research cannot resolve cleanly, including channel splits, typical repaint cycles, pack-size mix, and how price changes are passed through at the wholesale and retail levels.
Distribution of primary research fieldwork respondents
| Company type | Respondent position |
|---|---|
| Top tier: 38% | CXOs: 14% |
| Mid tier: 47% | Functional/Unit leaders: 40% |
| Smaller Players: 15% | Managers: 46% |
Market-Sizing & Forecasting
Market sizing started with a top-down build where national construction activity, manufacturing output signals, and trade flows were used to reconstruct the likely coatings demand pool in South Africa, and then the value was derived using observed pricing and mix. To keep this grounded, our model uses a limited set of inputs that can be explained and rechecked, and then it is adjusted when the numbers do not align with what market participants report.
On the validation side, selective bottom-up approximations were used to corroborate totals, such as sampled price per liter or kilogram multiplied by estimated volumes from channel checks, plus supplier and distributor revenue references where they were publicly visible. Key inputs used as market fingerprints include building completions and renovation activity, industrial maintenance intensity in metals and mining corridors, automotive production and refinish demand signals, import dependence for certain product types, and technology shift indicators such as water-borne adoption, where tightening health and environmental requirements are cited.
Forecasting was done using scenario analysis supported by trend smoothing on the main drivers, so the outlook reflects both the historical pattern and how experts expect end markets to move over the next few years. When a direct data series was missing, the gap was handled using proxy variables (for example, mapping coating demand to construction and industrial output indices) and then checked again during primary follow-ups before the final totals were locked.
Data Validation & Update Cycle
Outputs were tested using several checks, including variance reviews across end-use demand indicators, price consistency checks against observed retail and distributor moves, and year-over-year change sanity tests so unusual jumps are explained before sign-off. A second analyst review was used to challenge the assumptions, and call-backs were triggered when inputs conflicted, such as when trade data trends did not match distributor feedback.
Reports are refreshed annually, and interim updates are made when material events occur, such as major regulation changes, sharp raw material cost shifts, or meaningful capacity and route-to-market moves. Before delivery, a final pass is completed so clients receive the latest updated view that aligns with the stated scope and conversion approach.
Mordor Intelligence's South Africa Paints and Coatings Market Size Measured Against Other Published Estimates
Published market values for South Africa paints and coatings can differ because researchers do not always count the same product boundaries, time their currency conversions the same way, or use the same set of demand signals to anchor volumes and prices. We present the estimate as a single, repeatable value model that can be traced back to a defined demand pool and checked with real-world buying and selling behavior.
The main gap comes from whether coating-application services and adjacent chemical products are bundled into the number, where Mordor Intelligence counts only the paint and coating product value sold into South Africa and leaves out contractor labor revenue and raw material spend.
Benchmark comparison
| Source | Market Size | Gaps in Research Methodology |
|---|---|---|
| Mordor Intelligence | USD 747.41 M (2025) | |
| Trade Journal A | USD 763.00 M (2024) | Uses a media-reported snapshot that appears closer to current market value but does not clearly state whether it is factory-gate, retail, or includes installation related revenue, so the scope and pricing basis can drift. |
| Regional Consultancy B | USD 1.80 B (2026) | Looks materially higher and likely broadens scope beyond coatings sold as products, and it may also apply aggressive price and volume growth assumptions without clear linkage to South Africa construction and industrial activity signals. |
The comparison shows that the spread is mainly driven by scope and pricing basis, rather than a simple difference in arithmetic. By keeping inclusions tight, tying value to observable demand drivers, and rechecking price and mix with market participants, the result stays balanced and easier to replicate for decision-making.
Key Questions Answered in the Report
What is the current value of the South Africa paints and coatings market?
The South Africa paints and coatings market size stands at USD 769.91 million in 2026.
How fast is the market expected to grow through 2031?
The market is projected to record a 3.01% CAGR, reaching USD 892.68 million by 2031.
Which technology segment is expanding the quickest?
Water-borne formulations hold both the largest share and the fastest growth, advancing at a 4.19% CAGR.
Why are polyurethane resins gaining traction?
Polyurethane resins combine superior durability and chemical resistance, making them ideal for automotive clearcoats and industrial maintenance.
What drives demand in the automotive coatings segment?
Rising local vehicle production, extended ownership cycles, and longer OEM warranties are boosting both OEM and refinish coating consumption.
How does environmental regulation affect manufacturers?
Carbon-tax escalation and tighter VOC limits are steering producers toward low-emission, water-borne coatings and raising compliance costs for solvent-based lines.