
South Africa MVNO Market Size and Share
Market Overview
| Study Period | 2020 - 2031 |
|---|---|
| Forecast Data Period | 2026 - 2031 |
| Base Year Market Size (2025) | USD 505 Million |
| Market Size (2026) | USD 543.48 Million |
| Market Size (2031) | USD 784.56 Million |
| Growth Rate (2026 - 2031) | 7.62 % |
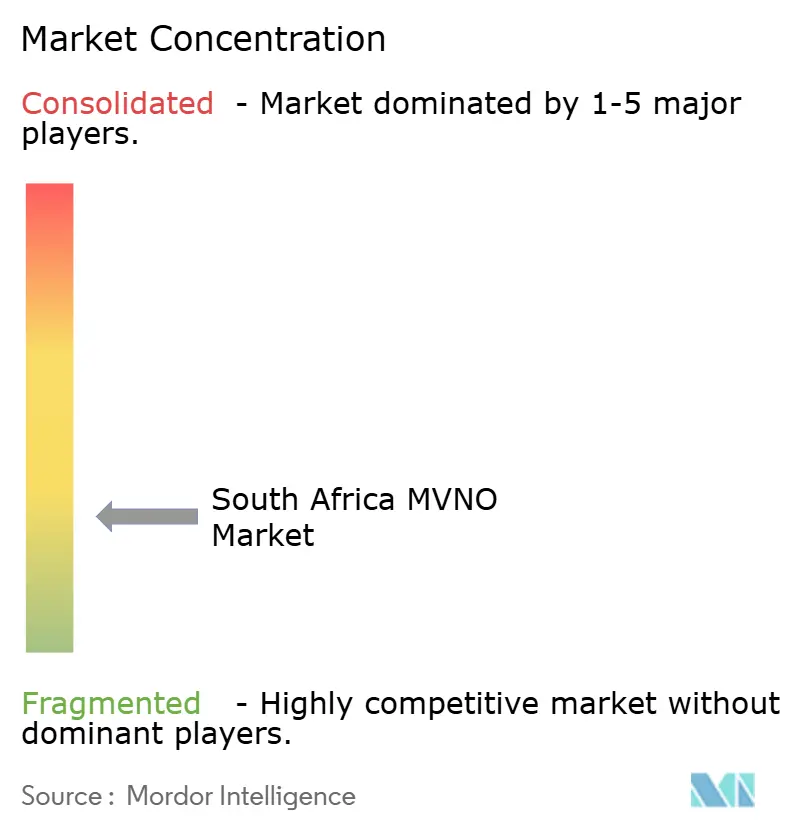
| Market Concentration | Low |
Major Players *Disclaimer: Major Players sorted in no particular order Image © Mordor Intelligence. Reuse requires attribution under CC BY 4.0. | |
South Africa MVNO Market Analysis by Mordor Intelligence
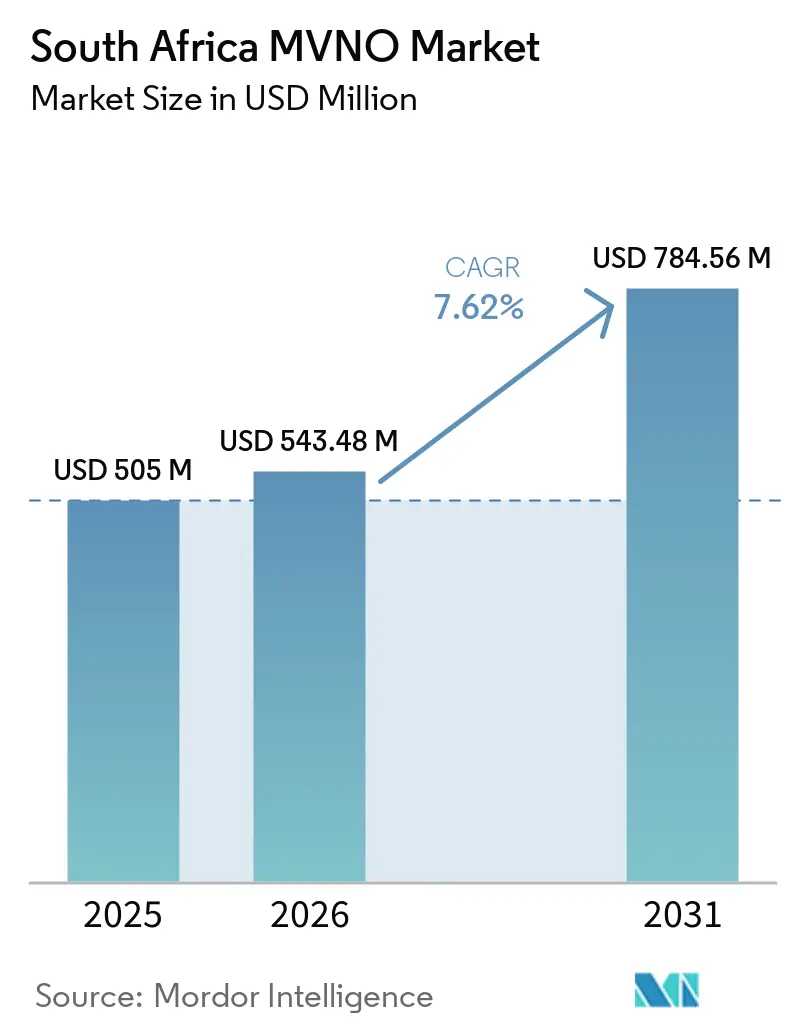
The South Africa MVNO Market size is projected to be USD 505 million in 2025, USD 543.48 million in 2026, and reach USD 784.56 million by 2031, growing at a CAGR of 7.62% from 2026 to 2031. In terms of subscriber volume, the market was valued at 5.91 million subscribers in 2025 and is expected to grow from 6.35 million subscribers in 2026 to 9.07 million subscribers by 2031, at a CAGR of 7.40% during the forecast period (2026-2031).
The trajectory reflects steady migration from generic voice-and-text propositions toward highly segmented offerings that emphasize banking integration, cloud-native operating stacks, and digital-first distribution. Ongoing spectrum liberalization by the Independent Communications Authority of South Africa (ICASA), together with Cell C’s wholesale-focused Virtual RAN arrangement, has lowered entry barriers and intensified competition. Banking-led brands are exploiting deep customer pools and loyalty programs to cross-sell mobile connectivity, while eSIM uptake is accelerating remote onboarding and cutting subscriber acquisition costs. Load-shedding headwinds and persistent data-to-income misalignment remain structural hurdles, yet operators are offsetting these pressures through diversified revenue models, differentiated value-added services, and expanded 4G/5G coverage footprints.
Key Report Takeaways
- By deployment model, cloud infrastructure led with 67.20% revenue share in 2025, while cloud-based services are growing at an 11.10% CAGR through 2031.
- By operational mode, Service Operator configurations accounted for 44.60% of the South Africa MVNO market share in 2025, while Full MVNO models are projected to grow fastest at 15.80% CAGR to 2031.
- By subscriber type, consumer plans captured 77.10% of the South Africa MVNO market size in 2025; IoT-specific connections are expanding at a 33.60% CAGR through 2031.
- By application, discount bundles held 47.30% of the South Africa MVNO market size in 2025, whereas cellular M2M links are forecast to accelerate at 23.40% CAGR.
- By network technology, 4G/LTE still dominated with 73.10% share in 2025; 5G services are advancing at 36.10% CAGR toward 2031.
- By distribution channel, traditional retail outlets retained 41.70% share in 2025, but online-only channels are scaling fastest at a 17.20% CAGR.
Note: Market size and forecast figures in this report are generated using Mordor Intelligence’s proprietary estimation framework, updated with the latest available data and insights as of 2026.
South Africa MVNO Market Trends and Insights
Drivers Impact Analysis*
| Driver | (~) % Impact on CAGR Forecast | Geographic Relevance | Impact Timeline |
|---|---|---|---|
| Banking-led MVNO bundling | +2.1% | Gauteng, Western Cape | Medium term (2–4 years) |
| ICASA licensing reforms and spectrum auctions | +1.8% | National | Long term (≥ 4 years) |
| Low-cost data demand | +1.5% | Rural provinces | Short term (≤ 2 years) |
| Cell C Virtual RAN wholesale access | +1.3% | National | Medium term (2–4 years) |
| 2G/3G switch-off drives IoT launches | +0.9% | Urban centers | Long term (≥ 4 years) |
| eSIM-enabled digital onboarding | +0.7% | Metro areas | Short term (≤ 2 years) |
| Source: Mordor Intelligence | |||
Banking-led MVNO Bundling Drives Subscriber Uptake
Financial institutions use established customer bases and rewards ecosystems to push mobile services, creating compelling cross-sell economics. Capitec Connect booked 1.3 million lines within two years, moving airtime worth ZAR 2 billion (USD 118 million) monthly through bank channels. FNB Connect broadened coverage by onboarding MTN alongside Cell C, boosting reliability and network reach. Generous cashback programs such as eBucks, offering up to 40% on mobile spend, deepen retention and encourage bundle uptake. Successes are prompting new entrants, with Old Mutual unveiling an MVNO ahead of its 2025 full-service bank launch. These moves validate the banking playbook as a dominant growth engine for the South Africa MVNO market.
ICASA Licensing Reforms and Spectrum Auction
ICASA’s March 2022 auction distributed prime 700 MHz and 3.5 GHz bands to six bidders, embedding mandated wholesale-access clauses that compel host MNOs to open networks to virtual operators. [1]Data-expiry rule amendments let MVNOs craft non-expiring and app-specific bundles, directly challenging incumbent value constructs. A parallel consultation on satellite and non-terrestrial networks signals regulatory foresight, ensuring future resilience. Open-access principles combined with infrastructure-sharing directives have shifted operator strategies toward wholesale monetization, underpinning the broader South Africa MVNO market expansion.
Low-Cost Data Demand Among Price-Sensitive Consumers
Mobile data prices fell 88% from 2005 to 2023, yet affordability gaps persist, especially in rural provinces where household income lags. [2] MVNOs exploit this gap with targeted discount bundles; Spot Mobile’s launch offered free ZAR 50 airtime for three months to hook Gen Z users. Prepaid orientation aligns with consumer cash-flow realities, while flexible micro-bundles address sporadic income patterns. Competitive pricing dynamics broaden addressable bases and buttress the South Africa MVNO market’s growth outlook.
Cell C Virtual RAN Wholesale Model Slashes CAPEX for Entrants
Cell C migrated to a Virtual RAN construct that taps MTN and Vodacom towers, giving MVNO partners access to roughly 28,000 sites without capital outlay. FNB Connect, Capitec Connect, Shoprite K’nect, and Mr Price Mobile all benefit from nationwide coverage and 5G readiness. The cost-light entry route accelerates time-to-market and underpins sustained growth momentum for the South Africa MVNO market.
Restraints Impact Analysis*
| Restraint | (~) % Impact on CAGR Forecast | Geographic Relevance | Impact Timeline |
|---|---|---|---|
| QoS and pricing dependence on host MNOs | -1.4% | National | Medium term (2–4 years) |
| Persistently high data-to-income ratio | -1.1% | Rural provinces | Short term (≤ 2 years) |
| Load-shedding network disruptions | -0.9% | Industrial provinces | Short term (≤ 2 years) |
| Banking and POPIA compliance costs | -0.6% | National | Long term (≥ 4 years) |
| Source: Mordor Intelligence | |||
Load-Shedding Disruptions to Network Uptime
Rotational outages degrade tower uptime as batteries require 12–18 hours to recharge, yet blackouts often recur sooner. [3]Vodacom and Cell C have diverted billions toward diesel generators and lithium-ion battery replacements, constraining innovation spend. MVNOs inherit these vulnerabilities but lack direct control over resilience capex, adding churn risk and tempering expansion velocity in the South Africa MVNO market.
Persistently High Data Pricing Versus Household Income
Fixed broadband averages ZAR 899 (USD 48) monthly, ranking 127th worldwide, while mobile tariffs threaten to climb on energy and inflation pressures. Wholesale rates do not always fall in tandem, squeezing MVNO margins. Operators increasingly rely on loyalty perks and bundled digital services rather than price cuts alone, yet affordability ceilings limit addressable segments outside high-income metros.
*Our forecasts treat driver/restraint impacts as directional, not additive. The impact forecasts reflect baseline growth, mix effects, and variable interactions.
Segment Analysis
By Deployment Model: Cloud Dominance Accelerates Digital Transformation
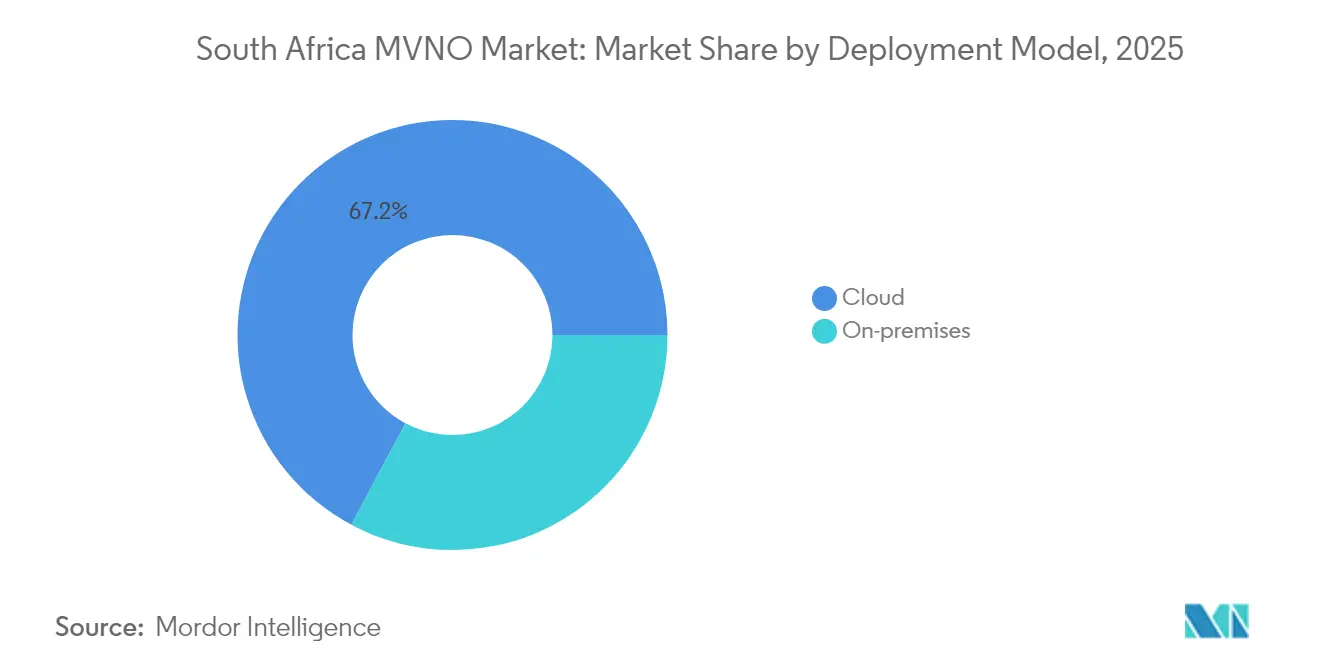
Cloud-based configurations generated 67.20% of 2025 revenue and are compounding at 11.10% through 2031, underscoring the primacy of flexible, scalable architectures in the South Africa MVNO market size. Banking MVNOs derive particular advantage from seamless integration between mobile cores and fintech back-ends, expediting account-linked SIM activation. FNB Connect recorded a 169% rise in eSIM-enabled devices over three years, a milestone enabled by its cloud control plane.
Low infrastructure overhead improves margins, enabling sharper pricing and faster regional rollouts. Cloud schemes also ease regulatory compliance because data-sovereignty policies can be addressed through virtual geographic partitioning. Meanwhile, on-premise deployments persist in enterprise-grade use cases where sensory data residency drives procurement. Nevertheless, long-run consensus positions cloud as the default foundation for most new MVNO launches within the South Africa MVNO market.

By Operational Mode: Service Operator Leads, Full MVNO Picks Up Speed
Service Operator models retained 44.60% share in 2025, balancing control of numbering resources with lean infrastructure dependence. However, Full MVNO status—growing 15.80% CAGR—offers command over BSS/OSS stacks and pricing, a strategic imperative for brands seeking stronger differentiation. Melon Mobile’s shift toward MVNE capability via Amdocs illustrates maturation trends.
The South Africa MVNO market is thus bifurcating: established retail and bank entrants gravitate toward Full status to refine customer experience, while niche discounters stick with Service Operator arrangements for cost containment. ICASA preserves model plurality, sustaining vibrant competition across capital-risk appetites.
By Subscriber Type: Consumer Base Still Dominant but IoT Surges
Consumer lines represented 77.10% of active SIMs in 2025, powered by banking incentives and expansive retail footprints. Yet IoT endpoints are multiplying at a 33.60% CAGR, making them the fastest-expanding slice of the South Africa MVNO market. Vodacom’s NB-IoT overlay now spans 8,000 sites and 80% population coverage, creating fertile ground for meter-reading, asset-tracking, and agriculture sensors.
Consumer segment growth continues albeit hinging on richer digital bundles—streaming, micro-insurance, and instant credit—beyond base connectivity. Enterprise applications benefit from on-premise security guarantees, but IoT is poised to disrupt revenue mix as 2G/3G turndown compels device migration toward 4G and 5G modules, an inflection that elevates specialized IoT-centric MVNO propositions.
By Application: Discount Models Scale, M2M Unlocks Innovation
Price-led propositions commanded 47.30% revenue in 2025. Brands such as Spot Mobile captured urban youth with zero-expiry data top-ups, while Capitec Connect drew mainstream subscribers through competitive prepaid rates. Large customer volumes produce economies of scale, reinforcing discount model relevance in the South Africa MVNO market.
Cellular M2M, advancing 23.40% CAGR, fuels industrial digitization. Smart-grid rollouts, fleet telematics, and cold-chain monitoring require low-power, wide-area coverage, conditions met by NB-IoT and future RedCap standards. MVNOs that bundle connectivity with device management platforms and analytics dashboards are well positioned to monetize this uptick.
By Network Technology: 4G Present, 5G Future
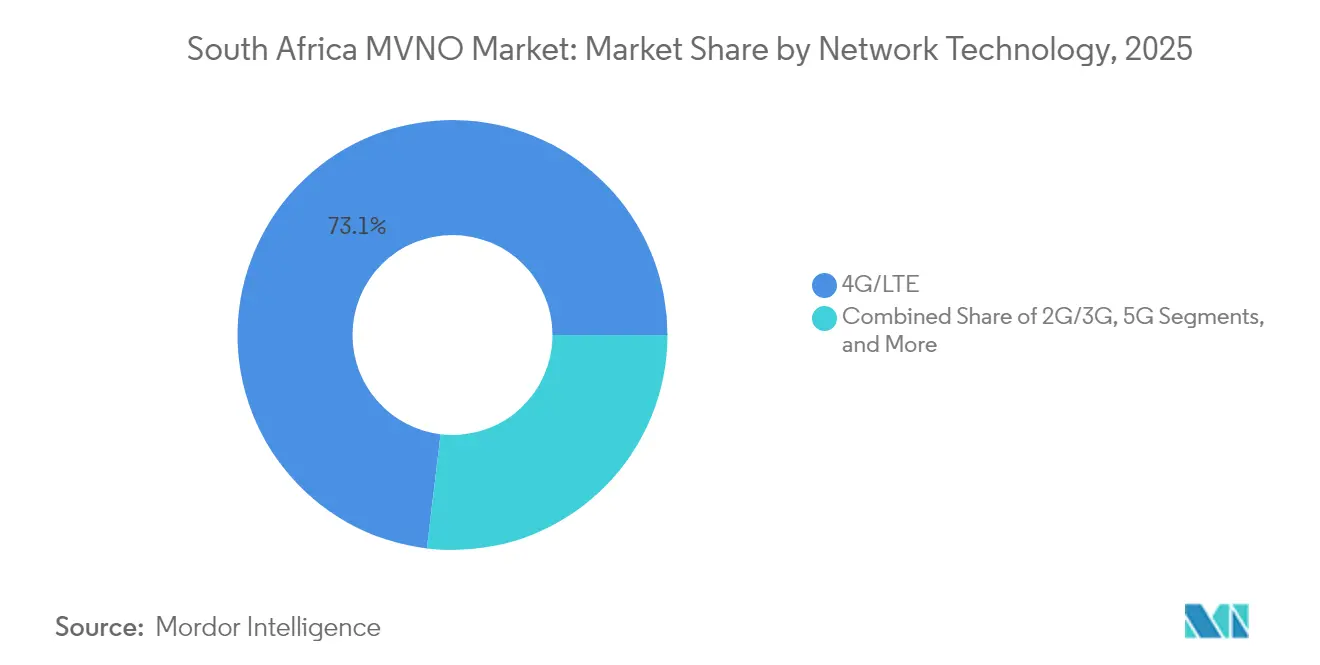
4G/LTE accounted for 73.10% of 2025 SIMs, offering ample capacity for mainstream video and fintech applications. Yet 5G posts the steepest climb at 36.10% CAGR, spurred by mid-band spectrum allocations and aggressive rollouts that reached 50% population coverage by late 2024. Rain’s 5.5G testing signals a roadmap toward higher throughput and reduced latency that will benefit immersive services and enterprise private networks.
Legacy 2G/3G networks face a hard sunset by December 2027, prompting mass device replacements—an upside for IoT MVNOs that can orchestrate smooth migrations. Satellite and non-terrestrial networks remain niche but critical for deep-rural and maritime segments, expanding the diversity of the South Africa MVNO market.
By Distribution Channel: Brick-and-Mortar Persists, Digital Soars
Traditional retail maintained 41.70% share in 2025, reflecting consumer desire for physical assistance with SIM swaps and handset selection. Shoprite’s K’nect kiosks epitomize this reach, leveraging foot traffic to drive activations. Nonetheless, online-only sales logged a 17.20% CAGR, harnessing eSIM instant provisioning and app-based KYC to streamline onboarding in the South Africa MVNO market.
Hybrid strategies dominate: banks embed SIM sales in digital banking apps while offering branch support; fashion chains such as Mr Price rely on in-store displays augmented by QR-code activations. Third-party wholesalers complement coverage in peri-urban locales, ensuring nationwide availability across socio-economic cohorts.
Geography Analysis
Gauteng anchors the South Africa MVNO market, supported by the province’s concentration of corporate headquarters, financial institutions, and an 80% smartphone penetration rate. Bank-run brands use integrated app ecosystems to capture salaried urbanites, yielding superior average revenue per user. Western Cape ranks second, buoyed by tourism-driven demand and strong fiber backhaul that underpins high-capacity 4G/5G traffic. KwaZulu-Natal follows, where retail MVNOs like Mr Price and Shoprite leverage dense store networks to convert footfall into SIM activations.
Rural provinces such as Limpopo and Eastern Cape present untapped potential but are hampered by lower disposable incomes and sporadic network reliability. The 2G/3G shutdown slated for 2027 may initially disadvantage these areas; however, spectrum re-farm will ultimately enhance 4G coverage, improving service quality and paving the way for IoT deployments in agriculture and mining. Cell C’s Virtual RAN footprint, piggy-backing on MTN and Vodacom towers, now spans every district, mitigating historical geographic disparity and granting near-uniform network access to MVNO partners.
Provincial governments are incorporating mobile broadband into economic-development blueprints, especially in Free State and Northern Cape, where digital agriculture pilots rely on low-power IoT SIMs. ICASA enforces spectrum-sharing obligations consistently across provinces, though municipal approval times for tower upgrades differ, causing rollout timelines to vary. Overall, geography-based gaps are narrowing, but affordability divides persist, influencing segmentation strategies within the South Africa MVNO market.
Regulatory Landscape
South Africa’s MVNO framework is shaped by ICASA’s competition and consumer-protection interventions, notably the Mobile Broadband Services Regulations (2021), which set access-focused market definitions and requirements aimed at enabling service-based competition in mobile broadband. In 2024, amendments to these regulations shifted oversight toward a more confidential regime by removing public disclosure requirements around wholesale MVNO pricing and relaxing certain margin-squeeze monitoring obligations, changing how MVNO economics are supervised compared with earlier transparency-driven approaches.
In April 2026, the Electronic Communications Amendment Bill (B12-2026) was introduced. It proposes a more prescriptive regime for MVNO and national roaming access on request, including time-bound negotiation and conclusion requirements (60 days, with a possible 60-day extension), and positions ICASA to prescribe wholesale pricing rules and standards for MVNO services within 18 months of the Act’s commencement, with dispute-resolution powers if parties fail to agree.
Value Chain Analysis
The South Africa MVNO value chain begins with host MNO radio and transport capacity, then moves through wholesale access and enablement layers before reaching consumer and enterprise distribution. Hosting remains concentrated among Cell C, MTN, and Vodacom, while MVNOs commonly rely on MVNE/MVNA capabilities for SIM lifecycle, BSS/OSS, provisioning, charging, and digital onboarding. A platform shift occurred in September 2024, when Vodacom launched its own MVNE platform and signed its first MVNO customer (Mr Price Mobile), adding in-house enablement capability alongside established wholesale arrangements.
Downstream, banks and retailers drive customer acquisition and servicing via branches, apps, and store networks, while eSIM-supported digital KYC reduces reliance on physical SIM logistics and third-party retail. Regulation also shapes upstream terms: spectrum auction hosting conditions require operators that acquired spectrum in the 2022 assignment to host a minimum of three MVNOs, increasing the availability of wholesale access. At the same time, January 2026 data rollover rules add operational and margin pressure that feeds through host MNO wholesale terms into MVNO pricing and bundle design.
Competitive Landscape
The South Africa MVNO market shows moderate concentration, anchored by Cell C’s wholesale dominance that hosts most high-profile brands. FNB Connect, Capitec Connect, and Standard Bank Mobile exemplify banking synergies, combining loyalty currencies and granular credit scoring to retain users. Retail giants Shoprite and Mr Price bring mass-market reach, pairing airtime sales with consumer-goods promotions.
Competitive levers emphasize customer experience over raw price: Capitec’s non-expiry data bundles tackle bill-shock; FNB exploits multi-network roaming for resilience; Shoprite ties SIM usage to grocery coupons. Technology partnerships are pivotal: Melon Mobile’s alignment with Amdocs delivers MVNE services to smaller entrants, while eSIM orchestration platforms shorten go-to-market cycles for new virtual brands.
The pending 5G investment cycle is shaping strategic alliances. Banks negotiate wholesale 5G rates with host MNOs to safeguard margins, whereas emerging IoT specialists seek sub-gigahertz spectrum slices to guarantee deep-indoor coverage. White-space opportunity remains in agriculture telemetry and low-tier urban youth segments, yet profitability demands lean cost structures and advanced customer analytics.
South Africa MVNO Industry Leaders
-
FNB Connect
-
Standard Bank Mobile
-
Capitec Connect
-
meandyou Mobile
-
Afrihost AirMobile
- *Disclaimer: Major Players sorted in no particular order
Market Opportunities and Future Outlook
Regulated wholesale access and standardized MVNO service obligations create a clear whitespace for new launches and for existing brands to renegotiate wholesale constructs. The Electronic Communications Amendment Bill (B12-2026) explicitly targets MVNO and roaming services, including time-bound agreement conclusion and ICASA-led dispute resolution, which improves the feasibility of entering with differentiated propositions instead of relying on prolonged bilateral negotiations.
Banking-led MVNOs and digital onboarding offer near-term routes to scale without dense retail distribution. Capitec Connect’s disclosed traction (1.5 million 90-day active users by 28 February 2026) shows how banks convert existing customer relationships and app journeys into SIM activations and usage. A parallel opportunity exists in eSIM-led acquisition and servicing, which reduces physical fulfillment dependency and supports affinity and niche brands, as well as in IoT-focused propositions aligned with the December 2027 2G/3G sunset that drives device migrations to 4G/5G modules. These openings favor MVNOs that combine wholesale connectivity with device management, security, and vertical-specific bundles, rather than competing only on prepaid discounting.
Recent Industry Developments
- June 2026: Capitec Connect reported 1.5 million 90-day active users as of 28 February 2026, reinforcing banking-led MVNOs as a scale play in South Africa. The milestone signals stronger negotiating leverage with host networks and suppliers as volumes rise, while also pushing rivals to match app-led onboarding and value-based bundles.
- April 2026: Electronic Communications Amendment Bill B12-2026 was introduced, proposing time-bound agreement completion and ICASA-led dispute resolution for MVNO and roaming services. The Bill also outlines wholesale pricing rules to be prescribed within 18 months of the Act's commencement.
- December 2024: eGroupX launched a fintech-integrated MVNO focused on underserved consumers. The move broadened the set of non-traditional entrants using embedded financial services and alternative distribution to compete beyond standard prepaid airtime-led propositions.
Research Methodology Framework and Report Scope
Market Definition and Coverage
This market covers the value generated from MVNO services in South Africa, where a branded provider sells mobile connectivity to end users using wholesale network access from local mobile network operators.
Scope exclusions: We exclude device sales, tower build revenue, and fixed broadband services, and we also do not count OTT apps that do not bundle mobile connectivity.
Segmentation Overview
- By Deployment Model
- Cloud
- On-premise
- By Operational Mode
- Reseller
- Service Operator
- Full MVNO
- Light / Brand MVNO
- By Subscriber Type
- Consumer
- Enterprise
- IoT-specific
- By Application
- Discount
- Business
- Cellular M2M
- Others
- By Network Technology
- 2G/3G
- 4G/LTE
- 5G
- Satellite/NTN
- By Distribution Channel
- Online / Digital-only
- Traditional Retail Stores
- Carrier Sub-brand Stores
- Third-Party / Wholesale
Data Sources, Market Sizing, and Validation
Desk Research
Desk research sets the boundaries and gives us the hard reference points that a pricing model needs. We mainly lean on public telecom and spectrum documents from sources such as ICASA, national statistics releases from Statistics South Africa, and sector reporting from the Department of Communications and Digital Technologies.
To keep market inputs grounded, we also review operator and brand disclosures through annual reports, investor decks, and press releases, which are then compared against sources such as GSMA publications, ITU indicators, and publicly accessible network coverage and performance reporting. When it helps with cross checks, we use a paid subscription for company financials and intelligence, along with a patent database for tracking enabling platform activity and partnerships. The sources listed here are illustrative, and many other public documents and updates were also used to collect data, validate assumptions, and clarify open questions.
Primary Interviews and Surveys
Primary work was used to confirm how MVNO wholesale pricing, typical customer mix, and product bundles (voice, data, and SIM only plans) translate into realizable revenue in South Africa. We speak with a mix of MVNO executives, channel partners, telecom consultants, enterprise mobility buyers, and operational leaders, so the model reflects how contracts are actually structured and renewed across the country.
Distribution of primary research fieldwork respondents
| Company type | Respondent position |
|---|---|
| Top tier: 31% | CXOs: 16% |
| Mid tier: 52% | Functional/Unit leaders: 39% |
| Smaller Players: 17% | Managers: 45% |
Market-Sizing & Forecasting
For sizing, we use a top-down approach where subscriber and usage indicators are translated into service revenue pools for South Africa, followed by splits that isolate MVNO value from the broader mobile service market. The output is then stress-tested with selective bottom-up approximations, such as sampled ARPU by brand type multiplied by estimated active subscriber bases, plus channel checks on prepaid versus contract share.
Key inputs that steer the model include MVNO subscriber additions, prepaid recharge behavior, effective ARPU after promotions, wholesale access charges, and data consumption trends that shift the revenue mix toward bundles. Where direct datapoints are missing, gaps are handled using conservative ranges that were validated in interviews, and the midpoint is used only when supporting signals (like reported customer growth or distribution expansion) point the same way.
For forecasting, we use scenario analysis tied to a small set of drivers that can be refreshed each year, including smartphone penetration, 4G and 5G coverage expansion, enterprise mobility adoption, and pricing pressure on entry plans. Assumptions are reviewed with respondents so the final outlook matches what buyers and sellers expect for churn, bundle pricing, and MVNO brand launches.
Data Validation & Update Cycle
Validation is done through triangulation across independent signals, so revenue outputs are checked against subscriber trends, ARPU direction, and observed pricing in the market. When a value looks out of line, the drivers are traced back, the assumptions are re-tested, and follow-up calls are triggered with relevant experts to explain the variance.
Before sign-off, the model goes through multi-step analyst reviews, including reasonability checks against adjacent telecom indicators and prior-year movements. Reports are refreshed annually, and interim updates are made when material events happen, such as major wholesale agreement changes or regulatory actions that affect MVNO operating terms. Right before delivery, we do a fresh pass so clients receive the most current view supported by the latest disclosures and interview feedback.
Mordor Intelligence's South Africa Mno Mvno Market Size Compared With Other Published Estimates
Published market values for South Africa MVNO services can differ even when the topic label looks the same, because the study boundary, the revenue line counted, and the timing of currency and pricing updates are not consistent across sources. Differences also show up when some figures are built from operator revenue totals, while others start from subscriber pools and then apply ARPU and wholesale assumptions.
Key gap drivers in this market usually come from whether estimates include only MVNO retail service revenue or also add MNO retail, handset revenue, or non-core telecom services. Another common spread driver is how ARPU is treated, where one model may hold pricing flat while another bakes in faster data bundle mix shifts, and then currency conversion timing can widen the gap when ZAR moves sharply during the year.
Benchmark comparison
| Source | Market Size | Gaps in Research Methodology |
|---|---|---|
| Mordor Intelligence | USD 543.48 M (2026) | |
| Industry Association A | USD 610.00 M (2026) | Often presented as a broader mobile service value proxy that can blend MVNO retail revenue with adjacent mobile service lines, and ARPU is sometimes taken from published averages without adjusting for promo-led discounting. |
| Trade Journal B | USD 470.00 M (2025) | Frequently anchored to earlier-year subscriber snapshots and simplified pricing, which can undercount newer MVNO launches and the uplift from higher data bundle usage, and it may not normalize for exchange-rate timing. |
The table shows a noticeable spread by year and by what is counted, and in Mordor Intelligence's model the value is limited to MVNO service revenue in South Africa and is reconciled to subscriber activity and realistic ARPU ranges before being projected forward. Once scope is aligned and ARPU and currency timing are treated consistently, the remaining differences become smaller and easier to explain with a repeatable set of inputs.
Key Questions Answered in the Report
How will the 2027 2G/3G shutdown impact virtual operators?
The sunset will push IoT device migrations to 4G/5G, creating new opportunities for IoT-centric MVNOs but requiring proactive customer transition plans.
Which province currently generates the highest MVNO subscriber volume?
Gauteng leads, benefiting from its economic status, high smartphone adoption, and multiple banking-led MVNOs.
What share of deployments rely on cloud infrastructure?
Cloud models account for 67.20% of deployments, favored for their scalability, cost efficiency, and rapid integration capabilities.
How are power outages influencing MVNO operating costs?
Load-shedding compels host networks to invest heavily in backup power, costs that filter down to MVNOs through wholesale rate structures and service-level variability.