
South Africa IoT Market Size and Share
Market Overview
| Study Period | 2020 - 2031 |
|---|---|
| Forecast Data Period | 2026 - 2031 |
| Base Year Market Size (2025) | USD 4.3 Billion |
| Market Size (2026) | USD 4.85 Billion |
| Market Size (2031) | USD 8.86 Billion |
| Growth Rate (2026 - 2031) | 12.80 % |
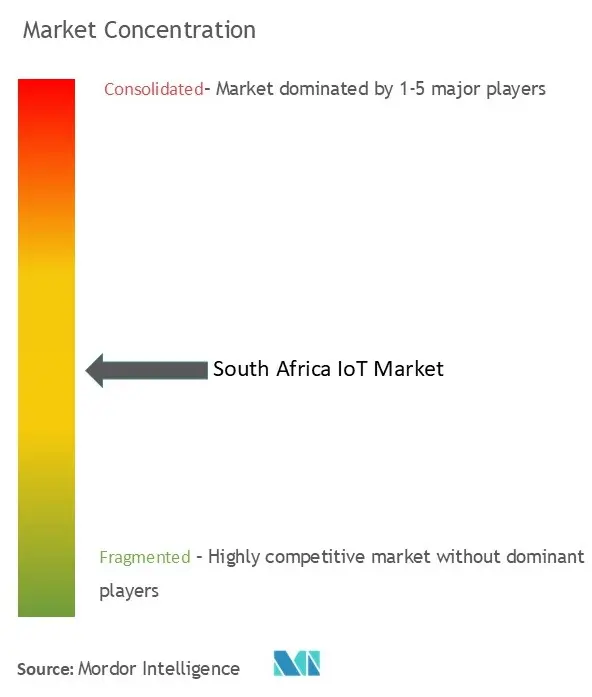
| Market Concentration | Medium |
Major Players *Disclaimer: Major Players sorted in no particular order Image © Mordor Intelligence. Reuse requires attribution under CC BY 4.0. | |
South Africa IoT Market Analysis by Mordor Intelligence
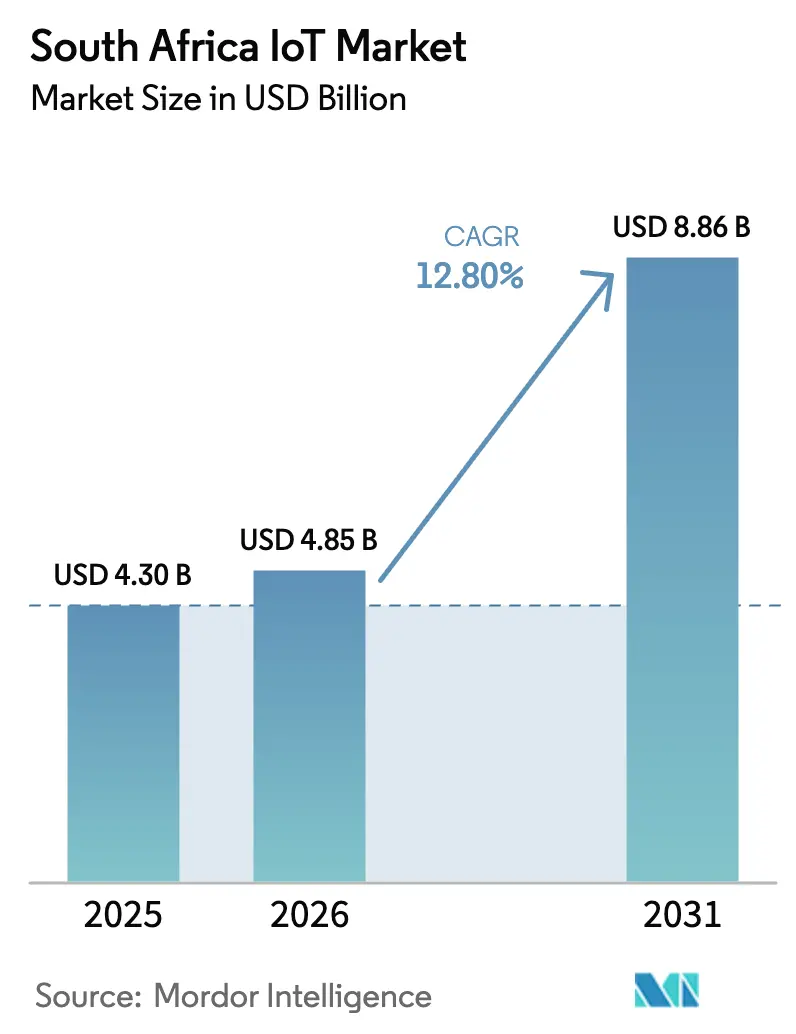
The South Africa IoT market size is expected to grow from USD 4.3 billion in 2025 to USD 4.85 billion in 2026 and is forecast to reach USD 8.86 billion by 2031 at 12.8% CAGR over 2026-2031. Intensifying cloud adoption, improving spectrum availability, and the commercial launch of nationwide 5G services give enterprises the bandwidth headroom and low-latency environment required for high-value industrial analytics and automation. Hardware demand remains solid; yet rising adoption of managed services shows that local companies now prize real-time insight over device ownership. Satellite–terrestrial hybrids, introduced to mitigate load-shedding outages and rural coverage gaps, expand the addressable base of applications across mining, agriculture, and logistics. Government smart-city financing, paired with falling sensor prices, signals that the South Africa IoT market will keep advancing even as macroeconomic volatility tests private spending.
Key Report Takeaways
- By component, hardware captured 42.50% revenue share in 2025 in the South Africa IoT market, while services are projected to grow at a 16.78% CAGR through 2031.
- By connectivity technology, 4G/5G cellular IoT led with 45.40% of the South Africa IoT market share in 2025; satellite and hybrid options are forecast to expand at a 20.74% CAGR to 2031.
- By application, fleet and asset tracking accounted for 24.40% share of the South Africa IoT market size in 2025; smart agriculture and climate monitoring are on track for a 21.58% CAGR between 2026-2031.
Note: Market size and forecast figures in this report are generated using Mordor Intelligence’s proprietary estimation framework, updated with the latest available data and insights as of 2026.
South Africa IoT Market Trends and Insights
Drivers Impact Analysis*
| Driver | (~) % Impact on CAGR Forecast | Geographic Relevance | Impact Timeline |
|---|---|---|---|
| Mobile broadband expansion and 5G rollouts | +2.8% | National; early gains in Gauteng, Western Cape, KwaZulu-Natal | Medium term (2–4 years) |
| Government smart-city spending commitments | +2.1% | Cape Town, Johannesburg, eThekwini, Tshwane | Long term (≥ 4 years) |
| Falling module and sensor ASPs | +1.9% | National; local assembly opportunities | Short term (≤ 2 years) |
| Enterprise cloud migration momentum | +1.7% | National; financial and mining sectors | Medium term (2–4 years) |
| NB-IoT / LTE-M spectrum allocation (2024) | +1.4% | National; rural connectivity focus | Medium term (2–4 years) |
| Rapid insurance telematics uptake | +1.2% | Urban centers nationwide | Short term (≤ 2 years) |
| Source: Mordor Intelligence | |||
Mobile broadband expansion and 5G rollouts
More than half of the population enjoyed 5G coverage by December 2024 as MTN and Vodacom switched on a combined 829 new sites, adding USD 1.5 billion in wireless revenue.[1]The throughput uplift lets device makers embed high-definition video and low-latency control loops into surveillance, mining automation, and remote healthcare. New fixed-wireless packages extend enterprise IoT connectivity to SMEs that lack affordable fiber. Ongoing 5.5G and direct-to-device satellite trials point to blended architectures that keep critical sensors online during grid disruptions, removing a long-standing infrastructure bottleneck. With bandwidth constraints easing, device counts climb and average data per node rises, magnifying the addressable analytics opportunity for service providers.
Government smart-city spending commitments
The R940 billion national infrastructure plan earmarks R375 billion for state-owned utilities, many of which tie funding tranches to measurable digital efficiency targets.[2] Municipalities already deploy Sigfox-enabled smart water meters, camera networks, and environmental probes that feed unified control rooms in Cape Town and Johannesburg. Procurement frameworks now bake in interoperability clauses, accelerating vendor accreditation and shrinking sales cycles. Public contracts often include multi-year maintenance clauses, creating predictable demand for managed services. By mandating open standards, local authorities indirectly lower integration hurdles for private-sector adopters, broadening the South Africa IoT market’s appeal to global platform vendors.
Falling module and sensor ASPs
Global chip fab expansion cut cellular module prices 15–20% during 2024, bringing sub-USD 4 LTE Cat-M1 units within reach of mid-tier integrators.[3] South African firms can now build break-even cases for smart metering or cold-chain tags at scale instead of limiting pilots to high-value assets. Local assembly programs at the Microelectronics and Nanotechnology Centre shorten import lead times and foster specialized designs for harsh mining environments. Because hardware cost is no longer the prime barrier, buyer scrutiny shifts to analytics quality and service uptime, pushing the value pool toward software.
Enterprise cloud migration momentum
Microsoft and AWS launched in-country zones that let regulated industries move petabyte-level telemetry into local data lakes without breaching sovereignty rules. MTN’s USD 690 million first-half 2024 capex strengthened edge nodes that couple private 5G with Azure Stack, giving mines and factories sub-30 millisecond round-trip latency for predictive-maintenance algorithms.[4] Discovery Health’s new Personal Health Pathways crunches 33 terabytes of patient data daily, proving the economics of cloud-native IoT workflows at national scale. As analytics adoption widens, demand grows for skills in data engineering and ML ops, further propelling the service segment.
Restraints Impact Analysis*
| Restraint | (~) % Impact on CAGR Forecast | Geographic Relevance | Impact Timeline |
|---|---|---|---|
| Load-shedding-induced network downtime | -3.2% | National, with severe impact in industrial areas | Short term (≤ 2 years) |
| 2G/3G sunset retrofit costs (SME pain-point) | -2.1% | National, concentrated in rural and township areas | Medium term (2-4 years) |
| Cyber-skills shortage | -1.8% | National, concentrated in urban technology centers | Long term (≥ 4 years) |
| Slow public-sector procurement cycles | -1.4% | National, affecting municipal and government IoT projects | Long term (≥ 4 years) |
| Source: Mordor Intelligence | |||
Load-shedding-induced network downtime
Eskom generated 25,000 MW against the demand of 31,000 MW in early 2024, forcing rotational cuts that eroded telecom uptime and diverted billions into diesel and lithium battery backups. Even after a temporary reprieve in April 2024, operators kept installing solar plus battery micro-sites to shield IoT gateways. Retailer Shoprite deployed SmartSense to shut down non-critical refrigeration during blackouts, proving that resilient edge architectures can lower energy drag while preserving data. Yet the cost of redundancy still inflates the total cost of ownership and delays ROI for first-time adopters, especially SMEs with thin margins.
Cyber-skills shortage
South Africa ranked third for cybercrime victims in 2024, losing R2.2 billion to attacks that exploited poorly secured endpoints. Only a fraction of network engineers hold modern IoT security credentials, leaving gaps in threat modeling and zero-trust design. Check Point’s July 2024 index pegged national risk at 42%, well above global median levels. Because mining and utilities operate life-critical systems, boards demand proven expertise before green-lighting large telemetry projects. In response, Cisco funded regional academies and vendor-neutral boot camps, yet talent pipelines take years to mature, limiting near-term deployment velocity outside tier-one integrators.
*Our forecasts treat driver/restraint impacts as directional, not additive. The impact forecasts reflect baseline growth, mix effects, and variable interactions.
Segment Analysis
By Component: Services Drive Platform Integration
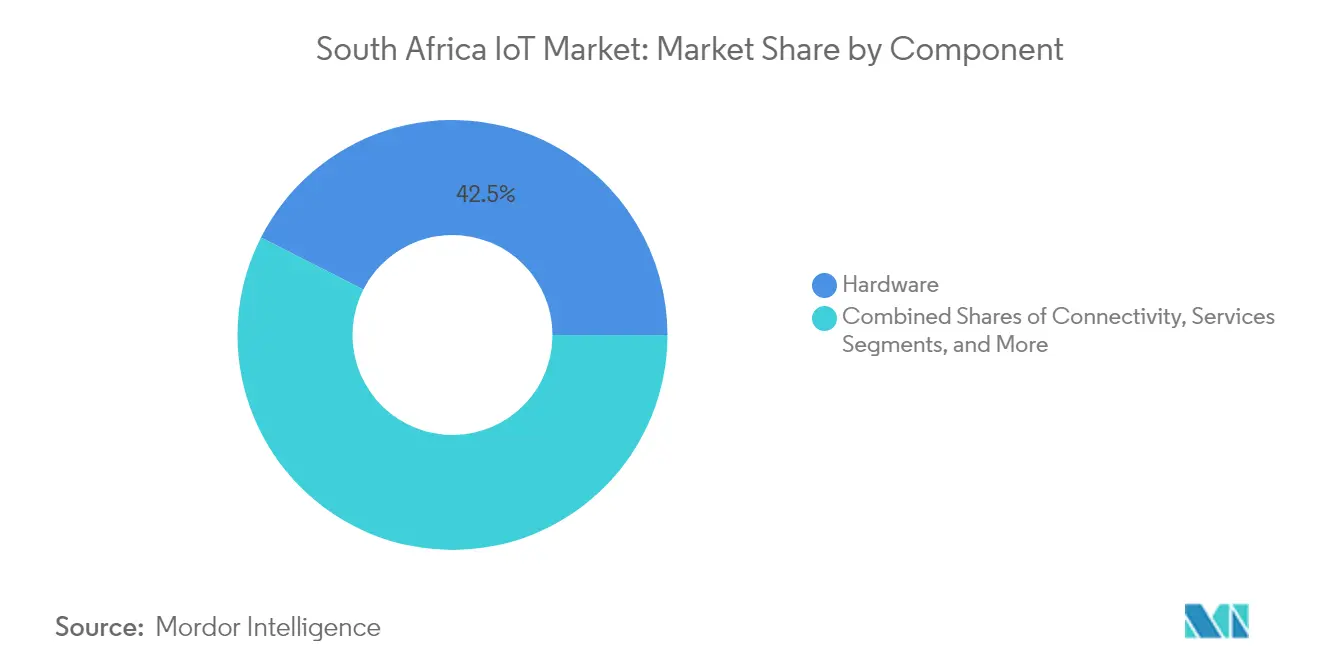
Hardware commanded 42.50% of 2025 revenue, confirming that sensors and gateways remain core to every installation. The South Africa IoT market continues to buy ruggedized units for underground mining and remote agriculture, but growth is tapering as inventories last longer and multi-protocol chips ship ready-certified. Services, by contrast, post a 16.78% CAGR to 2031 because enterprises seek end-to-end governance, root-cause analytics, and lifecycle security patches that in-house teams cannot scale. Multi-tenant device orchestration lowers per-node management cost, while outcome-based contracts shift risk to providers.
Enterprises increasingly bundle software, cloud storage, and 24×7 support into predictable monthly fees, reshaping capital outlays into operating budgets. Trinity’s dual-SIM device-management suite illustrates the pivot: customers pay for guaranteed uptime rather than modems. As vertical templates multiply across healthcare, insurance, and retail, competitive edge moves up the stack toward domain-specific dashboards. This service-centric motion unlocks consistent recurring revenue that smooths the earnings profile of vendors operating in the volatile macro backdrop of the South Africa IoT market.

By Connectivity Technology: Satellite Solutions Address Infrastructure Gaps
4G/5G networks supplied 45.40% of connected nodes in 2025, lifting the South Africa IoT market size for cellular links to roughly USD 1.95 billion. Dense urban grids and mid-band spectrum auctions make mobile broadband the de facto baseline for video, industrial automation, and POS terminals. Nonetheless, satellite-enabled and hybrid links are accelerating at 20.74% CAGR through 2031. This surge follows MTN’s direct-to-device tests with Lynk and the planned launch of Iridium’s 5G-compatible Project Stardust in 2026, projects that promise seamless handover when terrestrial towers go dark.
The reliability of space-based coverage resonates with logistics fleets crossing sparsely populated Karoo or Kalahari routes where cellular fades. Regulatory clearance for non-geostationary constellations pushes device makers to design multi-bearer chipsets, boosting unit volumes. For low-power sensor clusters, LoRa and Sigfox remain viable thanks to 10-year battery life; yet integrators increasingly combine them with satellite backhaul for redundancy. In effect, the connectivity stack is coalescing into a layered model that chooses the lowest-cost bearer per packet while guaranteeing five-nines availability demanded by heavy industry.
By Application Category: Agriculture Innovation Accelerates
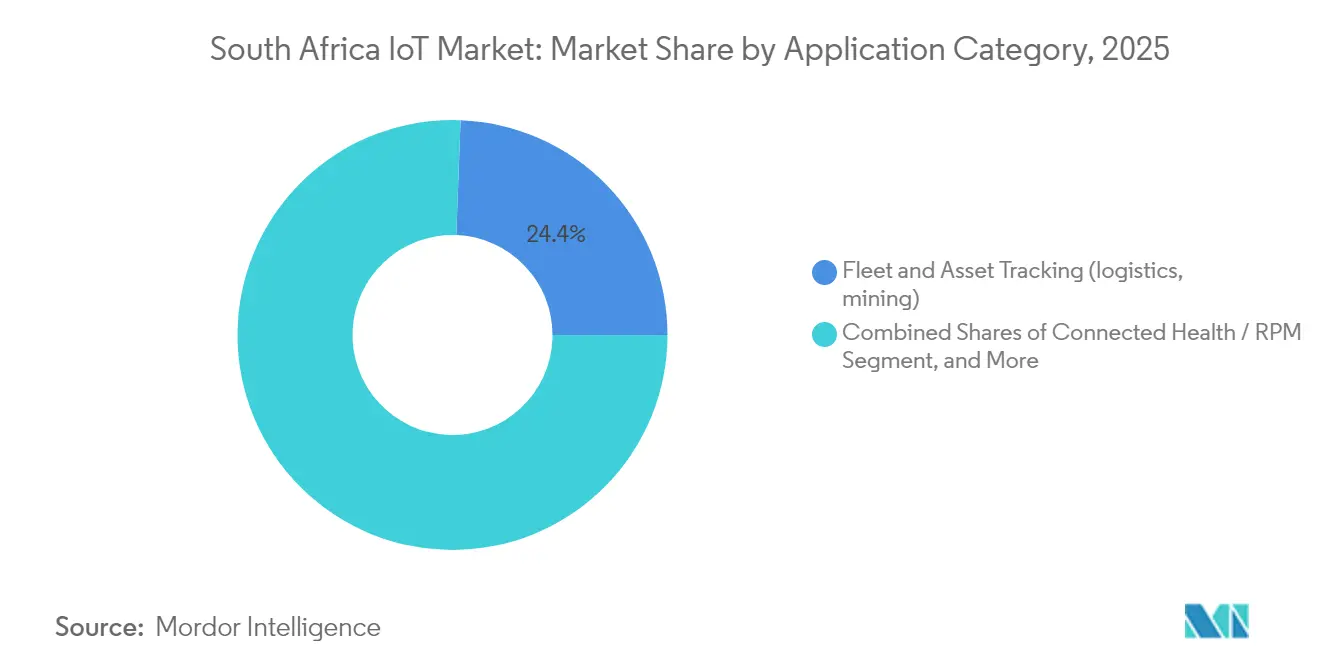
Fleet and asset tracking delivered 24.40% of total 2025 sales as mining trucks, port cranes, and cold-chain trailers streamed telematics for compliance and insurance rebates. Voyage visibility platforms track ore from pit to port, while Kumba Iron Ore’s USD 600 million UHDMS plant relies on real-time vibration sensors for predictive shutdowns. The South Africa IoT market size for tracking applications is projected to grow steadily, though its share will dilute as farming and climate systems scale.
Smart agriculture and climate monitoring outpace all other uses at a 21.58% CAGR between 2026-2031. Western Cape vineyards deploy soil probes and aerial drones feeding Vodacom’s MyFarmWeb for moisture-stress alerts, cutting irrigation costs by 20% in pilot fields. Citrus exporters add ethylene-gas meters in reefer containers to protect shelf life on long voyages. Subsidized weather stations in Limpopo supply early-warning indices for insurance parametric payouts that lower smallholder risk. Because agritech touches food security, lenders and development agencies co-finance deployments, accelerating rural sensor density and diversifying revenue streams within the South Africa IoT market.
Geography Analysis
Gauteng anchors enterprise demand with 69% 5G coverage, deep financial services, and head offices for mining majors, making it a natural launchpad for industrial analytics platforms. Western Cape blends a thriving start-up scene with export-oriented horticulture, turning Stellenbosch test beds into commercial smart-farming contracts. KwaZulu-Natal’s port corridors and automotive clusters use IoT to de-risk supply chain bottlenecks; telematics-rich truck fleets now share congestion data with customs brokers to optimize berth allocation.
Rural provinces adopt satellite links and LPWAN to leapfrog tower build-outs, linking weather stations, pump controls, and anti-poaching collars. National Treasury’s funding of 15 million Sigfox water meters pushes device densities beyond urban confines, increasing total addressable nodes even where per-capita income is lower. Municipalities weave connected lighting, CCTV, and parking into integrated command centers, nudging citizens toward app-based service requests that create fresh data pools for predictive planning.
Cross-border trade with Namibia and Botswana prompts logistics players to fit multi-IMSI SIMs, ensuring continuous tracking well into the Trans-Kalahari corridor. Because ICASA enforces technology-neutral spectrum licensing, satellite operators face minimal red tape when onboarding new ground stations, a stance that bolsters regional interoperability. Overall, the South Africa IoT market extends its influence as a continental hub, exporting expertise to neighboring states while attracting multinational platform vendors to set up African headquarters in Johannesburg or Cape Town.
Regulatory Landscape
South Africa's IoT deployments sit under ICASA's communications equipment authorization and spectrum management frameworks, alongside national data and cyber laws such as POPIA and the Cybercrimes Act that shape how telemetry is handled and how endpoints are secured. A key enforcement inflection has been the government-led 2G/3G sunset, including the prohibition on type approval for 2G/3G-only devices effective 30 September 2024, which has pushed device OEMs and integrators toward LTE-M/NB-IoT and multi-bearer designs.
In 2026, regulation moved further toward enabling new access models and faster infrastructure rollout. ICASA published Dynamic Spectrum Access and Opportunistic Spectrum Management regulations for the 3800-4200 MHz and 5925-6425 MHz bands (May 2026), and implemented an updated type-approval schedule effective 1 April 2026. In parallel, the Department of Communications and Digital Technologies (DCDT) positioned IoT, AI, and cloud computing as strategic focus areas in its 2026-2027 planning, and advanced policy direction aimed at rapid deployment of electronic communications facilities. This has direct implications for the cost and timelines of IoT network densification and private-network builds.
Value Chain Analysis
The South Africa IoT value chain starts with device and module sourcing (largely imported, with limited local assembly for ruggedized or specialized designs) and moves through connectivity provisioning (cellular, LPWAN, and emerging satellite-hybrid architectures), device management, cloud/edge hosting, application platforms, and systems integration into vertical workflows. Mobile network operators and their enterprise units (notably MTN, Vodacom, and Telkom) play outsized roles by bundling SIM/eSIM connectivity, managed services, and platforms. Recent examples include MTN Connected Things launching a Connectivity Management Platform (CMP) with Eseye in Q2 2025, and Vodacom Business introducing Local Breakout in September 2025 to route global SIM traffic locally, lowering latency while supporting data-residency and compliance needs.
Downstream, municipal utilities and smart-city buyers shape the channel structure through framework procurement, with National Treasury's RT-29 transversal contract acting as a scaling mechanism for smart metering and related services. Execution bottlenecks concentrate around legacy-to-modern migration and operational resilience: the 2G/3G shutdown timetable drives retrofit cycles for installed bases, and load-shedding raises the bill of materials and field-service demands for power backup at gateways, base stations, and edge sites. As a result, more value shifts toward lifecycle management, monitoring, and outcome-based service contracts.
Competitive Landscape
Vodacom, MTN, and Telkom anchor connectivity through nationwide cellular and LPWAN footprints, allowing them to bundle data plans with cloud gateways and managed dashboards. Their combined infrastructure depth yields economies of scale, yet strategic differentiation now resides higher in the stack. MTN channels USD 690 million per year into edge-cloud and AI accelerators, while Vodacom’s alignment with Microsoft and Google enhances its application-layer stickiness. Telkom leverages state-owned backbone routes to underprice backhaul for municipal projects, securing long-term public contracts.
At the application layer, Tracker SA and Cartrack compete for fleet telematics subscriptions, tapping insurance incentives to lift attach rates. Red Ant Agri tailors smart seeding implements and in-field telemetry, reflecting a vertical-focus trend among emergent players. Plentify pursues residential energy management, integrating geyser controls that shave peak demand during power cuts. Global tech giants IBM, Cisco, and Huawei embed middleware and security modules into these local offerings, sharing revenue via joint go-to-market agreements.
Demand for secure, power-resilient solutions sparks opportunities for specialists in battery augmentation, edge compute, and zero-trust orchestration. System integrators that master operational technology protocols alongside IT governance gain an edge in brownfield mines and factories. Because buyers want turnkey outcomes, partnerships that fuse network reach with domain expertise will likely shape future market share gains within the South Africa IoT market.
South Africa IoT Industry Leaders
-
MTN Group
-
Microsoft Corporation
-
IBM Corporation
-
Huawei Technologies
-
Vodacom Group
- *Disclaimer: Major Players sorted in no particular order
Market Opportunities and Future Outlook
Utility digitization anchored in public procurement remains a clear whitespace, with RT-29 providing a structured route to scale smart metering, leakage detection, and municipal revenue assurance beyond pilots. The shift is already visible in awards and appointments, including Sigfox South Africa being selected to provide connectivity for more than 15 million smart water meters under RT-29 (June 2024), Vodacom being appointed as a smart metering service provider under RT-29 (May 2024), and MTN Business commencing rollout of advanced smart metering solutions for municipalities under the same contract (February 2025). As these deployments expand, adjacent demand builds for analytics, device lifecycle security, and integration into billing, field-service, and fraud-detection workflows.
Data-residency and low-latency architectures also support in-country hosting, edge compute, and managed IoT security that align with regulated-sector requirements. Vodacom Business's Local Breakout launch in September 2025 reflects connectivity redesign around keeping IoT SIM traffic local, while Microsoft's April 2026 commitment of USD 329 million for South African cloud infrastructure expansion supports additional domestic capacity for IoT data lakes and AI workloads where power and water readiness are gating factors. On connectivity, ICASA's 2026 actions on dynamic spectrum access and related spectrum planning create a pathway for shared-spectrum models and private-network-style deployments that fit industrial automation and smart-city densification. This, in turn, raises the value of standardizing compliance, device certification, and multi-network operations across cellular, LPWAN, and satellite-hybrid links for system integrators.
Recent Industry Developments
- April 2026: Microsoft committed USD 329 million to expand cloud infrastructure in South Africa, covering data center land acquisition and upgrades for power and water readiness alongside skills initiatives. This reinforces local hosting capacity for high-volume IoT telemetry and analytics, and supports data-residency driven architectures for regulated industries.
- September 2025: Vodacom Business launched Local Breakout (LBO) in South Africa to route global IoT SIM traffic locally rather than via overseas gateways. The change reduces latency and supports use cases that require in-country processing and compliance, strengthening Vodacom's positioning for government and financial-services IoT tenders.
- June 2024: Sigfox South Africa was selected to provide connectivity for more than 15 million smart water meters under National Treasury's RT-29 tender framework. The scale of this program expands LPWAN device volumes and creates a follow-on services pool for installation, monitoring, and integration with municipal revenue and water-loss management systems.
Research Methodology Framework and Report Scope
Market Definition and Coverage
For this study, the South Africa IoT market is defined as the revenue generated from connected devices and the enabling stack that makes them work, including connectivity, platforms/software, and related services used across industries within South Africa.
Scope exclusions: Consumer gadgets that are not part of an IoT deployment (such as standalone wearables) and pure telecom voice and data plans that are not tied to IoT connectivity are excluded.
Segmentation Overview
- By Component
- Hardware
- Software and Platforms
- Connectivity
- Services
- By Connectivity Technology
- 4G / 5G Cellular IoT (incl. NB-IoT, LTE-M)
- 2G / 3G Legacy Cellular IoT
- Non-cellular LPWAN (LoRa, Sigfox)
- Short-Range (Wi-Fi, BLE, Zigbee, RFID)
- Satellite and Hybrid IoT
- By Application Category
- Fleet and Asset Tracking (logistics, mining)
- Smart Metering (water, electricity, gas)
- Industrial Automation / Predictive Maintenance
- Smart Agriculture and Climate Monitoring
- Connected Health / RPM
- Smart Retail and POS
- Consumer Smart-Home
- Safety and Security (surveillance, alarms)
- Micro / Prosumer
Data Sources, Market Sizing, and Validation
Desk Research
Desk research set the base structure of the model and helped us pin down what should be counted as IoT revenue in South Africa. We leaned on public sources such as Statistics South Africa for sector indicators, ICASA releases for telecom and spectrum context, and the Department of Communications and Digital Technologies for national digital priorities that shape adoption timelines.
To keep assumptions realistic, we also referred to sources such as ITU and GSMA publications for connectivity trends, and we used World Bank macro series for inflation and FX context to keep the USD sizing consistent year to year. Company annual reports, investor decks, and reputable press coverage were then used to validate direction of spending by vertical and the timing of new deployments. Where needed, paid database subscriptions were used only to speed up company financial screening, patent scanning, and contract and tender tracking for public sector and large enterprise IoT rollouts. These examples are not exhaustive, and many other sources were used for data collection, validation, and clarification during the research process.
Primary Interviews and Surveys
Primary work focused on interviews and structured surveys with connectivity providers, IoT solution integrators, platform and software specialists, device and module distributors, and end users that procure IoT in sectors such as utilities, transport, retail, mining, and manufacturing. We used these discussions to pressure test revenue splits across components, confirm typical pricing and deployment sizes, and validate whether reported growth was driven by new connections, higher value services, or renewals. Coverage was balanced across the country's major economic hubs to reflect differences in enterprise rollout timing.
Distribution of primary research fieldwork respondents
| Company type | Respondent position |
|---|---|
| Top tier: 36% | CXOs: 16% |
| Mid tier: 45% | Functional/Unit leaders: 32% |
| Smaller Players: 19% | Managers: 52% |
Market-Sizing & Forecasting
Sizing started with a top-down build where sector demand signals were converted into an IoT spend pool, and then allocated across hardware, software/platform, connectivity, and services based on validated adoption patterns. In parallel, selective bottom-up checks were run using sampled supplier and integrator revenue ranges, typical deployment sizes, and observed pricing, which helped adjust totals when any single input looked too optimistic.
Key inputs that shaped the model included the pace of new IoT connections, mix shifts toward managed services, average recurring connectivity pricing, device replacement cycles in harsh operating environments (for example mining and logistics), and the rollout timing of 4G and 5G coverage that affects what can be deployed economically. We also tracked enterprise digitization spend direction and public sector smart infrastructure programs, since these often move the market in step changes rather than smooth lines.
For forecasting, we used scenario analysis anchored to a base case, since IoT growth can swing with network upgrades, power reliability constraints, and capex cycles in key industries. Assumptions were tuned using primary feedback on pipeline strength, expected ASP movement, and the share of projects shifting from pilots to scaled rollouts. Where bottom-up data was incomplete, gaps were handled by applying conservative penetration rates to the relevant industry base and then reconciling the implied spend against interview-based reality checks.
Data Validation & Update Cycle
Validation was done through stepwise cross-checks so the final number stays aligned with observable market signals. Outputs were compared against independent indicators such as connectivity growth, sector investment direction, and public rollout activity, and then variance was reviewed to flag outliers that needed rework.
Before sign-off, assumptions and calculations were reviewed by another analyst, and any large changes triggered re-contact with selected interviewees to confirm what actually shifted. The report is refreshed annually, and interim updates are made when material events occur, such as major regulatory changes, sudden currency movements, or large project announcements. Right before delivery, we run a final pass to ensure the latest public updates and interview learnings are reflected consistently across tables and narrative.
Mordor Intelligence's South Africa IOT Market Sizing Compared With Other Published Estimates
Published values for South Africa IoT often vary because the term IoT gets counted differently across sources, and because the market can be expressed as connections, solution revenue, or a broader digital spending bucket. Differences in base year, FX timing, and whether forecasts assume steady or step-change adoption also tend to widen the spread.
The main gap comes from whether connectivity and ongoing services are counted alongside devices and platforms. Mordor Intelligence counts IoT across hardware, software, connectivity, and services within South Africa, and then ties the split to validated adoption by end-user industries and refreshes price assumptions before finalizing the current-year figure.
Benchmark comparison
| Source | Market Size | Gaps in Research Methodology |
|---|---|---|
| Mordor Intelligence | USD 4.85 B (2026) | |
| Industry Body Report A | USD 7.80 B (2025) | This figure is presented as a broad IoT revenue range and can reflect a wider solution and digital spend interpretation, with limited clarity on how hardware, connectivity, and services are separated and how currency timing is handled. |
| Trade Publisher B | USD 4.98 B (2022) | This estimate uses an older base year and appears to embed a more aggressive growth curve, which can inflate the forward number if early-stage adoption is extrapolated without re-checking pricing and scaled deployment conversion rates. |
The comparison shows that most of the variation is explained by scope and timing rather than a true disagreement on demand direction. By keeping the model tied to component-level spending and cross-checking it against adoption and pricing inputs that can be re-tested each year, we end up with a market size that is easier to reproduce and track over time.
Key Questions Answered in the Report
What is the current size of the South Africa IoT market?
The market is valued at USD 4.85 billion in 2026 and is projected to reach USD 8.86 billion by 2031.
Which component segment is growing fastest?
Services are expanding at a 16.78% CAGR through 2031 as companies seek managed analytics and integration support.
Why are satellite connections gaining traction in South Africa?
Satellite and hybrid links grow at 20.74% CAGR because they bypass load-shedding outages and cover rural areas where cellular coverage is weak.
How large is the fleet and asset tracking opportunity?
Fleet and asset tracking accounts for 24.40% of the South Africa IoT market share in 2025, underscoring steady demand across mining and logistics.
What is the biggest restraint on market growth?
Load-shedding-induced network downtime subtracts 3.2 percentage points from forecast CAGR, making power resilience a prerequisite for new deployments.
Which province leads IoT adoption?
Gauteng holds leadership with 69% 5G coverage and a dense concentration of enterprise headquarters, driving early-stage demand for industrial analytics.