Market Overview
| Study Period | 2017 - 2030 |
|---|---|
| Base Year For Estimation | 2024 |
| Forecast Data Period | 2025 - 2030 |
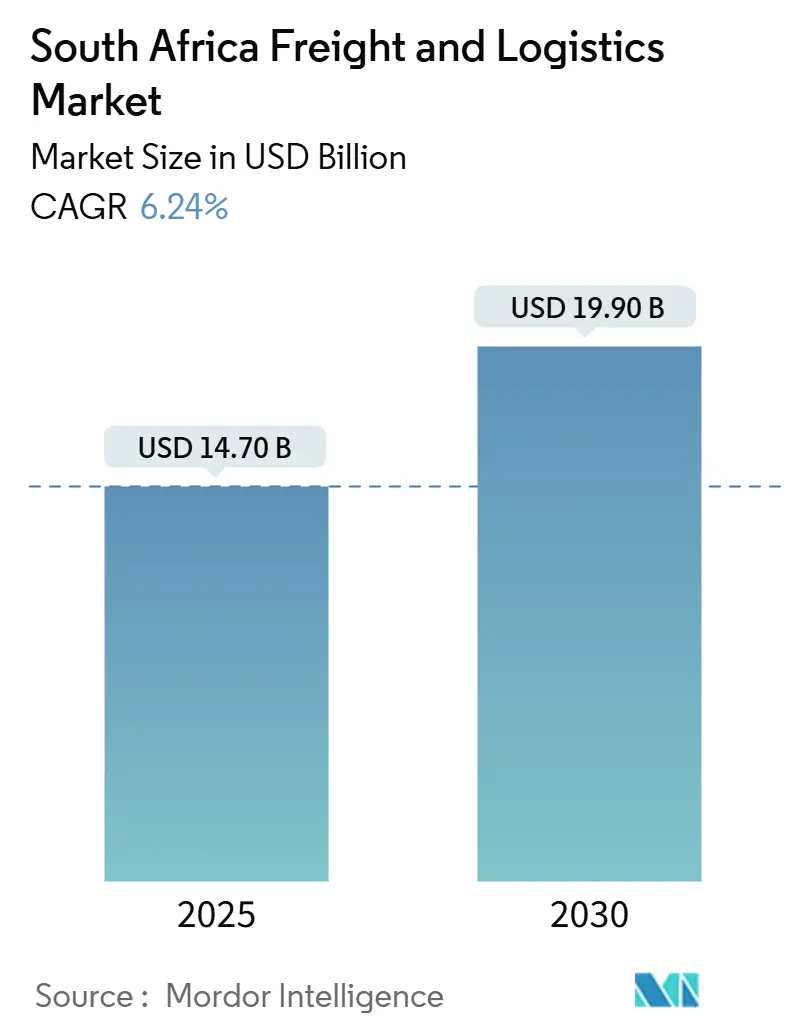
| Market Size (2025) | USD 14.70 Billion |
| Market Size (2030) | USD 19.90 Billion |
| Growth Rate (2025 - 2030) | 6.24% CAGR |
| Market Concentration | Low |
Major Players
*Disclaimer: Major Players sorted in no particular order Image © Mordor Intelligence. Reuse requires attribution under CC BY 4.0. |
|
South Africa Freight And Logistics Market Analysis by Mordor Intelligence
The South Africa freight and logistics market size is estimated at USD 14.70 billion in 2025, and is expected to reach USD 19.90 billion by 2030, at a CAGR of 6.24% during the forecast period (2025-2030). Stable macro-economic reforms, the African Continental Free Trade Area rollout, and renewed private investment in core transport corridors provide the structural pillars for expansion. Merchandise trade diversification toward regional markets is lifting demand for multimodal solutions, while the digitization of order fulfillment is accelerating last-mile parcel volumes. Infrastructure upgrades approved for Durban and Cape Town ports indicate long-needed capacity relief, although execution risk remains elevated. Currency volatility and driver shortages continue to weigh on operating costs, yet technology-led visibility tools help operators mitigate service disruptions and maintain high asset utilization.
Key Report Takeaways
- By logistics function, courier, express, and parcel (CEP) services are set to advance at a 7.18% CAGR between 2025-2030, whereas freight transport led with 74.36% of the South Africa freight and logistics market size in 2024.
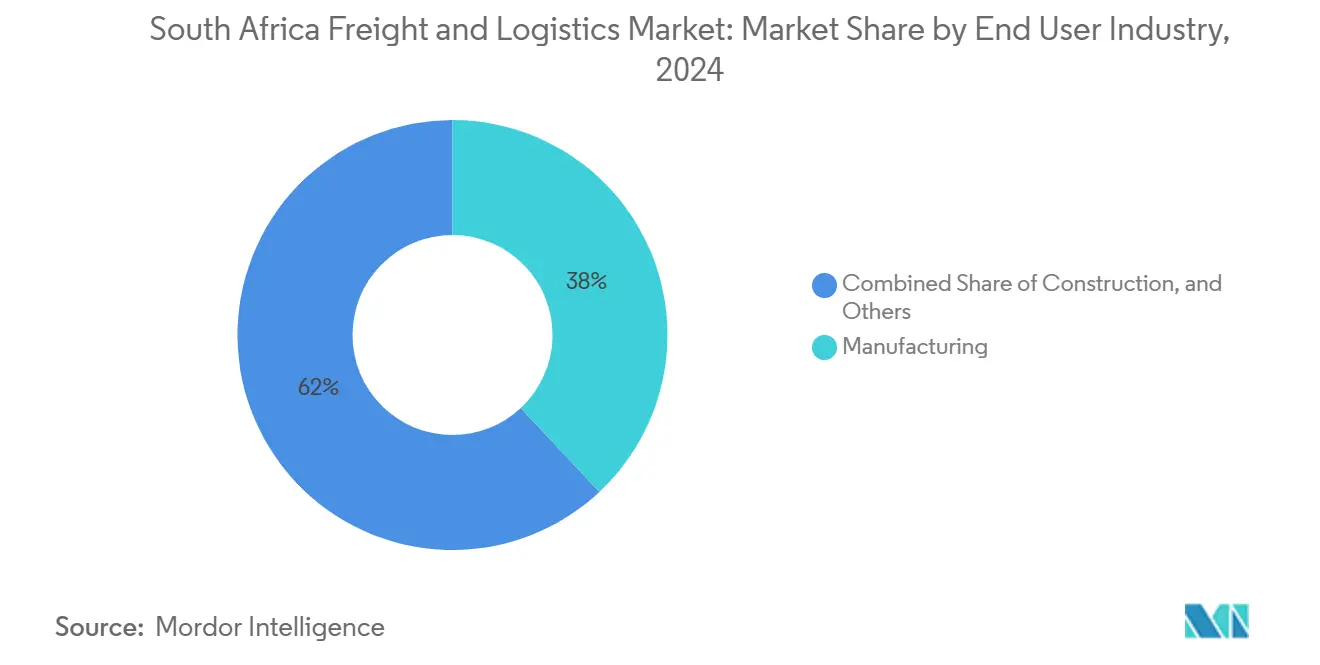
- By end user industry, manufacturing held 38.02% of the South Africa freight and logistics market share in 2024, while wholesale and retail trade is set to deliver the fastest 6.68% CAGR between 2025-2030.
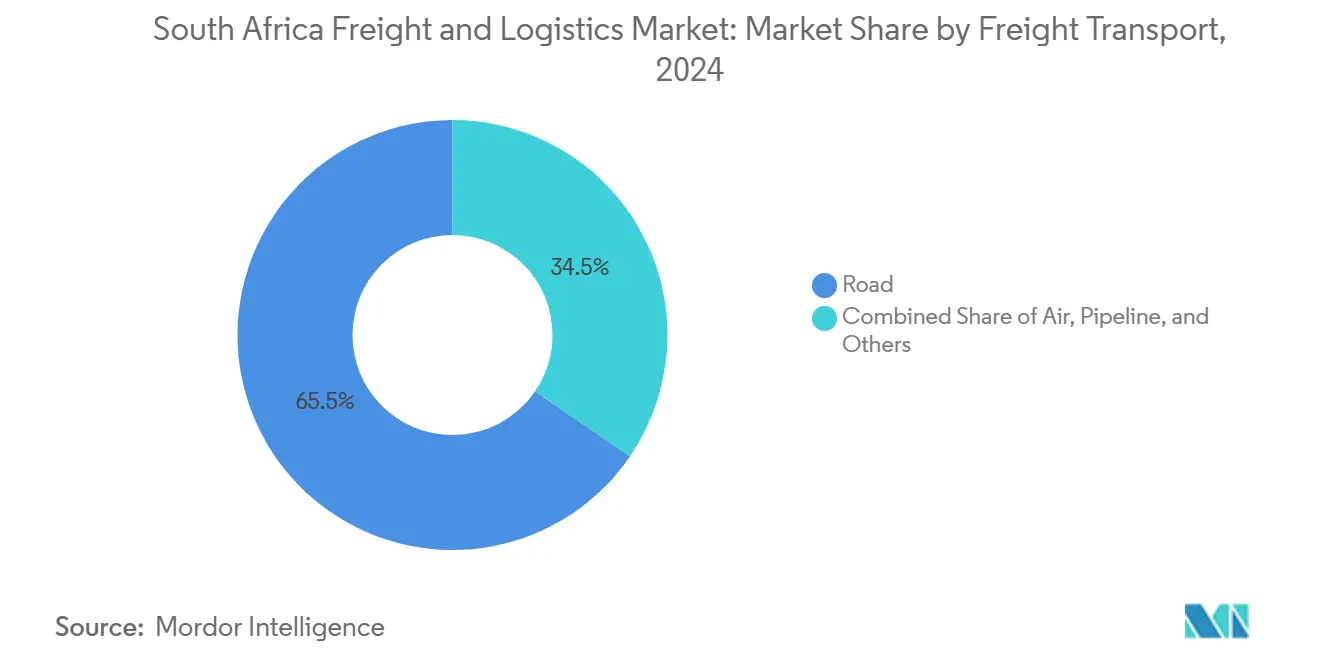
- By freight transport mode, road freight captured 65.47% of the revenue share in 2024 and air freight is projected to expand at a 7.04% CAGR between 2025-2030.
- By CEP service, domestic deliveries represented 64.78% of revenue share in 2024; international CEP is forecast to grow at 7.44% CAGR between 2025-2030.
- By warehousing and storage, non-temperature controlled facilities accounted for 91.81% of the revenue share in 2024, while temperature controlled space is set to advance at a 5.99% CAGR between 2025-2030.
- By forwarding mode, sea and inland waterways freight forwarding handled 72.23% of revenue share in 2024; air freight forwarding is expected to post a 6.30% CAGR between 2025-2030.
South Africa Freight And Logistics Market Trends and Insights
Drivers Impact Analysis
| Driver | (~) % Impact on CAGR Forecast | Geographic Relevance | Impact Timeline |
|---|---|---|---|
| Surge in e-commerce parcel volumes | +1.2% | National, concentrated in Gauteng, Western Cape, KwaZulu-Natal | Short term (≤ 2 years) |
| Public-private partnerships for rail revamp | +0.9% | National, with early gains in Gauteng-Durban corridor | Medium term (2-4 years) |
| Growing intra-Africa trade under AfCFTA | +1.1% | Cross-border corridors, particularly to SADC region | Long term (≥ 4 years) |
| Cold-chain demand from agro-exports | +0.8% | Western Cape, Limpopo, Mpumalanga agricultural zones | Medium term (2-4 years) |
| Adoption of freight visibility platforms | +0.6% | National, led by major urban centers | Short term (≤ 2 years) |
| OEM shift to alternative-fuel truck fleets | +0.4% | National, pilot projects in mining regions | Long term (≥ 4 years) |
| Source: Mordor Intelligence | |||
Understand The Key Trends Shaping This Market
Download PDF
Surge in E-commerce Parcel Volumes
Legislative liberalization in 2024 opened postal services to competition, enabling private operators to enter a CEP market that had been historically reserved for the South African Post Office (SAPO). Amazon’s 2024 launch alongside Takealot’s fulfillment network expansion multiplied daily parcel flows, prompting a rapid build-out of micro-fulfillment hubs close to consumer clusters. Bob Group installed automated parcel lockers across Gauteng malls, reducing failed deliveries and cutting average last-mile costs by 18%. Rider-supported routing platforms improve drop-density and compress delivery windows to six hours in metropolitan zones. Collectively, these shifts force incumbents to pivot from bulk optimization to high-frequency, high-precision parcel distribution anchored by API-based visibility tools[1]“Postal Services Amendment Act,” Department of Communications and Digital Technologies, gov.za.
Public-Private Partnerships for Rail Revamp
A December 2024 access framework granted qualified operators the right to run trains over Transnet lines, unlocking latent capacity on the Gauteng–Durban corridor. Anglo American’s USD 233 million compensation deal in May 2025 underscored growing private confidence in shared-track models. Early pilot services cut manganese export dwell time by 26% and trimmed unit costs 14% versus road haulage. Challenges persist, however, with cable theft costing the grid USD 327.60 million annually and rolling-stock age averaging 28 years. Government security task forces and on-board sensor alerts are being scaled to secure assets ahead of broader open-access adoption[2]“Rail Network Access Framework,” Department of Transport, transport.gov.za.
Growing Intra-Africa Trade Under AfCFTA
South Africa’s agricultural exports to fellow African economies reached USD 6 billion in 2024, equal to 44% of the country’s farmed-goods total. The rebuilt Beitbridge border post supports 1 000 trucks daily and cuts clearance time from 33 hours to 5 hours, strengthening the Gauteng–Zimbabwe–Zambia–DRC supply chain. Kuehne + Nagel’s purchase of Morgan Cargo extends temperature-controlled reach into Lusaka and Nairobi using hybrid truck-air solutions. Payments friction remains, with limited rand convertibility in frontier markets slowing settlement cycles. Nevertheless, operators are layering multi-currency wallets and blockchain trade finance rails to streamline cross-border invoicing[3]“Agricultural Export Statistics 2024,” Department of Agriculture, Land Reform and Rural Development, dalrrd.gov.za.
Cold-Chain Demand from Agro-Exports
Fresh-produce exports hit 4.2 million t in 2024 and generated USD 13.7 billion, yet post-harvest spoilage in rural nodes still approaches 40%. Solar-assisted modular cold rooms trimmed energy costs 32% at pilot sites in Limpopo, enabling farmer collectives to meet GlobalG.A.P. protocols for EU markets. IoT loggers now relay pallet-level temperature every 15 minutes through a GSM mesh, meeting new 2025 EU phytosanitary data mandates. Port-side bottlenecks, which erased USD 287.74 million from 2024 citrus exports, spotlight the urgency of end-to-end cold-chain integrity. Specialized 40-foot reefer investments and guaranteed berthing windows are emerging as differentiators for integrated service providers.
Restraints Impact Analysis
| Restraint | (~) % Impact on CAGR Forecast | Geographic Relevance | Impact Timeline |
|---|---|---|---|
| Rail network under-maintenance and theft | -1.4% | National rail corridors, particularly Gauteng-Durban | Short term (≤ 2 years) |
| Chronic port congestion and equipment age | -1.1% | KwaZulu-Natal and Western Cape ports | Medium term (2-4 years) |
| Driver shortage and rising labour costs | -0.8% | National, acute in long-haul routes | Short term (≤ 2 years) |
| Currency volatility impacting imports | -0.9% | National, affecting import-dependent sectors | Short term (≤ 2 years) |
| Source: Mordor Intelligence | |||
Rail Network Under-Maintenance and Theft
Transnet recorded a USD 398.59 million loss in FY 2023/24, capturing the depth of deferred maintenance across signaling, track and rolling stock assets. Cable theft forced the closure of 1 300 rail-kilometers, pushing bulk manganese, coal and container traffic onto road, inflating highway congestion and increasing per-ton logistics spend 18%. Business hesitate to commit volume to corridor revitalization until asset security improves, despite the open-access framework assuring third-party control rights.
Chronic Port Congestion and Equipment Age
Durban and Cape Town terminals averaged 8.2 days container dwell time in 2024 compared with peer benchmarks of 3.5 days. Rubber-tired gantry cranes, many beyond 20 years in service, operate below 60% utilization owing to frequent breakdowns. Shipping lines levy congestion surcharges of USD 150–USD 250 per TEU, eroding exporter margins and triggering modal shifts to Maputo and Walvis Bay. DP World’s USD 2.5 billion upgrade plan seeks to lift berth productivity to 35 moves per hour by 2029, yet execution timelines extend beyond the current produce-export peak cycles, sustaining pressure[4]“Phytosanitary Regulations Update,” European Commission, ec.europa.eu.
Segment Analysis
By End User Industry: Manufacturing Dominance Faces Retail Disruption
Manufacturing generated 38.02% of the South Africa freight and logistics market share in 2024 on the back of automotive, chemicals, and processed food output. Vehicle exports passing through Gqeberha demand specialized roll-on/roll-off scheduling and secure yards, supporting premium freight rates. Yet wholesale and retail trade grows at 6.68% CAGR between 2025-2030, as omnichannel retailers integrate click-and-collect and returns management, multiplying touchpoints and parcel flows.
Agricultural exporters require temperature-controlled trucking fleets able to meet tight EU arrival windows within 22 days of harvest. Construction material logistics correlates with national infrastructure spend, generating episodic cement, steel, and heavy-lift project cargo spikes. The oil and gas, mining, and quarrying segment remains foundational, yet modal shifts toward pipeline and rail for environmental compliance reshape cost structures. Renewables projects create new lanes for oversized wind-tower components, demanding route surveys and escort vehicles that only a subset of operators can supply.
Note: Segment shares of all individual segments available upon report purchase
Get Detailed Market Forecasts at the Most Granular Levels
Download PDF
By Logistics Function: CEP Drives Digital Commerce Transformation
The South Africa freight and logistics market size for logistics functions was dominated by freight transport at 74.36% in 2024, evidencing continued commodity bulk flows from mining and agriculture. Courier, express, and parcel activities are advancing at a 7.18% CAGR (2025-2030), catalyzed by online retail penetration that hit 7.5% of national sales in 2024. Private entrants leverage the revised Postal Services Act to erode legacy SAPO share, pursuing API enabled delivery applications that integrate directly with e-commerce platforms. Investments in micro-fulfillment sites within 30 km of key metro zones shorten average delivery promise to same day, aligning with rising consumer expectations.
Warehousing and storage occupy an essential supporting layer. Temperature-controlled capacity is expanding fastest as citrus, avocado, and pharmaceutical consignments require validated humidity and thermal profiles end-to-end. High-throughput automated racking systems yield picking accuracy above 99%, improving SKU availability for omnichannel retailers. Freight forwarding remains a critical orchestrator of cross-border movements, with value shifting toward data-rich trade compliance services rather than physical consolidation alone. The South Africa freight and logistics market continues to see operators bundle customs brokerage, cargo insurance and ESG reporting to defend yields against pure-play price challengers.
By Courier, Express, and Parcel: Domestic Volumes Drive International Growth
Domestic CEP captured 64.78% of 2024 parcel revenue, serving dense urban corridors where route optimization yields high stop density and improved cost per drop. Lockers and pickup points within convenience stores extend coverage in security-constrained suburbs, reducing failed delivery incidence by 30%. Express premium sub-segments generate higher yields per kilogram, especially for B2B parts replenishment, where OEMs guarantee two-hour delivery inside city limits.
International CEP volumes are growing at a 7.44% CAGR (2025-2030), reflecting SMEs that leverage digital marketplaces to export niche products into Europe and North America. The South Africa freight and logistics market size for international parcels remains smaller in absolute terms, yet yields nearly triple that of domestic consignments due to surcharges and customs processing fees. Competitive differentiation centers on automated duty calculation and landed-cost transparency, fostering trust among first-time exporters.
By Warehousing and Storage: Temperature Control Drives Premium Growth
Non-temperature controlled facilities represented 91.81% of revenue share in 2024, anchored by demand from consumer goods, automotive spares, and FMCG distributors. Developers erect big-box sites along N3 and N1 corridors where 30,000 m² units with 15 m clear heights accommodate e-commerce inventory swings. Rental escalations average 7% annually owing to limited serviced land near highway interchanges.
Temperature-controlled space records 5.99% CAGR between 2025-2030 as stringent EU and GCC import standards push exporters toward audit-ready facilities with HACCP certification. Solar-powered refrigeration reduces grid reliance in load-shedding periods, sustaining product integrity. Pharmaceutical logistics operators integrate validated warehousing with GDP-compliant line-haul, creating one-stop cold-chain propositions that capture vaccine distribution tenders.
By Freight Transport: Road Supremacy Challenged by Modal Shift
Road freight retained 65.47% of the segmental revenue share in 2024, supported by a national paved-road grid exceeding 750,000 km. Yet air freight is expanding at 7.04% CAGR (2025-2030) to serve pharmaceuticals, electronics and high-value perishables requiring transit below 48 hours. OR Tambo International processed 493,000 tons of cargo in 2024, marking a 9% rise over 2023.
Rail’s share has fallen to below 20% following continued asset theft and signaling failures, despite inherent cost advantages on distances above 500 km. The government moves to concession branch lines to private operators to seek to restore competitiveness. Sea freight remains critical as Durban handles over 60% of containers, yet long dwell times erode reliability. Pipeline throughput for refined fuels stays stable under long-term ship-or-pay agreements, with moderate volume growth linked to inland demand.
Note: Segment shares of all individual segments available upon report purchase
Get Detailed Market Forecasts at the Most Granular Levels
Download PDF
By Freight Forwarding: Sea Routes Anchor Air Growth
Sea and inland waterways freight forwarding holds 72.23% market share by revenue in 2024, underpinned by commodity export flows and containerized imports from Asia. Congestion drives adoption of digital queue management that assigns berthing windows based on live inland haulage telemetry, trimming demurrage charges by 14% in pilot runs.
Air forwarding is set to expand at a 6.30% CAGR (2025-2030), buoyed by temperature-controlled pharmaceuticals and time-definite electronics deliveries. Forwarders co-locate consolidation hubs within airport perimeters to shorten ramp transfer times to under 90 minutes. Multimodal forwarding blends sea-air and road-rail to balance cost against service, especially for project cargo moving to landlocked SADC markets.
Geography Analysis
Gauteng province generated 35% of South Africa freight and logistics market activity in 2024, supported by a diversified economic base and OR Tambo’s cargo connectivity. High warehouse absorption rates around Johannesburg reach 800 000 m² annually, reflecting strong 3PL and retailer demand. KwaZulu-Natal follows, leveraging Durban port, yet suffers from road congestion that depreciates schedule reliability. Provincial investment incentives target truck staging yards and alternative truck-rail shuttles to decongest the N3 corridor.
Western Cape contributes roughly 20% market share with export-oriented agriculture dominating temperature-controlled flows. Cape Town port’s berth productivity upgrades, due by 2027, aim to reduce container dwell time to four days. Limpopo and Mpumalanga provide mineral and agricultural volume underpinning rail revamp economics. The Northern Corridor through Beitbridge now processes 1 000 trucks daily, lifting regional SADC trade and enhancing South Africa freight and logistics market links with Zimbabwe and Zambia.
Free State, North West and Eastern Cape round out activity with agricultural and automotive outputs feeding coastal ports. Infrastructure gaps remain in secondary roads, inflating farm-gate to port haulage times. Provincial road agency maintenance backlogs widen during fiscal constraint periods, encouraging private toll-road concessions. Overall, geographic diversification mitigates single-node disruption risk but requires coherent inter-provincial investment coordination to unlock full AfCFTA potential.
Competitive Landscape
Global heavyweights escalate acquisition and infrastructure spending to capture volume; however, the South Africa market is still fragmented. DSV closed its USD 15.3 billion DB Schenker takeover in April 2025, integrating capacity across 2,500 African lanes and offering unified visibility portals to multinational shippers. DP World earmarked USD 2.5 billion for port terminal and inland park upgrades, committing to raise throughput by 60% across Durban, Cape Town, and inland hubs.
Domestic champions such as Imperial Logistics leverage regional expertise, pursuing asset-light cross-border strategies and last-mile joint ventures with e-commerce marketplaces. Niche providers specialize in reefer trucking, dangerous-goods handling, and oversized cargo, commanding premiums through regulated capabilities. Technology differentiators include live temperature telemetry, blockchain document repositories, and carrier performance scores integrated into customer dashboards.
Price competition remains most intense in road haulage, where low entry barriers attract thousands of micro-fleets. Rising fuel and labor costs spur consolidation as small operators seek scale benefits in procurement and telematics deployment. Regulatory oversight by the Transport Economic Regulator focuses on preventing predatory pricing while enabling fair third-party access to rail and port assets, balancing state revenue objectives against private operator competitiveness.
South Africa Freight And Logistics Industry Leaders
-
DP World (Including Imperial Logistics Pty Ltd.)
-
Kuehne+Nagel
-
Transnet Freight Rail
-
DHL Group
-
DSV A/S (Including DB Schenker)
- *Disclaimer: Major Players sorted in no particular order

Need More Details on Market Players and Competitors?
Download PDF
Recent Industry Developments
- May 2025: DP World announced a USD 2.5 billion investment across South African port terminals and inland distribution centers to alleviate congestion and expand annual capacity.
- May 2025: Transnet reached a USD 233 million settlement with Sasol covering historical rail service disputes, paving the way for predictable petrochemical rail volumes.
- April 2025: DSV finalized its USD 15.3 billion acquisition of DB Schenker, creating the world’s largest integrated logistics provider.
- February 2025: Kuehne+Nagel purchased Morgan Cargo to boost perishables forwarding capabilities in African export corridors.
South Africa Freight And Logistics Market Report Scope
Agriculture, Fishing, and Forestry, Construction, Manufacturing, Oil and Gas, Mining and Quarrying, Wholesale and Retail Trade, Others are covered as segments by End User Industry. Courier, Express, and Parcel (CEP), Freight Forwarding, Freight Transport, Warehousing and Storage are covered as segments by Logistics Function.
End User Industry
| Agriculture, Fishing, and Forestry |
| Construction |
| Manufacturing |
| Oil and Gas, Mining and Quarrying |
| Wholesale and Retail Trade |
| Others |
Logistics Function
| Courier, Express, and Parcel (CEP) | By Destination Type | Domestic |
| International | ||
| Freight Forwarding | By Mode of Transport | Air |
| Sea and Inland Waterways | ||
| Others | ||
| Freight Transport | By Mode of Transport | Air |
| Pipelines | ||
| Rail | ||
| Road | ||
| Sea and Inland Waterways | ||
| Warehousing and Storage | By Temperature Control | Non-Temperature Controlled |
| Temperature Controlled | ||
| Other Services | ||
| End User Industry | Agriculture, Fishing, and Forestry | ||
| Construction | |||
| Manufacturing | |||
| Oil and Gas, Mining and Quarrying | |||
| Wholesale and Retail Trade | |||
| Others | |||
| Logistics Function | Courier, Express, and Parcel (CEP) | By Destination Type | Domestic |
| International | |||
| Freight Forwarding | By Mode of Transport | Air | |
| Sea and Inland Waterways | |||
| Others | |||
| Freight Transport | By Mode of Transport | Air | |
| Pipelines | |||
| Rail | |||
| Road | |||
| Sea and Inland Waterways | |||
| Warehousing and Storage | By Temperature Control | Non-Temperature Controlled | |
| Temperature Controlled | |||
| Other Services | |||
Need A Different Region or Segment?
Customize Now
Market Definition
- Agriculture, Fishing, and Forestry (AFF) - This end user industry segment captures the external (outsourced) logistics expenditure incurred by the AFF industry players. The end user players considered are the establishments primarily engaged in growing crops, raising animals, harvesting timber, harvesting fish & other animals from their natural habitats and providing related support activities. Herein, Logistics Service Providers (LSPs) play a crucial role in acquisition, storage, handling, transportation, and distribution activities for the optimal & continuous flow of inputs (seeds, pesticides, fertilizers, equipment, and water) from manufacturers or suppliers to the producers and smooth flow of output (produce, agro-goods) to distributors/ consumers. This includes both termperature controlled and non-temperature controlled logistics, as and when required according to the shelf life of goods being transported or stored.
- Construction - This end user industry segment captures the external (outsourced) logistics expenditure incurred by the construction industry players. The end user players considered are the establishments primarily engaged in constructing, repairing and renovating residential & commercial buildings, infrastructure, engineering works, subdividing and developing land. Logistics Service Providers (LSPs) play a crucial role in increasing profitability of construction projects by maintaing the inventory of raw materials & equipment, time-critical supplies and by providing other value added services for effective project management.
- Courier, Express, and Parcel - The Courier, Express, and Parcel services, often called as CEP Market, refers to the logistics and postal service providers which specialize in moving small goods (parcels/packages). It captures the overall market size (USD) and market volume (number of parcels) of (1) the shipments/parcels/packages which are under 70kgs/ 154lbs weight, (2) Business Customer packages viz. Business-to-Business (B2B) & Business-to-Consumer (B2C) as well as private customer packages (C2C), (3) non-express parcel delivery services (Standard and Deferred) as well as express parcel delivery services (Day-Definite-Express and Time-Definite-Express), (4) domestic as well as international parcels.
- Demographics - To analyse total addressable market demand, population growth & forecasts have been studied and presented in this industry trend. It represents population distribution across categories like gender (male/female), development area (urban/rural), major cities among other key parameters like population density and final consumption expenditure (growth and share % of GDP). This data has been used for assessing the fluctations in demand & consumption expenditure, and the major hotspots (cities) of potential demand.
- Export Trends and Import Trends - Overall logistics performance of an economy is positively and significantly (statistically) correlated to its trade performance (exports and imports). Hence, in this industry trend, total value of trade, major commodities/ commodity groups and the major trade partners, for the studied geography (country or region as per the scope of report) have been analysed alongside the impact of major trade/logistics infrastructure investments & regulatory environment.
- Freight Forwarding - Freight forwarding which herein refers to the freight transportation arrangement (FTA) industry includes establishments primarily engaged in arranging & tracking transportation of freight between shippers and carriers. Logistics Service Providers (LSPs) considered are freight forwarders, NVOCCs, custom brokers and marine shipping agents. Others segment under Freight Forwarding captures the revenue earned through value added services of FTA like custom brokerage/clearance activities, preparation of freight related documentation, consolidation-deconsolidation of goods, cargo insurance & compliance, arrangement of warehousing & storage, liasing with shippers, and freight forwarding through other modes of transport viz. road and rail.
- Freight Pricing Trends - Freight pricing by mode of transport (USD/tonkm), over the review period, has been presented in this industry trend. The data has been used in assessing the inflationary environment, impact on trade, freight turnover (tonkm), freight and logistics market demand by mode of transport segments and hence the overall freight and logistics market size.
- Freight Tonnage Trends - Freight tonnage (weight of goods in tons) handled by mode of transport, over the review period, has been presented in this industry trend. The data has been used as one of the parameters apart from average distance per shipment (km), freight volume (tonkm), and freight pricing (USD/tonkm) to assess the freight transport market size.
- Freight Transport - Freight Transport refers to the hiring of a logistics service provider (outsourced logistics) for the transport of commodities (raw materials/final/intermediate/finished goods including both solids and fluids) from the origin to a destination within the country (domestic) or cross-border (international).
- Freight and Logistics - External expenditure on (or outsourced) facilitation of freight transport (freight transportation), arrangement of freight transport through an agent (freight forwarding), warehousing and storage (temperature controlled or non-temperature controlled), CEP (domestic or international courier, express and parcel) and other value-added logistics services involved in the transportation of commodities (raw materials or finished goods including both solids and fluids) from the origin to a destination within the country (domestic) or cross-border (international), through one or more modes of transportation viz. road, rail, sea, air and pipelines constitute freight and logistics market.
- Fuel Price - Fuel price spikes can cause delays and diruption for logistics service providers (LSPs), while drops in the same can result in higher short-term profitability and increased market rivalry to offer consumers with the best deals. Hence, the fuel price variations have been studied over the review period and presented along with the causes as well as market impacts.
- GDP Distribution by Economic Activity - Nominal Gross Domestic Product and distribution of the same, across major economic sectors in the geography studied (country or region as per scope of the report) have been studied and presented in this industry trend. As GDP is positively related to the profitability and growth of logistics industry, this data has been used in adjunction to the input-output tables/ supply-use tables for analyzing the potential major contributing sectors towards the logistics demand.
- GDP Growth by Economic Activity - Growth of Nominal Gross Domestic Product across major economic sectors, for the geography studied (country or region as per scope of the report) have been presented in this industry trend. This data has been utilized for assessing the growth of logistics demand from all the market end users (economic sectors considered here).
- Inflation - Variations in both Wholesale Price Inflation (YoY change in producer price index) and Consumer Price Inflation have been presented in this industry trend. This data has been used to assess the inflationary environment as it plays a vital role in smooth functioning of the supply chain, directly impacting the logistics operational cost components e.g., pricing of tyres, driver wages & benefits, energy/fuel prices, maintenace costs, toll charges, warehousing rents, custom brokerage, forwarding rates, courier rates etc. hence impacting the overall freight and logistics market.
- Infrastructure - As infrastructure plays a vital role in an economy's logistics performance, variables like length of roads, distribution of road length by surface category (paved v/s unpaved), distribution of road length by road classification (expressways v/s highways v/s other roads), rail length, volume of containers handled by major ports and tonnage handled by major airports have been analysed and presented in this industry trend.
- Key Industry Trends - The report section named "Key Industry Trends" include all the key variables/parameters studied to better analyze the market size estimates and forecasts. All the trends have been presented in the form of data points (time series or latest available data points) along with analysis of the paramter in the form of concise market relevant commentary, for the geography studied (country or region as per the scope of report).
- Key Strategic Moves - The action taken by a company to differentiate from its competitor or used as a general strategy is referred to as a key strategic move (KSM). This includes (1) Agreements (2) Expansions (3) Financial Restructuring (4) Mergers and Acquisitions (5) Partnerships, and (6) Product Innovations. Key players (Logistics Service Providers, LSPs) in the market have been shortlisted, their KSM have been studied and presented in this section.
- Liner Shipping Bilateral Connectivity Index - It indicates a country pair's integration level into global liner shipping networks and plays a crucial role in determining bilateral trade, which in turn potentially contributes toward the prosperity of a country and its surrounding region. Hence the major economies connected to the country/ region as per scope of the report, have been analyzed and presented in "Liner Shipping Connectivity" industry trend.
- Liner Shipping Connectivity - This industry trend analyses the state of connectivity to the global shipping networks based on the status of maritime transport sector. It includes the analysis of liner shipping connectivity, bilateral shipping connectivity, and port liner shipping connectivity indices for the geography (country/ region as per scope of the report) over the review period.
- Liner Shipping Connectivity Index - It indicates how well countries are connected to global shipping networks based on the status of their maritime transport sector. It is based on five components of the maritime transport sector: (1) The number of shipping lines servicing a country, (2) The size of the largest vessel used on these services (in TEUs), (3) The number of services connecting a country to the other countries, (4) The total number of vessels deployed in a country, (5) The total capacity of those vessels (in TEUs).
- Logistics Performance - Logistics Performance and Logistics Costs are the backbone of trade, and influences trade costs, making countries compete globally. Logistics performance is influenced by market wide adopted supply chain management strategies, government services, investments & policies, fuel/ energy costs, inflationary environment etc. Hence, in this industry trend, the logistics performance of the geography studied (country/ region as per the scope of report) has been analysed and presented over the review period.
- Major Truck Suppliers - Market share of truck brands is influenced by factors like geographical preferences, portfolio of truck types, truck prices, local production, truck repair & maintenance service peneteration, customer support, technological innovations (like electric vehicles, digitalization, autonomous trucks), fuel efficiency, financing options, annual maintenance costs, availability of substitutes, marketing startegies etc. Hence, the distribution (share % for base year of the study) of truck sales volume for leading truck brands and commentary on current market scenario & market anticipation over the forecast period have been presented in this industry trend.
- Manufacturing - This end user industry segment captures the external (outsourced) logistics expenditure incurred by the Manufacturing industry players. The end user players considered are the establishments primarily engaged in the chemical, mechanical or physical transformation of materials or substances into new products. Logistics Service Providers (LSPs) play a crucial role in maintaining a smooth flow of raw materials across the supply chain, enabling timely delivery of finished goods to distributors or end customers and storing & supplying the raw materials to clients for just-in-time manufacturing.
- Maritime Fleet Load Carrying Capacity - Maritime fleet load carrying capacity depicts the development state of an economy's maritime infrastructure & trade. It is influenced by factors like volume of production, international trade, major end user industries, maritime connectivity, environmental regulations, investments in port infrastructure development, port container cargo handling capacity etc. This industry trend represents the maritime fleet load carrying capacity by type of ship viz. container ships, oil tankers, bulk carriers, general cargo, among other types alongwith the influencing factors for the geography studied (country/ region as per scope of the report), over the review period.
- Modal Share - Freight Modal Share is influenced by factors like modal productivity, government regulations, containerization, distance of shipment, temperature control requirements, type of goods, international trade, terrain, speed of delivery, shipment weight, bulk shipments, etc. Also, modal share by tonnage (tons) and modal share by freight turnover (ton-km) differ as per average distance of shipments, weight of major commodity groups transported in the economy and number of trips. This industry trend represents the distribution of freight transported by mode of transport (tons as well as ton-km), for the study base year.
- Oil and Gas, Mining and Quarrying - This end user industry segment captures the external (outsourced) logistics expenditure incurred by the extraction industry players. The end user players considered are the establishments that extract naturally occurring mineral solids, such as coal and ores; liquid minerals, such as crude petroleum; and gases, such as natural gas. Logistics Service Providers (LSPs) covers entire phases from upstream to downstream and plays a crucial role in the transportation of machinery, drilling equipments, extracted minerals, crude oil & natural gas and refined/ processed products from one place to another.
- Other End Users - Other end user segment captures the external (outsourced) logistics expenditure incurred by the financial services (BFSI), real estate, educational services, healthcare, and professional services (administrative, waste management, legal, architectural, engineering, design, consulting, scientific R&D). Logistics Service Providers (LSPs) plays a crucial role in the reliable movement of supplies and documents to/from these industries such as transporting any equipment or resources required, shipping confidential documents and files, movement of medical goods & supplies (surgical supplies and instruments, including gloves, masks, syringes, equipment) to name a few.
- Other Services - Other Services segment captures revenue earned through (1) Value added services (VAS) for freight transportation by road, rail, air and sea & inland waterways, (2) VAS for marine cargo transportation (operation of terminal facilities such as harbours and piers, operation of waterway locks, navigation, pilotage and berthing activities, lighterage, salvage activities, lighthouse activities, among other miscellaneous support activities), (3) VAS for land freight transportation (operation of terminal facilities such as railway stations, stations for the handling of goods, operation of railroad infrastructure, switching and shunting, towing and road side assistance, liquefaction of gas for transportation purposes, among other miscellaneous support activities), (4) VAS for air cargo transportation (operation of terminal facilities such as airway terminals, airport and air-traffic-control activities, ground service activities on airfields, runway maintenance, inspection/ ferrying/ maintenance/ testing of aircrafts, aircraft fuelling services, among other miscellaneous support activities), (5) VAS for warehousing and storage service (operation of grain silos, general merchandise warehouses, refrigerated warehouses, storage tanks etc., storage of goods in foreign trade zones, blast freezing, crating goods for shipping, packing and preparing goods for shipping, labelling and/or imprinting the package, kit assembling and packaging services, among other miscellaneous support activities), and (6) VAS for courier, express and parcel service (pickup, sorting).
- Port Calls and Performance - The performance of ports is key to an economy's freight movement, trade, global connectivity, successful growth strategies, investment attractiveness for production & distribution systems, and thus affects GDP, employment, per capita income and industrial growth. Hence, the port perfomance parameters like median time spent by vessels in the ports; average age, size, cargo carrying capacity, container carrying capacity, of vessels entering the ports, port calls, and container port throughput have been analysed and presented in this industry trend.
- Port Liner Shipping Connectivity Index - It reflects a port's position in the global liner shipping network, wherein a higher value of index is associated with better connectivity. Efficient and well-connected ports (1) contribute towards minimizing transport costs, linking supply chains and supporting international trade, (2) pave the way for economies of scale and development of expertise by permitting producers to better exploit possibilities in domestic as well as foreign markets. Hence the major ports of strategic importance, in the country/ region as per scope of the report, have been analyzed and presented in "Liner Shipping Connectivity" industry trend.
- Port Throughput - It reflects the amount of cargo or number of vessels a port handles annually. It can be related to (1) cargo tonnage, (2) container TEU, and (3) vessel calls. Port throughput in terms of total containers handled (TEU's), has been presented in the "Port Calls and Performance" industry trend.
- Producer Price Inflation - It indicates inflation from viewpoint of the producers viz. the average selling price received for their output over a period of time. Annual change (YoY) of producer price index is reported as wholesale price inflation in the "Inflation" industry trend. As WPI captures dynamic price movements in most comprehensive way, it is widely used by governments, banks, industry, business circles and is deemed important in formulation of trade, fiscal and other economic policies. The data has been used in adjunction to consumer price inflation for better understanding the inflationary environment.
- Segmental Revenue - Segmental Revenue has been triangulated or computed and presented for all the major players in the market. It refers to the freight and logistics market specific revenue earned by the company, over the base year of study, in the geography studied (country or region as per the scope of report). It is computed through the study and analysis of major parameters like financials, service portfolio, employee strength, fleet size, investments, number of countries present in, major economies of concern, etc. that have been reported by the company in its annual reports, webpage. For companies having scarce financial disclosures, paid databases like D&B Hoovers, Dow Jones Factiva have been resorted to and verified through industry/expert interactions.
- Transport and Storage Sector GDP - Value and growth of Transport and Storage Sector GDP has a direct relation to the freight and logistics market size. Hence, this variable has been studied and presented over the review period, in value terms (USD) and as share % of total GDP, in this industry trend. The data has been supported by concise and relevant commentary around the investments, developments, and current market scenario.
- Trends in E-Commerce Industry - Enhanced internet connectivity and boom in smartphone penetration, coupled with increasing disposable incomes, has led to a phenomenal growth in the e-commerce market globally. Online shoppers require fast and efficient delivery of their orders leading to an increase in the demand for logistics services especially e-commerce fulfilment services. Hence, the Gross Merchandise Value (GMV), historial and projected growth, breakup of major commodity groups in e-commerce industry for the studied geography (country or region as per scope of the report) have been analysed and presented in this industry trend.
- Trends in Manufacturing Industry - Manufacturing industry involves the transformation of raw materials into finished products, while logistics industry ensures the efficient flow of raw materials to the factory, and the transport of manufactured products to the distributors & consumers. Demand-Supply of both industries are highly cross-linked and critical for a seamless supply chain. Hence, the Gross Value Added (GVA), breakup of GVA into major manufacturing sectors, and growth of manufacturing industry over the review period have been analysed and presented, in this industry trend.
- Trucking Fleet Size By Type - Market share of truck types is influenced by factors like geographical preferences, major end user industries, truck prices, local production, truck repair & maintenance service peneteration, customer support, technological disruptions (like electric vehicles, digitalization, autonomous trucks) etc. Hence, the distribution (share % for base year of study) of truck parc volume by type of truck, market disruptors, truck manufacturing investments, truck specifications, truck use & import regulations, and market anticipation over the forecast period have been presented in this industry trend.
- Trucking Operational Costs - The prime reasons for measuring/ benchmarking logistics performance of any trucking company are to reduce operational costs and increase profitability. On the other hand, measuring operational costs helps to identify whether and where to make operational changes to control expenses and identify areas for improved performance. Hence, in this industry trend, trucking operational costs and the variables involved viz. driver wages & benefits, fuel prices, repairs & maintenance costs, tyre costs etc. have been studied over the base year of study, and presented for the geography studied (country or region as per the scope of report).
- Warehousing and Storage - Warehousing and storage segment captures revenue earned through the operation of general merchandise, refrigerated and other types of warehousing & storage facilities. These establishments take responsibility for storing the goods and keeping them secure in lieu of charges. Value added services (VAS) they may provide are considered to be a part of the "other services" segment. Here VAS refer to a range of services, related to the distribution of a customer's goods and can include labelling, breaking bulk, inventory control & management, light assembly, order entry & fulfillment, packaging, pick & pack, price marking & ticketing and transportation arrangement.
- Wholesale and Retail Trade - This end user industry segment captures the external (outsourced) logistics expenditure incurred by the wholesalers and retailers. The end user players considered are the establishments primarily engaged in wholesaling or retailing merchandise, generally without transformation, and rendering services incidental to the sale of merchandise. Logistics Service Providers (LSPs) plays a crucial role in the reliable movement of supplies to and finished products from production houses to the distributors and finally to the end customer covering activites like material sourcing, transportation, order fulfillment, warehousing & storage, demand forecasting, inventory management etc.
| Keyword | Definition |
|---|---|
| Axle Load | The axle load of a wheeled vehicle is the total weight bearing on the roadway for all wheels connected to a given axle. |
| Back Haul | Backhaul is the return movement of a transport vehicle from its original destination to its original point of departure. |
| Bill of Lading | A bill of lading is a legal document issued by a carrier to a shipper that details the type, quantity, and destination of the goods being carried. |
| Bunkering | Bunkering is the process of supplying fuel and/or gasoil to be used to power the propulsion system of a ship (such fuel is referred to as bunker). It includes the logistics of loading and distributing the fuel among available shipboard tanks. A person dealing in trade of bunker (fuel) is called a bunker trader. |
| Bunkering Service | Bunkering service is the supply of a requested quality and quantity of bunkers to a ship. |
| C-commerce | C-commerce (Collaborative commerce) describes electronically enabled business interactions among an enterprise’s internal personnel, business partners and customers throughout a trading community. The trading community could be an industry, industry segment, supply chain or supply chain segment. |
| Cabotage | Transport by a vehicle registered in a country performed on the national territory of another country. |
| Cartage Agent | A ground transportation service that provides pickup and delivery of freight in locations not served directly by an air or ocean carrier. |
| Contract logistics | Contract logistics refers to the outsourcing of resource management tasks by one company to a third-party company specializing in logistical matters, such as transportation, warehousing, and order fulfillment. |
| Courier | A business that is used to send messages, packages, etc. Courier service refers to the fast or quick, door to door pickup and delivery service for goods or documents. It can be local or international. A company that provides such delivery services is called a courier company. A courier company hires people to provide their services. Such a person hired by the courier service company is called a courier. |
| Cross docking | Cross docking is a practice in logistics management that includes unloading incoming delivery vehicles and loading the materials directly into outbound delivery vehicles, omitting traditional warehouse logistical practices and saving time and money. |
| Cross Trade | International transport between two different countries performed by a vehicle registered in a third country. A third country is a country other than the country of loading/embarkation and than the country of unloading/disembarkation. |
| Customs Clearance | The procedures involved in getting cargo released by Customs through designated formalities such as presenting import license/permit, payment of import duties and other required documentations by the nature of the cargo such as FCC or FDA approval. |
| Customs seal | Customs seal means a seal, stamp or any other preventive means affixed by customs officials to ensure the inviolability of goods, commercial means of transport or warehouses. |
| Dangerous Goods | Dangerous goods (or hazardous materials or HAZMAT) include flammable liquids/solids, gases, compressed, liquified, dissolved under pressure, corrosives, oxidising substances, explosive substances and articles, substances, which on contact with water, emit flammable gasses, organic peroxides, toxic substances, infectious substances, radioactive materials, miscellaneous dangerous goods and articles. |
| Direct Shipment | Direct shipment is a method of delivering goods from the supplier or the product owner to the customer directly. In most cases, the customer orders the goods from the product owner. This delivery scheme reduces transportation and storage costs, but requires additional planning and administration. |
| Drayage | A drayage is a form of trucking service that connects the different modes of shipping (intermodal), such as ocean freight or air freight. It’s a short-haul trip that transports goods from one place to another, usually before or after its long-haul shipping process. Drayage trucks move cargo to and from various destinations, such as container ships, storage lots, order fulfillment warehouses, and rail yards. Typically, drayage only transports goods in short distances and operates only in one metropolitan area. It also requires only one trucker in a single shift. |
| Dry Docking | Dry docking is a term used for repairs or when a ship is taken to the service yard. During dry docking, the whole ship is brought to a dry land so that the submerged portions of the hull can be cleaned or inspected. |
| Dry van | A dry van is a type of semi-trailer that's fully enclosed to protect shipments from outside elements. Designed to carry palletized, boxed or loose freight, dry vans aren't temperature-controlled (unlike refrigerated “reefer” units) and can't carry oversized shipments (unlike flatbed trailers). |
| Feedering | Transport service whereby loaded or empty containers in a regional are transferred to a “mother ship” for a long-haul ocean voyage. |
| Final Demand | Final demand includes all types of commodities (goods as well as services) consumed as final use and might include personal consumption, or consumption by government, by businesses as capital investment, and as exports. includes all types of commodities (goods as well as services) consumed as final use and might include personal consumption, or consumption by government, by businesses as capital investment, and as exports. |
| First mile Delivery | First mile delivery refers to the first stage of the transportation. This is when the parcel leaves the seller’s warehouse and is taken by the courier pick up agent to process it or take it to the warehouse. Once the package reaches the post office or the courier’s hub, it is then sorted and transported further until it reaches the customer’s doorstep. |
| Fiscal storage services | It means a facility, clearly separated from other premises, where the excise goods are produced, processed, held, received or dispatched under a duty suspension arrangement by an authorized depositor, in the course of his business, under conditions laid down by the customs authorities. |
| Flat Bed | It has a back body that is flatly shaped for easy loading and unloading of goods. The flatbed truck is mostly used to transport heavy, oversized, wide and indelicate goods. |
| Flatbed Truck | A flatbed truck is a type of truck with rigid design. It has a back body that is flatly shaped for easy loading and unloading of goods. The flatbed truck is mostly used to transport heavy, oversized, wide and indelicate goods such as machinery, building supplies or equipment. Due to the truck open body, the goods transported with it must not be vulnerable to rain. By functionality, the flatbed truck is comparable to a flatbed trailer. |
| Freight Transit Time | Transit time is how long it takes for a shipment to be delivered to its final destination after being picked up from a designated pick up point. |
| Halal Logistics | It refers to the process of managing the logistics operations such as fleet management, storage/warehousing, and materials handling according to the principles of Shariah law in ensuring the integrity of the halal products at the point of consumption. |
| Haulage | The commercial transport of goods. |
| Inbound Logistics | Inbound logistics is the way materials and other goods are brought into a company. This process includes the steps to order, receive, store, transport and manage incoming supplies. Inbound logistics focuses on the supply part of the supply-demand equation. |
| Intermediate Demand | Intermediate demand includes goods, services, and maintenance and repair construction sold to businesses, excluding capital investment. |
| International Loaded | Place of loading of goods in reporting country (i.e., country in which the vehicle performing the transport is registered) and place of unloading in a different country. |
| International Unloaded | Place of unloading of goods in reporting country (i.e., country in which the vehicle performing the transport is registered) and place of loading in a different country. |
| Last Mile Delivery | Last mile delivery refers to the very last step of the delivery process when a parcel is moved from a transportation hub to its final destination—which, usually, is a personal residence or retail store. |
| Less than-Truck-Load (LTL) | Less-than-truckload, also known as less-than-load (LTL), is a shipping service for relatively small loads or quantities of freight. An LTL provider combines the loads and shipping requirements of several different companies on their trucks, using a hub-and-spoke system to get goods to their destinations. |
| Locomotives Haluage | The transport of coal, ore, workers, and materials underground by means of locomotive-hauled mine cars. The locomotive may be powered by battery, diesel, compressed air, trolley, or some combination such as battery-trolley or trolley-cable reel. |
| Milkrun | A Milk Run is a delivery method used to transport mixed loads from various suppliers to one customer. Instead of each supplier sending a truck every week to meet the needs of one customer, one truck (or vehicle) visits the suppliers to pick up the loads for that customer. This method of transport got its name from the dairy industry practice, where one tanker used to collect milk from several dairy farms for delivery to a milk processing company. |
| Multi country consolidation | Multi-Country Consolidation (MCC) is a cost-effective solution that consolidates ones cargo from different countries of origin to build Full Container Loads (FCL). MCC is most suitable for companies that import light volumes of goods from multiple countries but want to take advantage of the more economic FCL freight rates. |
| Multi-Modal Logistics | Multimodal transportation or multimodal shipping refers to logistics and freight processes that require multiple modes of transportation. |
| Omni Channel Logistics | Omnichannel distribution is a multichannel approach taken by companies to give customers a way to purchase and receive orders from several sales channels with one-touch seamless integration. Some of the ways include- 1. Buy online, then pick-up at the brick and mortar store; 2. Buy online, then have it delivered to the home or another location; 3.In store purchase, with the delivery either to the home or another location; 4. Drop ship from a warehouse or manufacturing center to store, home or other location; 5.Buy online, then return at store or online; 6. Buy online, then return online. |
| OOG cargo | Out of Gauge (OOG) cargo is any cargo that can not be loaded into six-sided shipping containers simply because it is too large. The term is a very loose classification of all cargo with dimensions beyond the maximum 40HC container dimensions. That is a length beyond 12.05 meters – a width beyond 2.33 meters – or a height beyond 2.59 meters. |
| Other ships | Other ships include: Liquefied petroleum gas carriers, liquefied natural gas carriers, parcel (chemical) tankers, specialized tankers, reefers, offshore supply vessels, tugboats, dredgers, cruise, ferries, other non-cargo ships |
| Other Specialised Cargo | Other specialised goods include pre-slung goods (Goods, one or more items, supplied with a sling or slings), mobile units (Mobile Self Propelled Units, Non Self Propelled Units, unrolled vehicles), oversized equipment load (light and heavy machinery that is often too big or too heavy), high value freight that needs extra protection like electronics, financial services road freight. |
| Outsourced Freight Transport | Transport for hire or reward; The carriage for remuneration of goods. |
| Pallets | Raised platform, intended to facilitate the lifting and stacking of goods. |
| Part load | A part load describes goods which only fills a truck partially. In essence, the quantity of the shipment is bigger than the Less Than Truckload (LTL) shipment. Also, the shipment cannot fully occupy a truck i.e. its capacity is much lower than a Full Truckload (FTL) shipment. |
| Paved Road | Road surfaced with crushed stone (macadam) with hydrocarbon binder or bituminized agents, with concrete or with cobblestone. |
| Q-commerce | Q-commerce, also referred to as quick commerce, is a type of e-commerce where emphasis is on quick deliveries, typically in less than an hour. |
| Quay | A stone or metal platform lying alongside or projecting into water for loading and unloading ships. |
| Recommerce | Recommerce is the selling of previously owned items through online marketplaces to buyers who reuse, recycle or resell them. |
| ReverseLogistics | Reverse logistics is a type of supply chain management that moves goods from customers back to the sellers or manufacturers. |
| Road Freight Transport Service | Hiring a trucking agency for transport of commodities (raw materials or manufactured goods including both solids and liquids) form the origin to a destination within the country (domestic) or cross-border (international) constitutes road freight transport market. The service might be Full-Truck-Load or Less than-Truck-Load, containerized or non-containerized, temperature controlled or non temperature controlled, short haul or long haul. |
| Roll-on/roll-off cargo | Roll-on/roll-off (RORO or ro-ro) ships are cargo ships designed to carry wheeled cargo, such as cars, motorcycles, trucks, semi-trailer trucks, buses, trailers, and railroad cars, that are driven on and off the ship on their own wheels or using a platform vehicle, such as a self-propelled modular transporter. |
| Swap bodies | A swap body, swop body, exchangeable container or interchangeable unit, is one of the types of standard freight containers for road and rail transport. |
| Tank Barge | A non-self-propelled vessel constructed or adapted primarily to carry liquid, solid or gaseous commodities or cargos in bulk in cargo spaces (or tanks) through rivers and inland waterways, and may occasionally carry commodities or cargos through oceans and seas when in transit from one inland waterway to another. The commodities or cargos transported are in direct contact with the tank interior. |
| Tautliner vehicle | Tautliner and curtainsider are used as generic names for curtain sided trucks/trailers. The curtains are permanently fixed to a runner at the top and detachable rails/poles at front and rear, allowing the curtains to be drawn open and forklifts used all along the sides for easy and efficient loading and unloading. When closed for travel, vertical load restraint straps are attached to a rope rail beneath the truck bed, connecting the truck bed and curtain along both sides. Winches at either end of the curtain tension it, hence the 'Tautliner' name. This stops the curtain from flapping or drumming in the wind and can also help retain light loads from slipping sideways. |
| Transloading | Transloading is a shipping term that refers to the transfer of goods from one mode of transportation to another en route to their ultimate destination. |
| Tsubo | A Japanese unit of area equal to 35.58 square feet. |
| Unpaved Road | Road with a stabilized base not surfaced with crushed stone, hydrocarbon binder or bituminized agents, concrete or cobblestone. |
| Vessel Husbandry Services | It includes ship maintenance, repairs, cleaning, upkeep of the hull and rigging and equipment. |
Need More Details on Market Definition?
Ask a Question
Research Methodology
Mordor Intelligence follows a four-step methodology in all our reports.
- Step-1: Identify Key Variables: In order to build a robust forecasting methodology, the variables and factors identified in Step-1 are tested against available historical market numbers. Through an iterative process, the variables required for market forecast are set and the model is built on the basis of these variables.
- Step-2: Build a Market Model: Market-size estimations for the forecast years are in nominal terms. Inflation is not a part of the pricing, and the average selling price (ASP) is kept constant throughout the forecast period for each country.
- Step-3: Validate and Finalize: In this important step, all market numbers, variables and analyst calls are validated through an extensive network of primary research experts from the market studied. The respondents are selected across levels and functions to generate a holistic picture of the market studied.
- Step-4: Research Outputs: Syndicated Reports, Custom Consulting Assignments, Databases & Subscription Platforms

Get More Details On Research Methodology
Download PDF


