
Market Overview
| Study Period | 2020 - 2031 |
|---|---|
| Forecast Data Period | 2026 - 2031 |
| Base Year Market Size (2025) | USD 2.87 Billion |
| Market Size (2026) | USD 2.96 Billion |
| Market Size (2031) | USD 3.47 Billion |
| Growth Rate (2026 - 2031) | 3.24 % |
| Market Concentration | Medium |
Major Players *Disclaimer: Major Players sorted in no particular order Image © Mordor Intelligence. Reuse requires attribution under CC BY 4.0. | |
South Africa Flexible Packaging Market Analysis by Mordor Intelligence
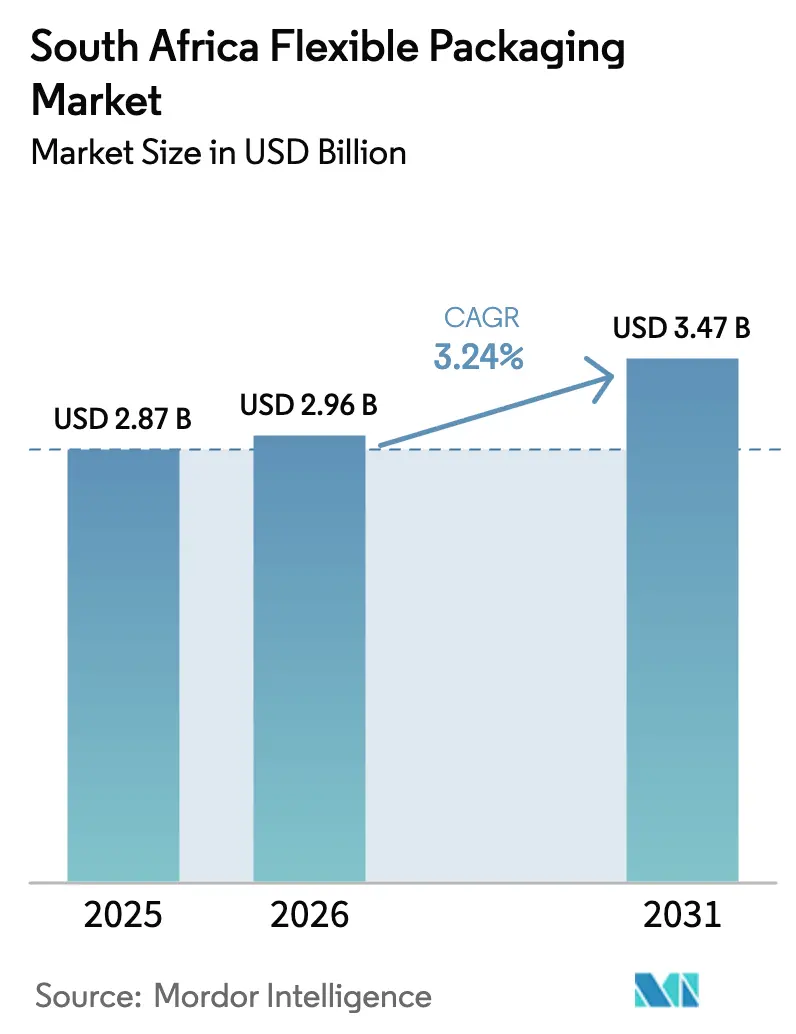
South Africa flexible packaging market size in 2026 is estimated at USD 2.96 billion, growing from 2025 value of USD 2.87 billion with 2031 projections showing USD 3.47 billion, growing at 3.24% CAGR over 2026-2031. The measured growth trajectory reflects a maturing consumer base that increasingly values sustainability, convenience, and digital engagement. Spending growth in food processing, personal care, and e-commerce prompts steady investments in mono-material films, recyclable pouches, and high-definition digital printing. At the same time, Extended Producer Responsibility (EPR) legislation pushes producers toward designs that simplify end-of-life recovery, supporting wider adoption of bioplastics and paper-based laminates. Currency volatility and polymer price swings add cost pressure, yet established converters use long-term supply contracts and lightweight designs to protect margins. Innovation around refill formats and on-the-go portions keeps the South Africa flexible packaging market competitive, even as overall GDP growth remains modest.
Key Report Takeaways
- By material, plastic held 67.55% of South Africa flexible packaging market share in 2025, while bioplastics and compostables are projected to advance at a 5.56% CAGR to 2031.
- By product type, pouches led with 46.62% revenue share in 2025; sachets and stick packs are forecast to expand at a 4.47% CAGR to 2031.
- By end-user industry, food processing captured 30.05% of the South Africa flexible packaging market size in 2025, whereas personal care and cosmetics are advancing at a 4.71% CAGR through 2031.
- By printing technology, flexography commanded 44.58% of the South Africa flexible packaging market size in 2025, while digital printing shows the strongest outlook with a 4.93% CAGR through 2031.
Note: Market size and forecast figures in this report are generated using Mordor Intelligence’s proprietary estimation framework, updated with the latest available data and insights as of 2026.
South Africa Flexible Packaging Market Trends and Insights
Drivers Impact Analysis*
| Driver | (~) % Impact on CAGR Forecast | Geographic Relevance | Impact Timeline |
|---|---|---|---|
| Expansion of e-commerce and demand for convenient packaging | +0.8% | Gauteng, Western Cape | Medium term (2-4 years) |
| Growth of food and beverage processing sector | +0.7% | KwaZulu-Natal, Western Cape | Long term (≥4 years) |
| Rising demand for personal care and cosmetics | +0.6% | Major urban centers | Medium term (2-4 years) |
| Private-label penetration in modern grocery retail | +0.5% | Nationwide | Short term (≤2 years) |
| Mandatory EPR accelerating recyclable materials | +0.4% | Nationwide | Long term (≥4 years) |
| Source: Mordor Intelligence | |||
Expansion of E-commerce and Demand for Convenient Packaging
Rapid growth from 27 million online shoppers in 2022 to a projected 37.9 million in 2027 transforms last-mile logistics and packaging metrics. Return rates close to 40% in online channels versus 5-10% in stores encourage brands to specify durable, resealable pouches that survive reverse flows without secondary packaging. Quick-commerce fulfillment drives demand for lighter formats that cut dimensional weight yet protect high-frequency orders. Subscription services push premium stand-up designs that elevate unboxing and brand storytelling. Amcor’s mono-material refill pouch for L’Oréal cuts resin usage by 75%, showcasing how e-commerce catalyzes flexible formats.
Growth of Food and Beverage Processing Sector
Food service sales reached USD 5.5 billion in 2023 and climbed 27% year-on-year, anchoring baseline demand for portionable, on-the-go wrappers. [1] Township expansion requires low-cost but rugged laminates that endure informal distribution. Health-focused shoppers choose transparent, high-barrier films that showcase clean ingredients. Craft beverages adopt metallized pouches that combine crisp graphics with oxygen protection, while ready-to-eat meals rely on microwave-able lidding that supports convenience dinner occasions.
Rising Demand for Personal Care and Cosmetics
Refill pouches and mono-material sachets dominate new product rollouts as premium beauty brands target sustainability goals without sacrificing aesthetics. Unilever doubled packaging R&D spending to accelerate recyclable stand-up formats and digital color-matching that predicts shade shifts when using recycled content. [2] Spouted pouches for shampoos and lotions appeal to e-commerce buyers seeking leak-proof delivery and sample programs. Metallized films still feature in luxury lines, marrying barrier performance with shimmer effects that lift shelf appeal.
Mandatory EPR Accelerating Recyclable Materials
Since late 2020, EPR rules require producers to finance collection and recycling, prompting a pivot to mono-material polyethylene and polypropylene films that pass recyclability tests. MetPac-SA and Fibre Circle coordinate compliance, giving scale players an advantage over small converters that lack reporting systems. Life-cycle assessments, due within five years of adoption, reinforce design-for-recycling across new launches.
Restraints Impact Analysis*
| Restraint | (~) % Impact on CAGR Forecast | Geographic Relevance | Impact Timeline |
|---|---|---|---|
| Environmental Concerns and Recycling Infrastructure Gaps | -0.6% | National, acute in rural and township areas | Long term (≥ 4 years) |
| Polymer Price Volatility and Rand Fluctuations | -0.4% | National, import-dependent manufacturers most affected | Short term (≤ 2 years) |
| Competition from Rigid and Reusable Packaging | -0.3% | National, premium segments and industrial applications | Medium term (2-4 years) |
| Low Adoption of Advanced Barrier-Film Recycling Tech | -0.2% | National, limited by capital investment requirements | Long term (≥ 4 years) |
| Source: Mordor Intelligence | |||
Environmental Concerns and Recycling Infrastructure Gaps
Flexible films often escape curbside systems because multi-layer laminates are hard to sort, so households question recyclability claims, especially outside main metros. The result is higher landfill leakage that weighs on brand reputation. Agglomeration technologies for dirty film waste remain scarce and capital intensive, constraining collection pilots and local upcycling ventures.
Polymer Price Volatility and Rand Fluctuations
With most resin grades imported, converters face twin shocks from oil-linked feedstock prices and currency swings. Middle-East oversupply depresses polyethylene values but also destabilizes contracts, while the Rand’s sharp moves undermine hedging for SMEs. Tight credit terms then squeeze working capital, exposing firms with fixed-price FMCG contracts to margin erosion.
*Our forecasts treat driver/restraint impacts as directional, not additive. The impact forecasts reflect baseline growth, mix effects, and variable interactions.
Segment Analysis
By Material: Plastic Maintains Scale Leadership Amid Bio-Shift
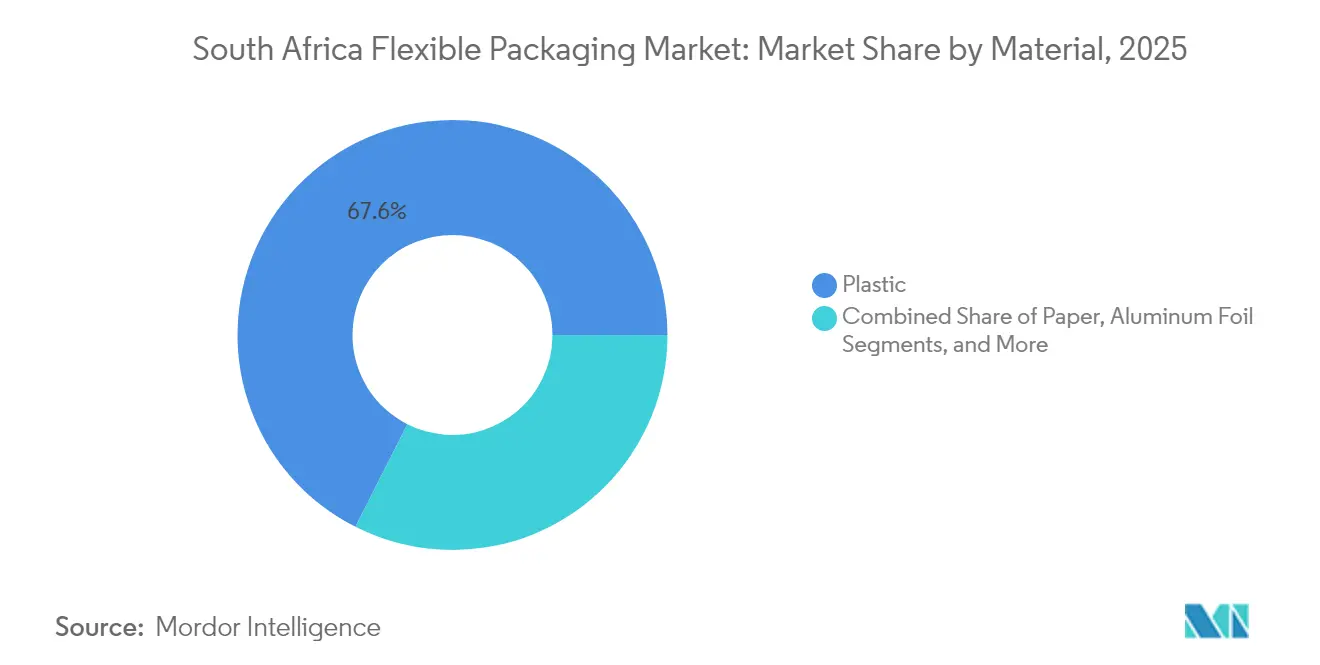
Plastic accounted for 67.55% of the South Africa flexible packaging market in 2025 thanks to the proven cost-to-performance ratio of polyethylene and bi-oriented polypropylene. The segment continues to dominate mass food, beverage, and household applications because converters already own optimized extrusion and print assets. Yet the South Africa flexible packaging market size tied to bioplastics and compostables is projected to grow 5.56% annually through 2031, sustained by EPR scorecards and retailer pledges. Paper-based laminates attract brands seeking curbside-ready claims and lower carbon footprints, while foil remains the go-to for moisture-sensitive dairy and pharma SKUs. Over the outlook, global suppliers like Mondi are scaling hybrid paper-plastic designs that meet toughness targets without compromising recycling.
Rising mono-material demand drives film makers to invest in high-density PE lines that deliver stiffness and heat resistance without complex barrier tie layers. Local polymer modifiers now offer compatibilizers that ease mechanical recycling, expanding feedstock for domestic film re-extrusion. As the South Africa flexible packaging market aligns with circular metrics, converters tout cradle-to-cradle certifications to win premium tenders, limiting share loss to rigid alternatives.

By Product Type: Pouches Sustain Leadership, Sachets Accelerate
Pouches held 46.62% share of the South Africa flexible packaging market in 2025 due to their billboard display, reseal features, and low shipping weight. High-definition digital print extends shelf impact and supports seasonal graphics, while laser-scored tear openings improve consumer convenience. Sachets and stick packs, forecast to rise 4.47% per year, meet urban single-serve snacking and rural affordability. They also underpin influencer sampling campaigns that depend on low-cost distribution.
Films and wraps protect fresh produce, dairy, and food-service wraps that must stay transparent for quality inspection. Bags and sacks address bulk fertilizers and construction additives needing puncture resistance, whereas lidding films secure ready-meal trays. The South Africa flexible packaging market share for label sleeves benefits from craft beverage brands that target differentiation via contour wraps compatible with shrink tunnels.
By End-User Industry: Food Dominates, Personal Care Gains Speed
Food processing captured 30.05% of the South Africa flexible packaging market size in 2025 because snacks, baked goods, and meat categories rely on oxygen and moisture barriers that delay spoilage. Volume players such as Tiger Brands trigger large order runs that maximize flexographic economies. Personal care packaging, advancing at 4.71% CAGR, pivots on refill pouches and luxury sachets filled with serums, gels, and hair masks marketed online.
Beverage up-trading supports metallized or paper-based solutions for premium craft beers, while healthcare lines adopt high-barrier laminates certified for pharmacopoeia compliance. Chemical and industrial drums increasingly specify multi-layer liners that prevent contamination and facilitate reuse. These niche requirements shave the South Africa flexible packaging market into many micro-opportunities where specialty converters earn resilient margins.

By Printing Technology: Flexography Holds Scale, Digital Rises
Flexography owned 44.58% of the South Africa flexible packaging market in 2025, favored for large SKUs where plate costs amortize fast. Eight-color CI presses now deliver photo-realistic graphics that once required rotogravure. Still, digital presses show the steepest growth at 4.93% CAGR by enabling SKU proliferation, regional promotions, and serialized QR codes without plates.
Hybrid press investments, pairing inkjet units with flexo decks, give converters a path to variable data alongside high-speed solids. Rotogravure remains viable for overwraps and long-run condiment sachets but suffers from cylinder lead times. Screen and cold-foil units serve narrow tactile effects on prestige cosmetic pouches. Converters that blend digital workflows with EPR-compliant inks position themselves as first-choice partners for agile brand owners, reinforcing a smoother South Africa flexible packaging market evolution.
Geography Analysis
Gauteng and Western Cape account for more than half of national output because these provinces cluster head-office decision makers, modern retail, and export-oriented food factories. Household consumption rose 2.3% year-on-year in Q4 2024, supporting retail pack volumes despite a 3.2% contraction in wider manufacturing. KwaZulu-Natal leverages port access to import resins and export packaged foods across the Southern African Development Community, while Eastern Cape’s automotive corridor drives demand for industrial liners and component wraps.
Rural provinces lag on recycling infrastructure, but township markets buy significant sachet volumes due to low unit pricing. National EPR frameworks create uniform compliance, allowing converters to pool post-consumer film waste from multiple cities for re-processing. Cape Town’s circular-economy pilot showcases how branded drop-off points increase film collection rates, offering a template for roll-out elsewhere.
South Africa’s customs union links enable local converters to serve Namibia, Botswana, and Eswatini without additional tariffs, augmenting export orders that fill spare capacity. Nevertheless, cross-border sales face currency misalignment and logistics bottlenecks that encourage warehousing near main highways. This regional gateways strategy limits shipment distances and buffers the South Africa flexible packaging market against domestic macro-volatility.
Regulatory Landscape
South Africa's flexible packaging regulations are anchored by the National Environmental Management: Waste Act (NEMWA) and the Extended Producer Responsibility (EPR) regime introduced via GN R.1184 (2020). The framework requires obligated producers of packaging to register, pay fees, and meet recycling and recovery obligations through an approved Producer Responsibility Organization (PRO) or a self-run scheme. In practice, compliance has strengthened the role of sector PROs and industry bodies such as Packaging SA, and it has pushed brand owners and converters to document material choices, reporting, and end-of-life pathways as part of tender and customer qualification.
Policy direction is also reinforced through design-for-recyclability guidance, including the DFFE's Recyclability by Design guidelines (published in 2023), which steer packaging toward structures that are easier to collect, sort, and recycle. At the strategic level, the draft National Waste Management Strategy (NWMS) 2026, gazetted in December 2025, provides a current reference point for how waste prevention, collection, and recycling priorities will be organized across the economy, shaping how flexible packaging specifications align with recyclability and reporting expectations.
Value Chain Analysis
The value chain for flexible packaging in South Africa begins with upstream resin and substrate supply, including polyethylene and polypropylene resins, additives, and barrier substrates. Converters are exposed to import reliance for key inputs and to logistics and currency volatility when sourcing polymers and specialty materials. Converting activity is concentrated around major industrial corridors, with Gauteng operating as a central production and distribution hub, and coastal logistics nodes supporting inbound materials and outbound finished packs for FMCG and industrial customers.
Midstream players include film extruders, laminators, printers (flexography and a growing set of digital press users), and pouch and sachet converters serving food, beverage, personal care, and industrial and chemical end users. Downstream, EPR-linked collection and recycling systems, implemented through PROs and coordinated industry initiatives, increasingly connect brand owners, retailers, and waste-management partners. This has raised the importance of traceability, recyclable-structure selection (mono-material where feasible), and access to suitable recycled feedstock for converters that offer PCR-enabled formats.
Competitive Landscape
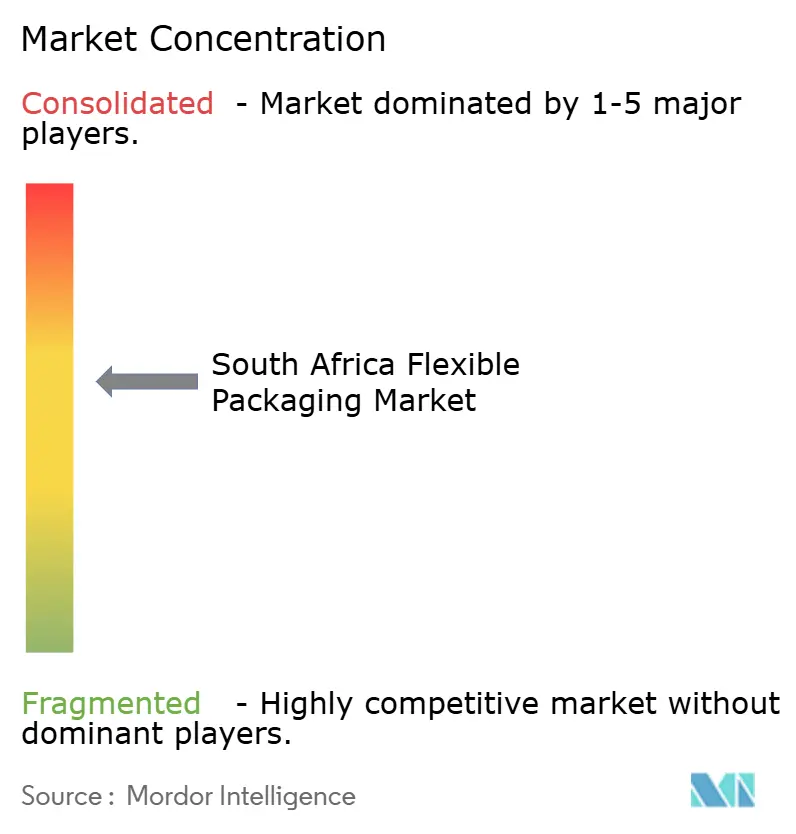
The competitive field mixes local majors and globally backed entrants, creating a moderately concentrated arena with room for specialist players. Nampak trimmed non-core plastics assets worth R2.7 billion (USD 149 million) in 2024 to focus on beverage cans and diversified packaging, channeling capex into can-line debottlenecking. [4] Mpact’s 2024 revenue reached R10 billion (USD 553 million), reflecting improved board-mill efficiencies and selective acquisitions that deepen vertical integration.
Global players such as Amcor, Mondi, and Mauser Packaging build scale through partnerships that supply recycled content, sustainable papers, and industrial drums. Amcor’s tie-up with Kolon Industries develops chemically recycled polyester that meets food-grade specs, while Mondi’s Štětí expansion lifts kraft paper capacity, enabling dual sourcing for paper-based pouches.
Digital capabilities now separate incumbents: converters installing HP Indigo or Xeikon presses pitch hyper-short runs to niche cosmetics labels, capturing value pockets overlooked by legacy flexo houses. Compliance strength around EPR data reporting also influences tender awards as brand owners seek low-risk suppliers. As these factors converge, the South Africa flexible packaging market gravitates toward multi-plant groups that marry R&D depth, asset breadth, and circular-economy credentials.
South Africa Flexible Packaging Industry Leaders
-
Amcor plc
-
Mondi plc
-
Constantia Flexibles Group GmbH
-
Huhtamaki Oyj
-
Sonoco Products Company
- *Disclaimer: Major Players sorted in no particular order
Market Opportunities and Future Outlook
EPR compliance and the DFFE's 2023 Recyclability by Design guidance create clear whitespace for converters that can shift multi-material laminates toward mono-material PE or PP structures, simplify inks and adhesives for recyclability, and provide documentation that supports producer reporting through PRO schemes. This aligns with the market's visible pivot toward recyclable and lightweight formats in high-volume categories, including pouches (46.62% share in 2025) and the accelerating sachets and stick packs segment, where design changes can materially affect collection and sorting outcomes.
Circular models, including refill-at-home and return-from-home formats, offer a practical pathway for brand owners in personal care and household categories to reduce virgin resin usage while maintaining performance and convenience. South Africa's expanding e-commerce shopper base and higher return flows in online channels also support demand for durable, resealable flexible packs and secondary-packaging minimization. That supports opportunities in upgraded seal integrity and puncture resistance films, alongside digital print-enabled SKU proliferation for modern retail and direct-to-consumer programs. Industry collaboration with Packaging SA and PRO-led initiatives also provides a route for pilots that link design changes to collection and recycling outcomes, which can be scaled by converters with established reporting capability and stable access to recycled content.
Recent Industry Developments
- July 2026: Coleus Packaging disclosed a ZAR 200 million investment made over the prior three and a half years to upgrade production technology at its South African facilities. The upgrades signal continued capacity and capability strengthening by local converters as customers demand higher performance structures and more sustainable pack formats. Increased modernization in converting capability also raises competitive pressure on smaller players that do not have similar capex headroom.
- June 2026: Mpact permanently shut down the BM6 coated carton board machine at its Springs Mill, citing sustained pressure from low-cost imports. The closure tightens domestic supply of certain board grades and increases reliance on imports or substitution, which can influence downstream packaging procurement strategies and lead times. It also heightens the importance of cost and supply-chain resilience across packaging material choices.
- April 2026: Wyda Packaging completed the acquisition of operational assets from Hulamin Containers, adding 17 presses and more than 200 moulds to expand aluminum packaging manufacturing capability. While centered on rigid packaging, the move strengthens local packaging manufacturing depth and can affect total packaging spend allocation and supplier consolidation behavior among FMCG and industrial buyers. Broader local capacity additions in adjacent packaging formats can also intensify competition for shared customers and operational resources.
Research Methodology Framework and Report Scope
Market Definition and Coverage
For this study, the market covers flexible packaging sold in South Africa, measured as the value of packs and packaging materials supplied to end users for packing and protection.
Scope exclusions: We exclude rigid packaging formats and packaging machinery, and we also exclude logistics services linked to packaging distribution.
Segmentation Overview
- By Material
- Plastic
- Polyethylene (PE)
- Bi-Oriented Polypropylene (BOPP)
- Cast Polypropylene (CPP)
- Polyvinyl Chloride (PVC)
- Other Plastics
- Paper
- Aluminum Foil
- Bioplastics/Compostable
- Other Materials
- Plastic
- By Product Type
- Pouches
- Bags and Sacks
- Films and Wraps
- Sachets and Stick Packs
- Labels and Sleeves
- Lidding and Seals
- By End-User Industry
- Food
- Baked Goods
- Snacks
- Meat, Poultry and Seafood
- Confectionery
- Pet Food
- Other Food Products
- Beverage
- Healthcare and Pharmaceutical
- Personal Care and Cosmetics
- Industrial and Chemical
- Other End-User Industries
- Food
- By Printing Technology
- Flexography
- Rotogravure
- Digital
- Other Printing Technologies
Data Sources, Market Sizing, and Validation
Desk Research
Desk research started with mapping demand-side anchors, so that the model reflects what is actually being packaged in the country. We reviewed public sources such as Statistics South Africa manufacturing and CPI releases, South African Revenue Service trade statistics (imports and exports), and industry bodies such as Plastics SA and Packaging SA for context on materials, recovery, and consumption patterns.
We then cross-checked supply-side signals from converter and resin-linked disclosures, using items like annual reports, investor presentations, and reputable press coverage to understand pricing pass-through and capacity trends. Select paid subscriptions were used only for company financials and intelligence, patent tracking, and shipment-level import-export checks, which helped us reduce gaps when public data was not granular. The desk sources mentioned above are illustrative and not exhaustive, and other references were also used for data collection, validation, and clarification.
Primary Interviews and Surveys
Primary work focused on validating real selling prices and mix shifts (for example, film versus pouch demand and the move toward recyclable structures), along with buyer-side procurement behavior in food, beverage, home care, and personal care. We also spoke with participants across the value chain such as material suppliers, converters, printers, and distributors, and the discussions were kept South Africa specific to reflect local regulations and cost pressures.
Distribution of primary research fieldwork respondents
| Company type | Respondent position |
|---|---|
| Top tier: 35% | CXOs: 13% |
| Mid tier: 45% | Functional/Unit leaders: 29% |
| Smaller Players: 20% | Managers: 58% |
Market-Sizing & Forecasting
The core sizing logic used a top-down build that reconstructs flexible packaging demand from packaged goods output, trade flows for key materials, and observed packaging intensity by end-use, before values are converted through practical price points. To keep the totals realistic, we then corroborated them with selective bottom-up approximations, such as sampled converter revenues, channel checks on film and laminate selling prices, and volume-to-value conversions using typical gauge and yield assumptions.
A few inputs that mattered most were polymer and paper price movements, local food and beverage production trends, import penetration of films and laminates, lightweighting rates, and the share of packaged consumption in fast-moving categories. Where direct volume indicators were missing for a niche format, gaps were handled using proxy indicators (like related packaged output growth) and then adjusted through interview feedback. Forecasts were built using scenario analysis, where GDP-linked consumption, resin cost cycles, and regulatory pressure on recyclability were stress-tested and then aligned to the most common expectation shared by primary respondents.
Data Validation & Update Cycle
Model outputs were checked against independent signals such as packaging material imports, packaged goods production movements, and price trend lines that can explain year-to-year value changes. If an implied growth step looked too large for the underlying demand or too small given cost inflation, the assumptions were revisited and, when needed, experts were re-contacted for a second confirmation.
Before sign-off, the work goes through multi-step analyst reviews, including variance checks across end-use totals and consistency checks between volume and pricing logic. Reports are refreshed annually, and interim updates are made if a material event changes pricing, regulation, or end-market demand. Right before delivery, an analyst performs a final data pass so clients receive the latest updated view.
Mordor Intelligence's South Africa Flexible Packaging Market Estimate Compared With Other Published Estimates
Published market values for flexible packaging in South Africa often do not match because each publisher draws the market boundary differently and then uses different price and volume proxies to reach a total. The year chosen as the base, the currency conversion timing, and how inflation is treated can also move the number up or down.
Customs import-export signals for films and laminates, along with local packaged food production indicators, are the evidence checks that keep Mordor Intelligence's estimate tied to flexible packs supplied into South African end-use demand, rather than broader converted packaging revenue pools that can include labels and other adjacent converted items. Differences in assumed average selling prices, especially during resin price swings, also create gaps when price refresh steps are not aligned to the same timing or product mix.
Benchmark comparison
| Source | Market Size | Gaps in Research Methodology |
|---|---|---|
| Mordor Intelligence | USD 2.87 B (2025) | |
| Industry Portal A | USD 7.75 B (2024) | Uses a broader "converted flexible packaging" scope that can include multiple converted items and adjacent packaging components, which inflates totals versus flexible packaging supplied to end users in South Africa. |
| Trade Brief B | USD 3.25 B (2023) | Often derived by applying a flexible share to an all-packaging pool and then projecting with headline inflation, which can miss mix shifts like downgauging and changes in laminate structure demand. |
The comparison shows that the spread mainly comes from scope definitions and how prices are refreshed during resin and paper cost cycles. By keeping inclusions tied to flexible packs sold into South African end-use demand, and by cross-checking values against trade and production signals, the estimate stays transparent and repeatable for planning use cases.
Key Questions Answered in the Report
What is the current value of the South Africa flexible packaging market?
The market is valued at USD 2.96 billion in 2026 and is projected to reach USD 3.47 billion by 2031.
How fast is demand for sustainable materials growing?
Bioplastics and compostable formats are forecast to expand at a 5.56% CAGR through 2031, significantly outpacing traditional plastics.
Which product type leads sales in flexible packaging?
Pouches hold 46.62% revenue share, driven by their light weight, reseal features, and strong shelf appeal.
Which end-user segment is advancing the quickest?
Personal care and cosmetics are growing at a 4.71% CAGR as refill systems and e-commerce sampling boost volume.
How will EPR regulations influence packaging design?
Producers must fund collection and recycling, so many new launches now favor mono-material PE or PP films that can be mechanically recycled.
What printing technology is gaining momentum?
Digital printing shows the highest growth, with a 4.93% CAGR, because it supports short runs, personalization, and rapid product launches.