Market Overview
| Study Period | 2019 - 2030 |
|---|---|
| Base Year For Estimation | 2024 |
| Forecast Data Period | 2025 - 2030 |
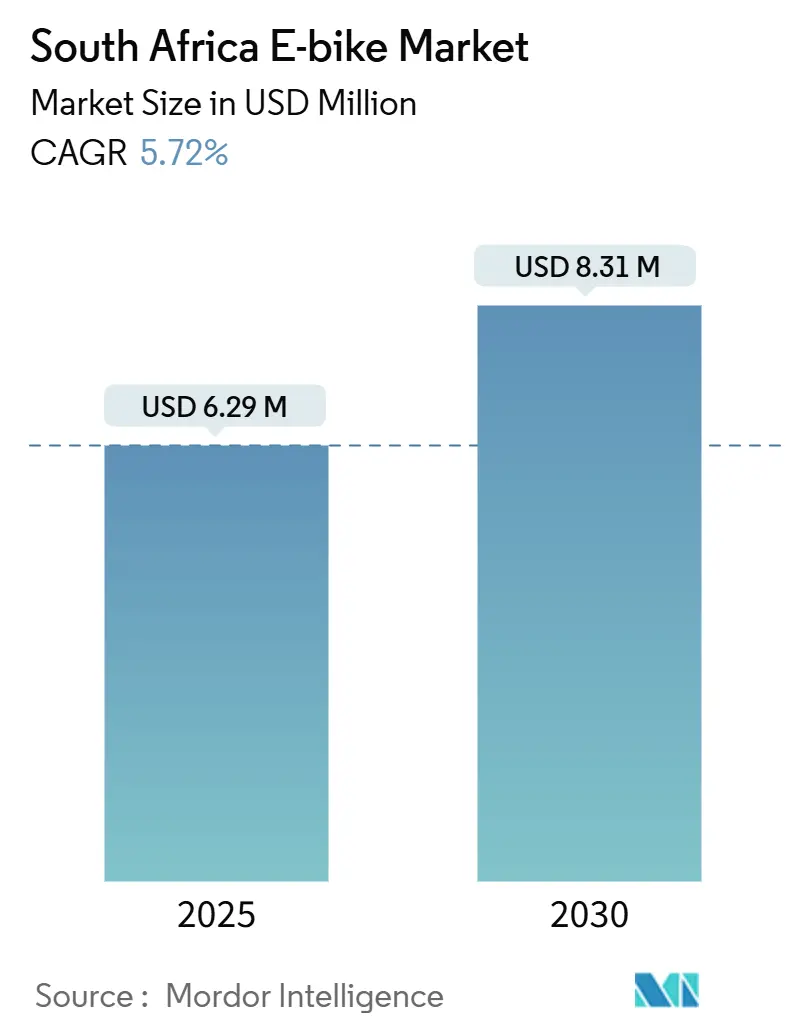
| Market Size (2025) | USD 6.29 Million |
| Market Size (2030) | USD 8.31 Million |
| Growth Rate (2025 - 2030) | 5.72% CAGR |
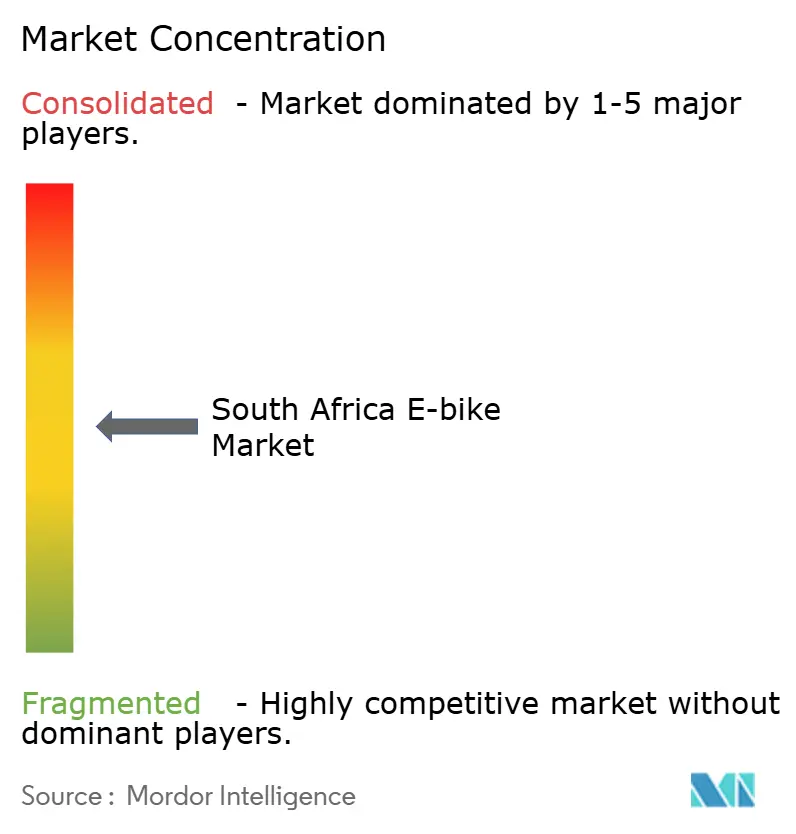
| Market Concentration | Medium |
Major Players
*Disclaimer: Major Players sorted in no particular order Image © Mordor Intelligence. Reuse requires attribution under CC BY 4.0. |
|
South Africa E-bike Market Analysis by Mordor Intelligence
The South African e-bike market size stood at USD 6.29 million in 2025 and is forecast to reach USD 8.31 million by 2030, registering a 5.72% CAGR over the period. Rising fuel prices, grid-independent charging hubs, and corporate fleet decarbonization mandates combine to reinforce steady demand across both consumer and commercial segments. Lithium-ion battery cost declines open the premium end of the price spectrum, while government rebates on locally assembled light electric vehicles lower entry barriers for volume buyers.
Key Report Takeaways
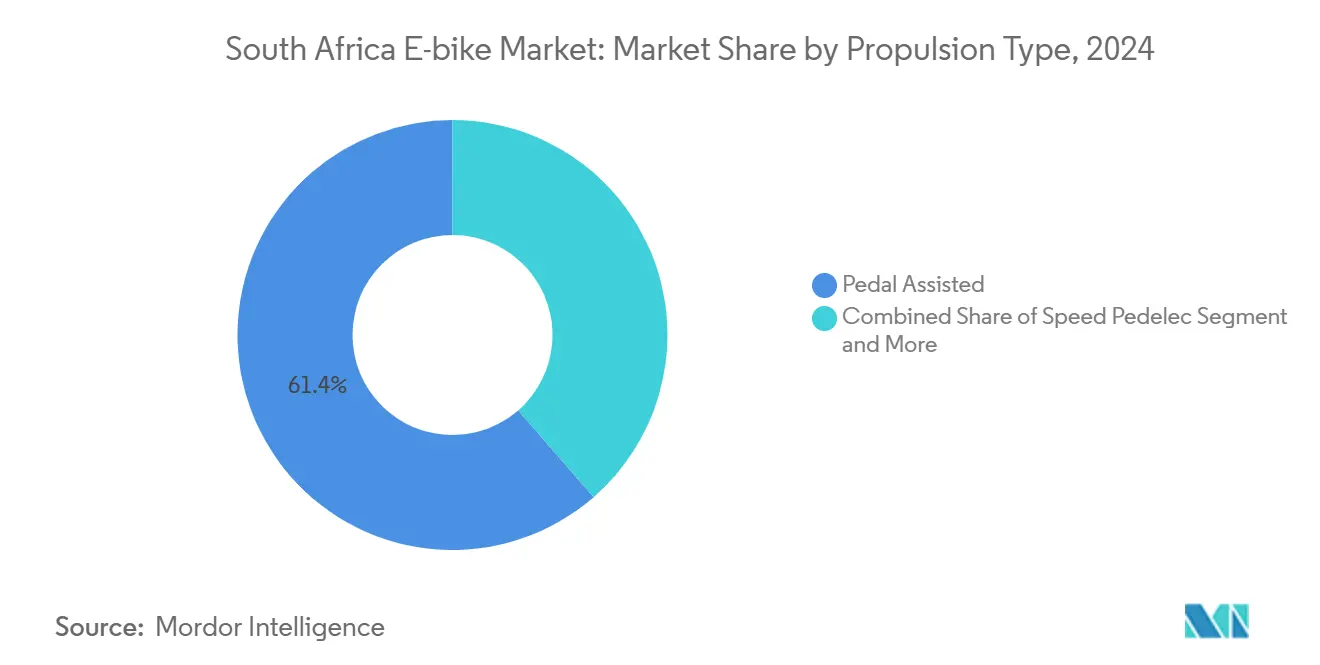
- By propulsion type, pedal assisted systems held 61.38% of the South African e-bike market share in 2024, while speed pedelec models are projected to grow at an 18.27% CAGR through 2030.
- By application, city/urban usage commanded 53.42% of the South African e-bike market size in 2024; cargo/utility is advancing at a 21.36% CAGR between 2025 and 2030.
- By battery chemistry, lithium-ion accounted for 88.24% of revenue in 2024 and is forecast to post a 19.18% CAGR during the forecast period.
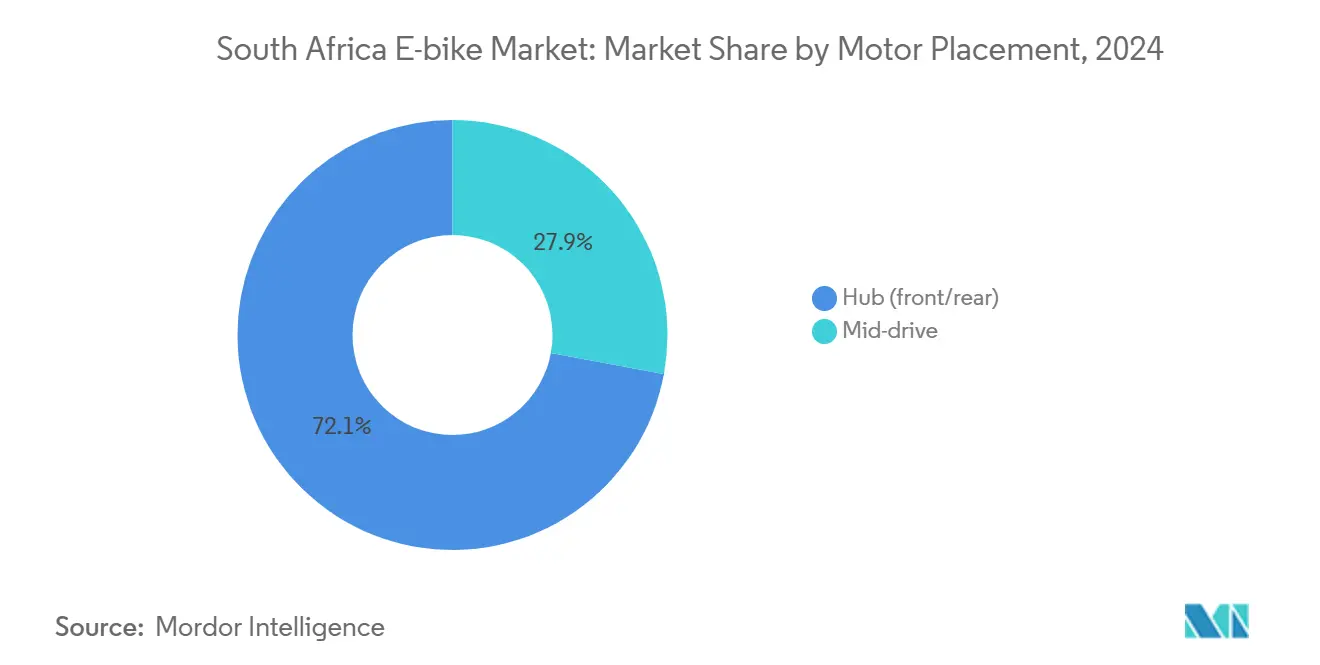
- By motor placement, hub units retained a 72.15% share in 2024, whereas mid-drive solutions led growth at a 22.73% CAGR during the forecast period.
- By drive system, chain drives dominated with 84.67% share in 2024; belt drives are set to expand at 20.32% CAGR to 2030.
- By motor power, sub-250 W models held 55.41% share in 2024, while the 351 to 500 W range is poised to achieve a 24.58% CAGR through 2030.
- By price band, the USD 1,500 to 2,499 bracket captured 31.26% of sales in 2024; the USD 2,500 to 3,499 tier is growing fastest at 17.87% CAGR.
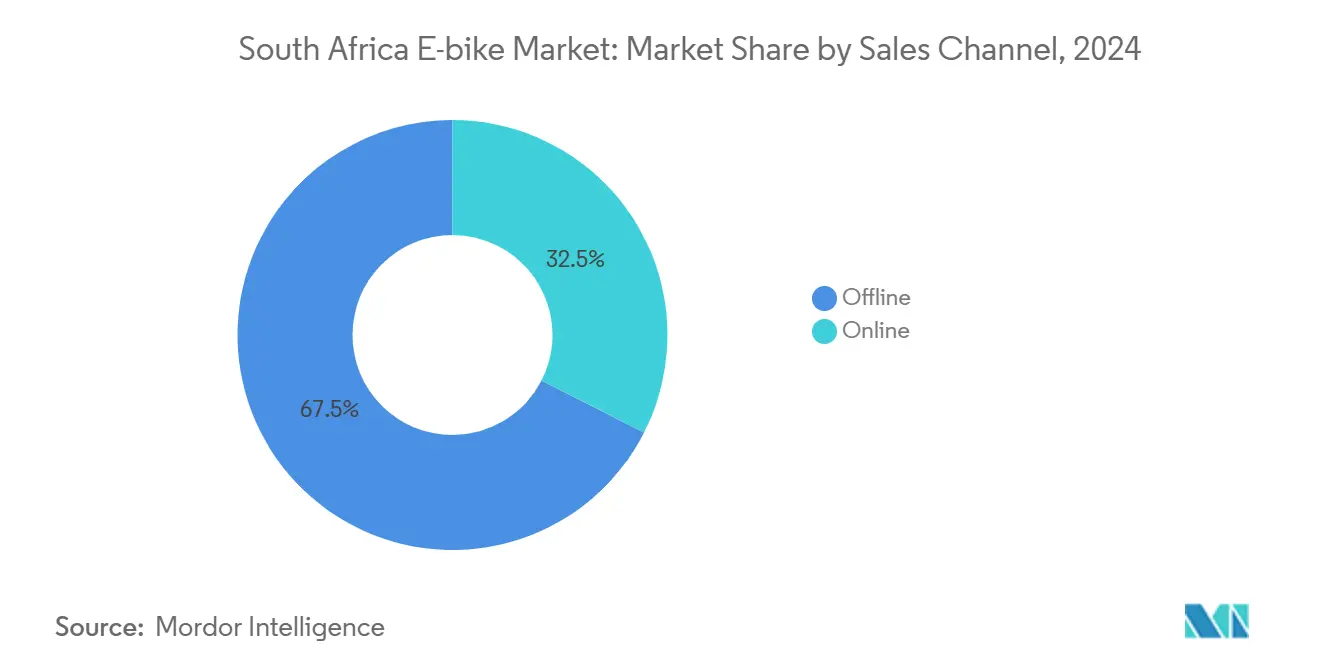
- By sales channel, offline retail retained 67.48% share in 2024, while online platforms are rising at a 23.09% CAGR through 2030.
- By end use, Personal and Family accounts for 49.37% of demand in 2024, whereas Commercial Delivery – Retail and Goods are poised to register the strongest 26.24% CAGR over the forecast period.
South Africa E-bike Market Trends and Insights
Drivers Impact Analysis
| Driver | (~) % Impact on CAGR Forecast | Geographic Relevance | Impact Timeline |
|---|---|---|---|
| Attractive Total-Cost-of-Ownership | +1.2% | National, with early gains in Gauteng, Western Cape | Medium term (2–4 years) |
| Rapid Expansion of "Load-Shedding-Proof" | +1.1% | National, concentrated in urban centers | Short term (≤ 2 years) |
| Corporate Demand for Zero-Emission Delivery Fleets | +0.9% | Gauteng, Western Cape, KwaZulu-Natal | Medium term (2–4 years) |
| Government Rebate on Locally Assembled Light Electric Vehicles | +0.8% | National | Short term (≤ 2 years) |
| Tourism Boards Promoting E-Bike-Based Eco-Safaris | +0.7% | Western Cape, Eastern Cape, Limpopo | Long term (≥ 4 years) |
| Venture-Capital Inflows into Subscription and Leasing Start-Ups | +0.5% | Gauteng, Western Cape | Medium term (2–4 years) |
| Source: Mordor Intelligence | |||
Attractive Total-Cost-of-Ownership versus ICE Two-Wheelers
Corporate fleet operators increasingly recognize e-bikes' superior economics compared to internal combustion engine alternatives, particularly in urban delivery applications where stop-start patterns favor electric powertrains. SPAR Group's partnership with Green Riders demonstrates this shift, with the retailer deploying e-bike fleets for last-mile grocery delivery across multiple South African cities[1]"The SPAR Group introduces SPAR2U ‘green fleet’ for sustainable online deliveries," greeneconomy.media.. Maintenance cost advantages become pronounced in South African conditions, where dust and altitude variations stress conventional engines more severely than electric systems. The total cost equation tilts further toward e-bikes when factoring in fuel price volatility and the rand's susceptibility to commodity market fluctuations.
Rapid Expansion of "Load-Shedding-Proof" Micro-Mobility Charging Hubs
Load-shedding disruptions have catalyzed innovative charging infrastructure that operates independently of Eskom's grid reliability challenges[2]"Charging the Future: How South Africa’s Petrol Stations Are Becoming Green Mobility Hubs," ECO MZANSI, ecomzansi.co.za.. These hubs integrate solar panels, battery storage, and smart charging algorithms to maintain service continuity during power outages, addressing a critical barrier to e-bike adoption. The infrastructure model proves particularly valuable for commercial operators who cannot afford delivery interruptions due to grid instability. Charging hub operators report 85% uptime during Stage 6 load-shedding periods, compared to 40% for conventional grid-dependent stations. This reliability premium justifies higher charging fees while expanding market accessibility for users lacking home charging capabilities.
Corporate Demand for Zero-Emission Delivery Fleets
Multinational corporations operating in South Africa face increasing pressure to demonstrate environmental stewardship while managing delivery cost inflation. Takealot's pilot programs with e-bike delivery partners reflect this dual imperative, combining carbon footprint reduction with operational efficiency gains in congested urban areas[3]"Takealot saddles up for township deliveries," BusinessDay, businessday.co.za.. The regulatory landscape supports this transition through municipal bylaws that provide preferential access for zero-emission vehicles in city centers and business districts. Corporate sustainability reporting requirements under King IV governance principles further accelerate adoption as companies seek measurable emissions reductions. Delivery density economics favor e-bikes in South African metros where traffic congestion imposes significant time penalties on larger vehicles.
Government Rebate on Locally Assembled Light Electric Vehicles
The 2025 Budget introduces targeted rebates for locally assembled light electric vehicles, complementing existing manufacturing incentives to create comprehensive policy support for domestic e-bike production. This framework addresses the 15% import duty burden on complete e-bike units while encouraging local assembly operations that can qualify for rebate programs. Local assembly requirements create opportunities for South African manufacturers to capture value-added production stages while reducing end-user costs through rebate pass-through mechanisms. The policy design specifically targets light electric vehicles under 350kg, encompassing most e-bike categories and creating clear regulatory pathways for market expansion. Compliance with UN R22 helmet standards and National Road Traffic Act provisions ensures safety framework alignment with incentive structures.
Restraints Impact Analysis
| Restraint | (~) % Impact on CAGR Forecast | Geographic Relevance | Impact Timeline |
|---|---|---|---|
| Limited Domestic Lithium-Ion Cell Manufacturing | −0.8% | National | Long term (≥ 4 years) |
| High Import Tariffs on Mid-Drive Motors | −0.6% | National | Medium term (2–4 years) |
| Persistent Cable-Theft Disrupting Rail-Freight | −0.4% | National, concentrated in Gauteng–KwaZulu-Natal Corridor | Short term (≤ 2 years) |
| Safety Concerns Due to Minimally Enforced Helmet Regulations | −0.3% | National, urban centers | Medium term (2–4 years) |
| Source: Mordor Intelligence | |||
Limited Domestic Lithium-Ion Cell Manufacturing
South Africa's dependence on imported lithium-ion cells creates supply chain vulnerabilities and cost pressures that constrain market expansion potential. The absence of domestic cell production facilities forces manufacturers to rely on Asian suppliers, exposing them to currency fluctuation risks and extended lead times that complicate inventory management. Import duties on battery components add 15% to landed costs, while shipping delays during global supply chain disruptions can extend procurement cycles by 8-12 weeks. Local assembly operations like STROOM must maintain higher inventory buffers to mitigate supply risks, increasing working capital requirements and reducing operational flexibility. The constraint becomes more pronounced as market growth accelerates demand beyond current import infrastructure capacity.
High Import Tariffs on Mid-Drive Motors
Import tariffs on mid-drive motor systems create cost disadvantages for premium e-bike segments that rely on these performance-oriented components. The 15% duty structure particularly impacts the fastest-growing motor placement category, but it faces higher landed costs than hub motor alternatives. This tariff burden forces manufacturers to choose between margin compression and end-user price increases, both of which constrain market expansion velocity. Premium brands like Trek and Specialized must absorb tariff costs to maintain competitive positioning, reducing profitability on mid-drive equipped models. The constraint creates market distortions that favor hub motor configurations despite consumer preference trends toward mid-drive performance characteristics.
Segment Analysis
By Propulsion Type: Speed Pedelecs Drive Premium Growth
Pedal Assisted systems maintain a 61.38% market share in 2024, while Speed Pedelec technology captures the fastest growth trajectory at an 18.27% CAGR (2025–2030). This divergence reflects market bifurcation between mainstream adoption and performance-oriented segments seeking higher speed capabilities for longer commutes and recreational applications. Speed Pedelecs' ability to reach 45 km/h makes them viable alternatives to motorcycles and cars for medium-distance urban travel, particularly appealing to professionals navigating Johannesburg and Cape Town's sprawling metropolitan areas. Throttle-assisted systems serve niche applications where pedaling assistance proves insufficient, such as cargo delivery and mobility-impaired users.
Regulatory frameworks under the National Road Traffic Act classify power-assisted pedal cycles differently based on motor output and speed capabilities, creating distinct market segments with varying compliance requirements. Speed Pedelecs require registration and licensing similar to motorcycles, adding administrative complexity but enabling access to higher performance categories.
Note: Segment shares of all individual segments available upon report purchase
Get Detailed Market Forecasts at the Most Granular Levels
Download PDF
By Application Type: Cargo Utility Transforms Commercial Logistics
City/Urban applications hold a 53.42% market share in 2024, while Cargo/Utility segments drive the most dynamic growth with a 21.36% CAGR (2025–2030). This pattern reflects the fundamental shift in last-mile logistics strategies as companies seek alternatives to van-based delivery systems in congested urban environments. STROOM's position as South Africa's sole domestic cargo e-bike manufacturer illustrates the segment's strategic importance and supply chain localization potential. Cargo e-bikes ability to navigate traffic restrictions and access pedestrian zones provides competitive advantages that traditional delivery vehicles cannot match.
Trekking/Mountain applications serve the recreational and tourism segments, benefiting from South Africa's diverse terrain and outdoor activity culture. These applications command premium pricing due to specialized component requirements for durability and performance in challenging conditions.
By Battery Type: Lithium-ion Dominance Accelerates
Lithium-ion technology commands 88.24% market share in 2024 while growing at 19.18% CAGR (2025-2030), demonstrating overwhelming market preference for energy density and performance characteristics. Despite higher upfront costs, this dominance reflects the technology's superior power-to-weight ratios and longer cycle life compared to Lead Acid alternatives. The segment's growth acceleration indicates market maturation beyond price-sensitive early adoption phases toward performance-oriented mainstream acceptance. Lead-acid batteries retain niche applications where cost sensitivity outweighs performance considerations, primarily in entry-level segments and price-constrained markets.
Battery chemistry selection increasingly influences overall e-bike positioning and target market definition, with lithium-ion enabling premium features like removable battery packs and extended range capabilities. The technology's declining cost curves, driven by global electric vehicle adoption, create favorable pricing trends for South African e-bike manufacturers.
By Motor Placement: Mid-Drive Innovation Gains Momentum
Hub motors maintain a 72.15% market share in 2024, while Mid-Drive motor configurations achieve strong growth with a 22.73% CAGR (2025–2030), reflecting technology evolution toward more sophisticated drivetrain integration. Mid-drive systems provide superior weight distribution and gear utilization, particularly valuable for South African terrain variations and climbing requirements in mountainous regions. This technology migration mirrors global premium e-bike trends while creating differentiation opportunities for manufacturers targeting performance-conscious consumers. Hub motor systems retain cost advantages and simplicity benefits that support mainstream market penetration.
The motor placement decision fundamentally affects e-bike performance characteristics, maintenance requirements, and manufacturing complexity. Mid-drive systems require more sophisticated integration with bicycle drivetrains but deliver better torque characteristics and climbing performance.
Get Detailed Market Forecasts at the Most Granular Levels
Download PDF
By Drive Systems: Belt Drive Technology Emerges
Chain Drive systems dominate with 84.67% market share in 2024, while Belt Drive technology grows at 20.32% CAGR (2025-2030), indicating gradual market evolution toward maintenance-free drivetrain solutions. Belt drives offer significant advantages in South African conditions where dust, sand, and moisture can accelerate chain wear and increase maintenance requirements. The technology's sealed design eliminates lubrication needs while providing quieter operation and longer service intervals, particularly appealing to urban commuters and corporate fleet operators. Chain drives maintain cost advantages and universal compatibility with existing bicycle components, supporting their continued dominance in price-sensitive segments.
The drivetrain choice reflects broader market maturation trends as manufacturers seek differentiation through reduced maintenance requirements and improved user experience. Belt drive adoption correlates with premium positioning and target markets willing to pay higher upfront costs for lower total ownership expenses. The technology requires specific frame designs and component integration, limiting retrofit applications but enabling purpose-built e-bike optimization.
By Motor Power: Mid-Range Performance Gains Traction
Less than 250 W systems hold 55.41% market share in 2024, while the 351 to 500 W motor power category achieves the fastest growth at 24.58% CAGR (2025-2030). This pattern reflects market evolution beyond regulatory minimum power levels toward performance categories that provide meaningful assistance for South African terrain and user requirements. The 351-500 W range offers an optimal balance between performance capability and regulatory compliance, avoiding motorcycle classification while delivering sufficient power for hill climbing and cargo hauling applications.
Lower power categories serve regulatory compliance and cost-sensitive segments but may prove inadequate for demanding applications. Motor power selection directly impacts vehicle classification under South African transport regulations, with implications for licensing, registration, and operational requirements. The 250 W threshold represents a critical regulatory boundary influencing market segmentation and product positioning strategies.
By Price Band: Premium Segments Show Resilience
The USD 1,500 to 2,499 price band maintains a 31.26% market share in 2024, while the USD 2,500 to 3,499 segment demonstrates the strongest growth at a 17.87% CAGR (2025–2030). This pricing evolution indicates market maturation beyond entry-level adoption toward higher-value segments that support premium features and performance characteristics. Premium pricing enables manufacturers to incorporate advanced technologies like mid-drive motors, lithium-ion batteries, and belt drive systems while maintaining acceptable profit margins. Lower price bands serve market entry functions but may lack the margin structure necessary for sustainable business models.
Exchange rate fluctuations between the rand and major currencies create pricing volatility that impacts imported components and complete e-bike units. Manufacturers must balance local market affordability with global component costs, often requiring strategic decisions about feature sets and positioning within specific price bands.
By Sales Channel: Digital Transformation Accelerates
Offline sales channels maintain a 67.48% market share in 2024, while Online channels achieve a 23.09% CAGR (2025–2030) growth, reflecting a gradual digital transformation in e-bike retail distribution. This channel evolution mirrors broader retail trends while accommodating the unique requirements of e-bike sales, including test ride needs and technical support services. Online channels provide cost advantages and broader geographic reach, particularly valuable for reaching customers in smaller cities and rural areas where physical dealerships may be limited. Traditional offline channels retain advantages for complex sales processes and after-sales service delivery.
The channel mix evolution reflects changing consumer behavior and retailer adaptation to digital commerce requirements. Online platforms enable price comparison and product research, while offline channels provide experiential benefits and immediate gratification. Given the product's complexity and service requirements, hybrid approaches that combine online marketing with offline fulfillment may prove optimal for e-bike retail.
Get Detailed Market Forecasts at the Most Granular Levels
Download PDF
By End Use: Commercial Delivery Transforms Market Dynamics
Personal and Family Use maintains a 49.37% market share in 2024, while Commercial Delivery – Retail and Goods applications achieve a 26.24% CAGR (2025–2030) growth. This segmentation reflects the fundamental market transformation as commercial applications drive adoption beyond traditional recreational and commuting uses. Corporate fleet adoption creates volume demand that supports manufacturing scale economies and technology development investments. Commercial applications also demonstrate clear return-on-investment metrics that justify premium pricing and advanced feature sets.
Service Providers and Institutional segments represent emerging opportunities as organizations seek sustainable transportation solutions for various operational requirements. Personal and Family Use segments encompass the broadest user base but may face affordability constraints that limit premium feature adoption. The end-use segmentation reveals distinct value propositions and purchasing criteria that require differentiated marketing approaches and product configurations. Commercial segments' growth acceleration indicates market evolution toward professional applications with more demanding performance and reliability requirements.
Competitive Landscape
The South African e-bike market exhibits moderate fragmentation with international brands competing alongside emerging local manufacturers for market share across diverse price segments and application categories. Global players like Trek, Specialized, and Giant leverage established dealer networks and brand recognition. Local manufacturers like STROOM focus on specialized segments such as cargo applications, where customization and local support provide competitive advantages. Market concentration remains limited with no single player commanding a dominant share, creating opportunities for premium positioning and cost-competitive strategies across different consumer segments.
Strategic patterns emphasize technology differentiation and local market adaptation, with successful players investing in dealer training, after-sales service capabilities, and product configurations suited to South African terrain and usage patterns. White-space opportunities exist in subscription and leasing models, battery swap infrastructure, and integrated mobility services that combine e-bikes with other transportation modes. Emerging disruptors focus on direct-to-consumer sales channels, innovative financing structures, and technology integration such as GPS tracking and anti-theft systems that address local security concerns. Regulatory compliance with UN R22 helmet standards and National Road Traffic Act provisions creates barriers to entry while ensuring safety framework adherence across market participants.
South Africa E-bike Industry Leaders
-
Accell Group
-
Cycling Sports Group, Inc.
-
Giant Manufacturing Co. Ltd.
-
Merida Industry Co. Ltd.
-
Riese & Müller
- *Disclaimer: Major Players sorted in no particular order
Need More Details on Market Players and Competitors?
Download PDF
Recent Industry Developments
- April 2025: Zimi secured R6 million (USD 3.3 million) grant funding from EEP Africa Trust Fund to develop vehicle-to-grid technology for electric vehicles in South Africa. The funding supports the company's expansion into integrated energy storage solutions that leverage e-bike batteries for grid stabilization during load-shedding periods
- December 2024: The Road Traffic Act was amended to classify electric bicycles (e-bikes) that exceed a top speed of 45km/h as motor vehicles. Consequently, any motor vehicle operating on a public road is mandated by law to be registered and licensed, and the rider must possess a license appropriate for that vehicle class.
South Africa E-bike Market Report Scope
Pedal Assisted, Speed Pedelec, Throttle Assisted are covered as segments by Propulsion Type. Cargo/Utility, City/Urban, Trekking are covered as segments by Application Type. Lead Acid Battery, Lithium-ion Battery, Others are covered as segments by Battery Type.
By Propulsion Type
| Pedal Assisted |
| Speed Pedelec |
| Throttle Assisted |
By Application Type
| Cargo/Utility |
| City/Urban |
| Trekking/Mountain |
By Battery Type
| Lead Acid Battery |
| Lithium-ion Battery |
| Others |
By Motor Placement
| Hub (front/rear) |
| Mid-drive |
By Drive Systems
| Chain Drive |
| Belt Drive |
By Motor Power
| Less than 250 W |
| 251 to 350 W |
| 351 to 500 W |
| 501 to 600 W |
| More than 600 W |
By Price Band (USD)
| Up to 1,000 |
| 1,000 to 1,499 |
| 1,500 to 2,499 |
| 2,500 to 3,499 |
| 3,500 to 5,999 |
| Above 6,000 |
By Sales Channel
| Online |
| Offline |
By End Use
| Commercial Delivery | Retail and Goods Delivery |
| Food and Beverage Delivery | |
| Service Providers | |
| Personal and Family Use | |
| Institutional | |
| Others |
| By Propulsion Type | Pedal Assisted | |
| Speed Pedelec | ||
| Throttle Assisted | ||
| By Application Type | Cargo/Utility | |
| City/Urban | ||
| Trekking/Mountain | ||
| By Battery Type | Lead Acid Battery | |
| Lithium-ion Battery | ||
| Others | ||
| By Motor Placement | Hub (front/rear) | |
| Mid-drive | ||
| By Drive Systems | Chain Drive | |
| Belt Drive | ||
| By Motor Power | Less than 250 W | |
| 251 to 350 W | ||
| 351 to 500 W | ||
| 501 to 600 W | ||
| More than 600 W | ||
| By Price Band (USD) | Up to 1,000 | |
| 1,000 to 1,499 | ||
| 1,500 to 2,499 | ||
| 2,500 to 3,499 | ||
| 3,500 to 5,999 | ||
| Above 6,000 | ||
| By Sales Channel | Online | |
| Offline | ||
| By End Use | Commercial Delivery | Retail and Goods Delivery |
| Food and Beverage Delivery | ||
| Service Providers | ||
| Personal and Family Use | ||
| Institutional | ||
| Others | ||
Need A Different Region or Segment?
Customize Now
Market Definition
- By Application Type - E-bikes considered under this segment include city/urban, trekking, and cargo/utility e-bikes. The common types of e-bikes under these three categories include off-road/hybrid, kids, ladies/gents, cross, MTB, folding, fat tire, and sports e-bike.
- By Battery Type - This segment includes lithium-ion batteries, lead-acid batteries, and other battery types. The other battery type category includes nickel-metal hydroxide (NiMH), silicon, and lithium-polymer batteries.
- By Propulsion Type - E-bikes considered under this segment include pedal-assisted e-bikes, throttle-assisted e-bikes, and speed pedelec. While the speed limit of pedal and throttle-assisted e-bikes is usually 25 km/h, the speed limit of speed pedelec is generally 45 km/h (28 mph).
| Keyword | Definition |
|---|---|
| Pedal Assisted | Pedal-assist or pedelec category refers to the electric bikes that provide limited power assistance through torque-assist system and do not have throttle for varying the speed. The power from the motor gets activated upon pedaling in these bikes and reduces human efforts. |
| Throttle Assisted | Throttle-based e-bikes are equipped with the throttle assistance grip, installed on the handlebar, similarly to motorbikes. The speed can be controlled by twisting the throttle directly without the need to pedal. The throttle response directly provides power to the motor installed in the bicycles and speeds up the vehicle without paddling. |
| Speed Pedelec | Speed pedelec is e-bikes similar to pedal-assist e-bikes as they do not have throttle functionality. However, these e-bikes are integrated with an electric motor which delivers power of approximately 500 W and more. The speed limit of such e-bikes is generally 45 km/h (28 mph) in most of the countries. |
| City/Urban | The city or urban e-bikes are designed with daily commuting standards and functions to be operated within the city and urban areas. The bicycles include various features and specifications such as comfortable seats, sit upright riding posture, tires for easy grip and comfortable ride, etc. |
| Trekking | Trekking and mountain bikes are special types of e-bikes that are designed for special purposes considering the robust and rough usage of the vehicles. These bicycles include a strong frame, and wide tires for better and advanced grip and are also equipped with various gear mechanisms which can be used while riding in different terrains, rough grounded, and tough mountainous roads. |
| Cargo/Utility | The e-cargo or utility e-bikes are designed to carry various types of cargo and packages for shorter distances such as within urban areas. These bikes are usually owned by local businesses and delivery partners to deliver packages and parcels at very low operational costs. |
| Lithium-ion Battery | A Li-ion battery is a rechargeable battery, which uses lithium and carbon as its constituent materials. The Li-Ion batteries have a higher density and lesser weight than sealed lead acid batteries and provide the rider with more range per charge than other types of batteries. |
| Lead Acid Battery | A lead acid battery refers to sealed lead acid battery having a very low energy-to-weight and energy-to-volume ratio. The battery can produce high surge currents, owing to its relatively high power-to-weight ratio as compared to other rechargeable batteries. |
| Other Batteries | This includes electric bikes using nickel–metal hydroxide (NiMH), silicon, and lithium-polymer batteries. |
| Business-to-Business (B2B) | The sales of e-bikes to business customers such as urban fleet and logistics company, rental/sharing operators, last-mile fleet operators, and corporate fleet operators are considered under this category. |
| Business-to-Customers (B2C) | The sales of electric scooters and motorcycles to direct consumers is considered under this category. The consumers acquire these vehicles either directly from manufacturers or from other distributers and dealers through online and offline channel. |
| Unorganized Local OEMs | These players are small local manufacturers and assemblers of e-bikes. Most of these manufacturers import the components from China and Taiwan and assemble them locally. They offer the product at low cost in this price sensitive market which give them advantage over organized manufacturers. |
| Battery-as-a-Service | A business model in which the battery of an EV can be rented from a service provider or swapped with another battery when it runs out of charge |
| Dockless e-Bikes | Electric bikes that have self-locking mechanisms and a GPS tracking facility with an average top speed of around 15mph. These are mainly used by bike-sharing companies such as Bird, Lime, and Spin. |
| Electric Vehicle | A vehicle which uses one or more electric motors for propulsion. Includes cars, scooters, buses, trucks, motorcycles, and boats. This term includes all-electric vehicles and hybrid electric vehicles |
| Plug-in EV | An electric vehicle that can be externally charged and generally includes all-electric vehicles as well as plug-in hybrids. In this report we use the term for all-electric vehicles to differentiate them from plug-in hybrid electric vehicles. |
| Lithium-Sulphur Battery | A rechargeable battery that replaces the liquid or polymer electrolyte found in current lithium-ion batteries with sulfur. They have more capacity than Li-ion batteries. |
| Micromobility | Micromobility is one of the many modes of transport involving very-light-duty vehicles to travel short distances. These means of transportation include bikes, e-scooters, e-bikes, mopeds, and scooters. Such vehicles are used on a sharing basis for covering short distances, usually five miles or less. |
| Low Speed Electric Vehicls (LSEVs) | They are low speed (usually less than 25 kmph) light vehicles that do not have an internal combustion engine, and solely use electric energy for propulsion. |
Need More Details on Market Definition?
Ask a Question
Research Methodology
Mordor Intelligence follows a four-step methodology in all its reports.
- Step-1: Identify Key Variables: To build a robust forecasting methodology, the variables and factors identified in Step-1 are tested against available historical market numbers. Through an iterative process, the variables required for market forecast are set and the model is built based on these variables.
- Step-2: Build a Market Model: Market-size estimations for the historical and forecast years have been provided in revenue and volume terms. Market revenue is calculated by multiplying the volume demand with volume-weighted average battery pack price (per kWh). Battery pack price estimation and forecast takes into account various factors affecting ASP, such as inflation rates, market demand shifts, production costs, technological developments, and consumer preferences, providing estimations for both historical data and future trends.
- Step-3: Validate and Finalize: In this important step, all market numbers, variables, and analyst calls are validated through an extensive network of primary research experts from the market studied. The respondents are selected across levels and functions to generate a holistic picture of the market studied.
- Step-4: Research Outputs: Syndicated Reports, Custom Consulting Assignments, Databases & Subscription Platforms

Get More Details On Research Methodology
Download PDF


