
Market Overview
| Study Period | 2020 - 2031 |
|---|---|
| Forecast Data Period | 2026 - 2031 |
| Base Year Market Size (2025) | USD 326.12 Million |
| Market Size (2026) | USD 344.78 Million |
| Market Size (2031) | USD 455.26 Million |
| Growth Rate (2026 - 2031) | 5.72 % |
| Market Concentration | Medium |
Major Players *Disclaimer: Major Players sorted in no particular order Image © Mordor Intelligence. Reuse requires attribution under CC BY 4.0. | |
South Africa Diabetes Drugs Market Analysis by Mordor Intelligence
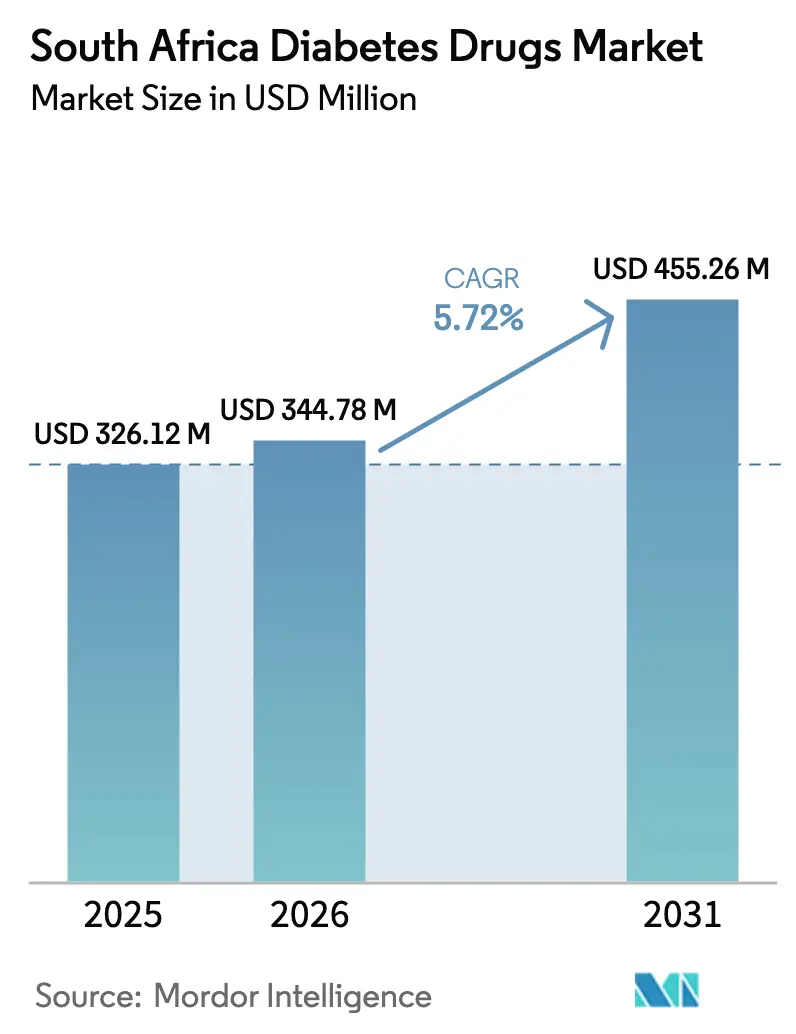
The South Africa diabetes drugs market size is expected to grow from USD 326.12 million in 2025 to USD 344.78 million in 2026 and is forecast to reach USD 455.26 million by 2031 at 5.72% CAGR over 2026-2031. Escalating diabetes prevalence—now affecting more than 4 million residents—intersects with rising private medical-aid coverage and local manufacturing investments, creating a robust demand outlook. Uptake of SGLT-2 inhibitors and GLP-1 receptor agonists broadens therapeutic choices, while value-based reimbursement models nudge prescribers toward agents that demonstrate measurable cardiometabolic benefits. A moderate but steady shift of prescription volumes from public facilities to private sector channels mirrors stronger purchasing power in urban provinces, reinforcing differentiated access patterns. Concurrently, online pharmacies extend reach into semi-urban communities, signifying that the South Africa diabetes drugs market is pivoting toward digitally enabled distribution.
Key Report Takeaways
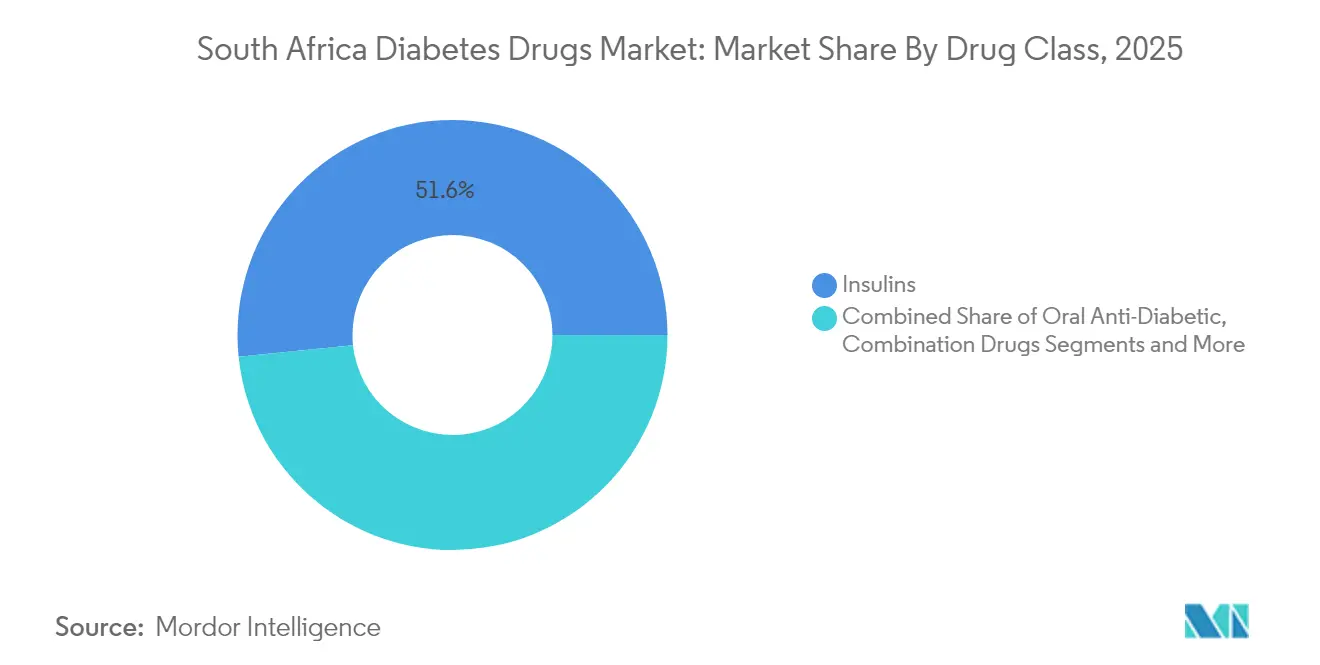
- By drug class, insulins led with 51.62% of the South Africa diabetes drugs market share in 2025; non-insulin injectables post the fastest CAGR at 9.88% through 2031.
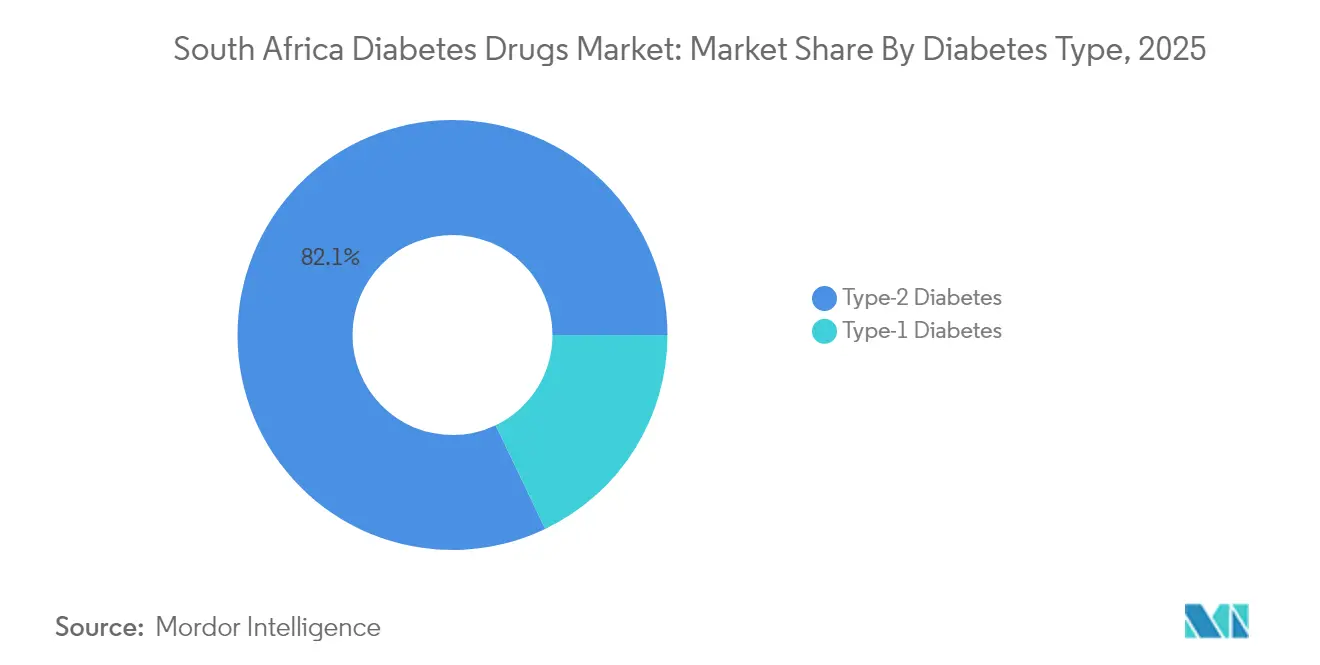
- By diabetes type, Type 2 diabetes accounted for 82.10% share of the South Africa diabetes drugs market size in 2025 and is advancing at a 6.83% CAGR to 2031.
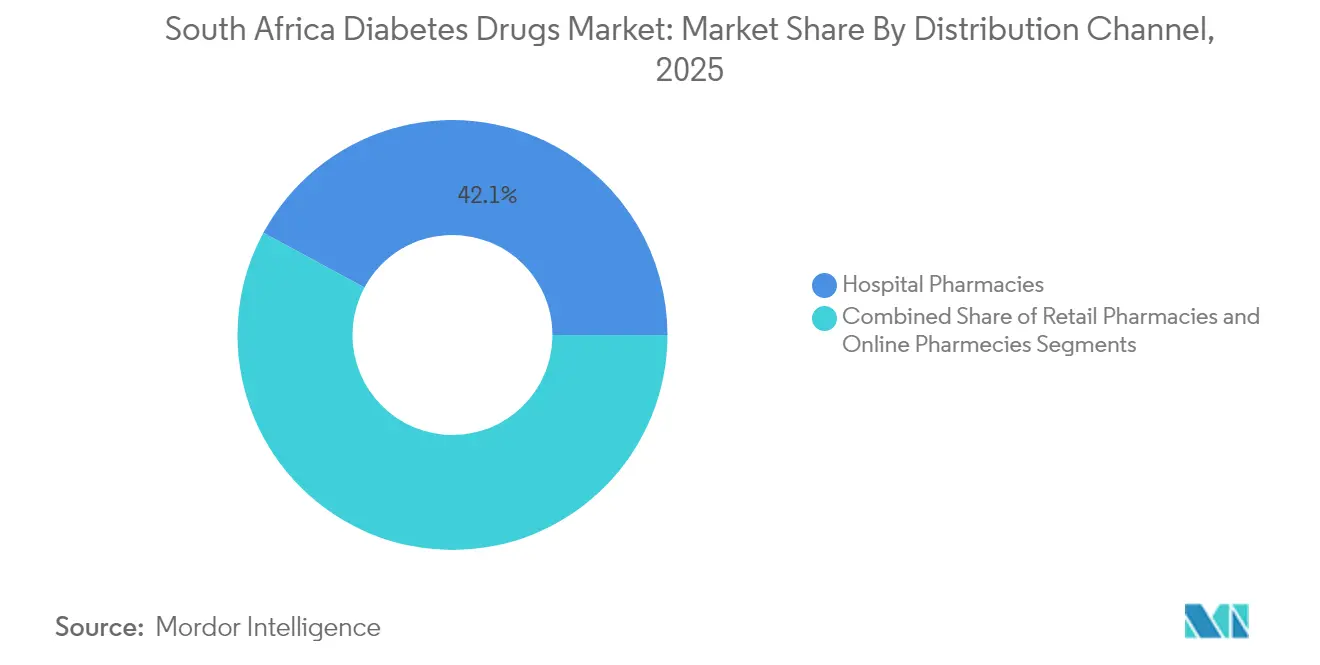
- By distribution channel, hospital pharmacies held 42.12% revenue share in 2025, whereas online pharmacies are projected to expand at a 9.35% CAGR between 2026-2031.
Note: Market size and forecast figures in this report are generated using Mordor Intelligence’s proprietary estimation framework, updated with the latest available data and insights as of 2026.
South Africa Diabetes Drugs Market Trends and Insights
Drivers Impact Analysis*
| Driver | (~) % Impact on CAGR Forecast | Geographic Relevance | Impact Timeline |
|---|---|---|---|
| Escalating diabetes prevalence & earlier age of onset | +1.2% | National, concentrated in urban areas | Medium term (2-4 years) |
| Expansion of private medical-aid coverage for chronic medicines | +0.9% | National, higher impact in Gauteng, Western Cape | Short term (≤ 2 years) |
| Rapid uptake of SGLT-2 and GLP-1 classes in local guidelines | +0.8% | National, early adoption in private sector | Medium term (2-4 years) |
| Local contract-manufacturing & fill-finish capacity build-out | +0.6% | National, manufacturing hubs in Gauteng, KwaZulu-Natal | Long term (≥ 4 years) |
| Surge in tele-pharmacy platforms enabling e-prescriptions | +0.5% | National, accelerated in metropolitan areas | Short term (≤ 2 years) |
| Government initiatives and reimbursement | +0.4% | National, focus on public sector facilities | Long term (≥ 4 years) |
| Source: Mordor Intelligence | |||
Escalating Diabetes Prevalence & Earlier Age of Onset
South Africa is experiencing a younger age of diabetes onset, shifting the therapy horizon from episodic to lifelong treatment. Mitochondrial dysfunction studies highlight genetic and lifestyle interplay unique to the region. Longer treatment journeys multiply cumulative drug volumes, enlarging the South Africa diabetes drugs market considerably. Urban dietary transitions toward energy-dense foods worsen glycaemic profiles, while declining physical activity amplifies insulin resistance. Clinicians now initiate pharmacotherapy earlier, including dual therapy at diagnosis, to curb long-term complications. Insurer analytics show that patients diagnosed before age 40 incur medication costs nearly two-and-a-half times higher than those diagnosed after 55. This demographic migration keeps demand resilient even if incidence stabilizes.
Expansion of Private Medical-Aid Coverage for Chronic Medicines
Discovery Health and other large schemes now list most guideline-recommended agents under chronic benefits, dramatically lowering member cost-sharing. Full benefit coverage for basal-bolus insulin regimens and partial cover for next-generation GLP-1 agonists reduce financial friction, encouraging rapid switching to premium therapies. Private schemes also pilot value-based formularies that reimburse at higher tiers when HbA1c targets are met, aligning stakeholder incentives. The net result is deeper penetration of newer drug classes in metropolitan areas, strengthening revenue density per treated patient. Spill-over effects occur as public guidelines observe private-sector outcome data and consider broader adoption. Consequently, the South Africa diabetes drugs market gains an accelerated path for innovative molecules.
Rapid Uptake of SGLT-2 and GLP-1 Classes in Local Guidelines
Local endocrinology societies have added SGLT-2 inhibitors as second-line therapy for patients with cardiovascular risk, and GLP-1 agonists for those needing weight reduction. A Western Cape cohort study confirmed that quarterly HbA1c testing coupled with these agents cut hospitalization days by 18% within twelve months.[1] Although high prices restrict public-sector diffusion, private sector uptake proves the clinical pay-off. That evidence edges policymakers toward eventual tender inclusion, particularly once biosimilar versions gain SAHPRA approval. Prescribing momentum, once formed, rarely reverses, solidifying long-run volume growth.
Local Contract-Manufacturing & Fill-Finish Capacity Build-Out
Novo Nordisk’s alliance with Aspen Pharmacare to fill-finish human insulin vials at a ceiling ex-factory price of USD 3 channels substantial volumes through domestic plants. Similar lines are earmarked for cartridge and pen assembly, insulating supply from import-route shocks. Local production trims foreign-exchange exposure and shortens lead times, attributes that resonate after pandemic-era disruptions. Government incentive packages—tax holidays and equipment grants—further sweeten on-shoring economics. Over time, scale economies could spill into contract production of GLP-1 injectables, anchoring the South Africa diabetes drugs market as a regional export base.
Restraints Impact Analysis*
| Restraint | (~) % Impact on CAGR Forecast | Geographic Relevance | Impact Timeline |
|---|---|---|---|
| High out-of-pocket cost of novel therapies | -0.8% | National, higher impact in rural areas | Short term (≤ 2 years) |
| Frequent insulin & test-strip stock-outs in public sector depots | -0.6% | National, concentrated in rural provinces | Medium term (2-4 years) |
| Regulatory backlog for biosimilar approvals (SAHPRA) | -0.4% | National, affects all market segments | Medium term (2-4 years) |
| Patient adherence issues linked to traditional-medicine preferences | -0.3% | National, higher in rural and traditional communities | Long term (≥ 4 years) |
| Source: Mordor Intelligence | |||
High Out-of-Pocket Cost of Novel Therapies
The best-in-class GLP-1 agonist regimen costs up to 14% of an average household’s post-tax income when purchased without full medical-aid subsidy. Such expense forces therapeutic rationing, sustaining a two-tier system. Patients in the lower-middle segment often cycle between public clinics for baseline care and private pharmacies for episodic refills, disrupting continuity. Clinicians report delaying therapy intensification by eight to ten months on affordability grounds, undermining glycaemic control. Manufacturers respond with limited co-pay vouchers, yet their scope remains urban-centric. Until broader subsidy or price re-negotiation occurs, uptake trajectories will remain flatter than clinical need suggests.
Frequent Insulin & Test-Strip Stock-Outs in Public Sector Depots
MSF documented a national stock-out of insulin pens in 2024, affecting thousands of users and triggering emergency transitions to vials.[2]Supply gaps stem from tender mis-forecasting, port congestion and funding lags. Rural provinces shoulder the brunt because replenishment logistics are slower. Each shortage episode drives temporary spikes in private pharmacy demand but entrenches distrust in public supply reliability. Chronic uncertainty prompts some patients to hoard inventories, aggravating cyclical shortages. For the South Africa diabetes drugs market, such volatility dampens long-range demand visibility and can blunt therapy innovation momentum in the public channel.
*Our forecasts treat driver/restraint impacts as directional, not additive. The impact forecasts reflect baseline growth, mix effects, and variable interactions.
Segment Analysis
By Drug Class: Insulin Dominance Faces Injectable Innovation
Insulins generated 51.62% of the South Africa diabetes drugs market revenue in 2025, thanks to indispensable usage in Type 1 diabetes and late-stage Type 2 cases. Basal-bolus regimens remain the cornerstone because they align with current national guidelines and are staples of provincial tenders. However, supply disruptions spotlight vulnerabilities that biosimilar entrants aim to exploit. Non-insulin injectables, chiefly GLP-1 receptor agonists, compound market dynamism with a 9.88% CAGR to 2031, reshaping therapeutic hierarchies despite price premiums. These molecules deliver dual glycaemic and weight-management outcomes, attributes that resonate with prescribers treating obese urban patients. Oral antidiabetic drugs—metformin, sulfonylureas and DPP-4 inhibitors—continue as first-line agents, serving as volume stabilizers when injectables face affordability pushback.
Pipeline innovations extend the insulin franchise into ultra-long-acting formats such as once-weekly insulin icodec. Early trial visibility has heightened clinician anticipation, even before formal South African registration, because reduced injection frequency addresses adherence drop-off. With fill-finish capacity now domestic, stakeholders expect pricing headroom for premium formulations. Nonetheless, competitive intensity will hinge on SAHPRA’s processing speed for biosimilar dossiers; every new approval promises to temper pricing discipline across the South Africa diabetes drugs market.

By Diabetes Type: Type 2 Complexity Drives Treatment Evolution
Type 2 diabetes accounted for 82.10% of diagnosed cases and steers therapeutic volume growth at a 6.83% CAGR, anchoring the South Africa diabetes drugs market size expansion through 2031. Lifestyle transition toward sedentary occupations and calorie-dense diets accelerates the metabolic shift, extending drug exposure windows. Complication-centric prescribing—focusing on cardiovascular and renal endpoints—encourages earlier integration of SGLT-2 and GLP-1 agents. In contrast, Type 1 diabetes remains a steady but smaller segment, monopolizing basal and rapid-acting insulin demand without significant class diversification.
Researchers link uncontrolled Type 2 diabetes to elevated ketogenesis metabolites, underscoring dietary non-compliance in many cases. Community Health Workers now lead education drives that explain carbohydrate counting and drug titration, helping curtail avoidable hospital admissions. These grassroots efforts, when coupled with digital glucose-monitoring apps, aim to push the proportion of patients meeting HbA1c targets beyond the current 23%. Improved outcomes would naturally escalate chronic medication lifespans, reinforcing volume stability for the South Africa diabetes drugs market.
By Distribution Channel: Digital Transformation Reshapes Access
Hospital pharmacies held 42.12% of overall revenue in 2025, reflecting their role in complex case management and integrated laboratory services. They remain critical for insulin initiation, titration and severe hypoglycaemia intervention. Retail community pharmacies cater to routine refills and acute counseling, benefiting from dense geographic coverage. Online platforms, while representing a single-digit share today, post a 9.35% CAGR as tele-consult workflows mature. A study found that 88% of e-pharmacies surveyed carry legitimate pharmacy licenses, although regulatory identifiers are displayed inconsistently.
Medical-aid electronic pre-authorization portals now push approved prescriptions directly to partnered online pharmacies, trimming delays. Automated refill scheduling and home delivery convenience drive higher adherence in tech-savvy patient segments. In rural settings, hybrid models emerge: virtual consultations link district hospitals to township collection points, preserving cold-chain integrity for insulin. Such channel blending ensures that the South Africa diabetes drugs market maintains synchronized volume streams across physical and digital storefronts.
Geography Analysis
Urban provinces, notably Gauteng and Western Cape, generate more than half of national diabetes prescription revenue, mirroring concentrated private insurance penetration. These areas also host leading tertiary hospitals that pioneer GLP-1 protocol adoption, thereby serving as early-adopter clusters for innovative therapies. KwaZulu-Natal follows, leveraging Durban’s port infrastructure for pharmaceutical import flows and recent investments in fill-finish plants. By contrast, Eastern Cape and Limpopo face sparse endocrinology coverage and periodic medicine stock-outs, dampening overall uptake.
National Health Insurance rollout seeks to homogenize access, but phased implementation means regional disparities will linger through most of this decade. Community Health Workers play bridging roles by coordinating medicine pick-ups and reinforcing adherence in remote villages. Tele-pharmacy pilots in Mpumalanga demonstrate how smartphone penetration can counter logistic bottlenecks when signal coverage is adequate. Over time, localized manufacturing hubs in Gauteng and KwaZulu-Natal will reduce lead-times to rural clinics, potentially narrowing geographic treatment gaps.
Cross-border opportunity also shapes strategic planning. South African producers eye Southern African Development Community markets, where compatible regulatory frameworks expedite export licensing. Bulk contracts with Botswana and Namibia health ministries already reflect such expansion moves. Consequently, provincial production capacity may overshoot domestic needs, but surplus can flow regionally, reinforcing South Africa’s pharma hub aspirations and stabilizing factory utilization rates within the South Africa diabetes drugs market.
Regulatory Landscape
South Africa diabetes medicines are regulated by the South African Health Products Regulatory Authority (SAHPRA) under the Medicines and Related Substances Act, 1965 (Act No. 101 of 1965). SAHPRA governs product registration, quality, labeling, and post-market controls for insulins, oral antidiabetic drugs, and newer GLP-1 and SGLT-2 therapies. SAHPRA has also issued positions clarifying that compounded semaglutide products are not substitutes for registered medicines, reinforcing restrictions around large-scale compounding, advertising, and distribution of unregistered products.
Enforcement and review actions have become more visible around GLP-1 therapies as demand rose and supply tightness created parallel channels. In May 2026, SAHPRA and the South African Pharmacy Council (SAPC) announced joint actions to crack down on unlawful manufacturing of unregistered GLP-1 medicines, while SAHPRA also disclosed it is reviewing multiple generic semaglutide applications (12 applications noted in SAHPRA materials and related coverage). These steps tighten compliance expectations for pharmacies and manufacturers and shape the pace at which lower-cost GLP-1 options can enter regulated supply.
Value Chain Analysis
The South Africa diabetes drugs value chain begins with active ingredient and finished-dosage manufacturing that is split between multinational producers and local partners, followed by SAHPRA registration, wholesaling, and distribution into public and private channels. Public-sector procurement is typically centralized via the National Department of Health, with inventory management and last-mile distribution executed at provincial level into clinics and hospitals, while the private sector largely routes through hospital and retail pharmacy networks and an expanding set of licensed e-pharmacy operators.
Supply resilience and cold-chain execution are critical pinch points for insulin and other injectable therapies. The 2024 insulin pen shortages highlighted exposure to global capacity constraints and tender forecasting, driving substitution toward vials and alternative suppliers. This also increases the role of local packaging or fill-finish where available. In this context, local manufacturing footprints and partnerships (for example, Sanofi having local manufacturing presence and the Novo Nordisk-Aspen pathway for domestic insulin production referenced in the report context) shorten lead times and reduce import dependency. Meanwhile, private medical-aid formularies and pre-authorization portals increasingly steer volumes toward specific brands and channels, including online fulfillment.
Competitive Landscape
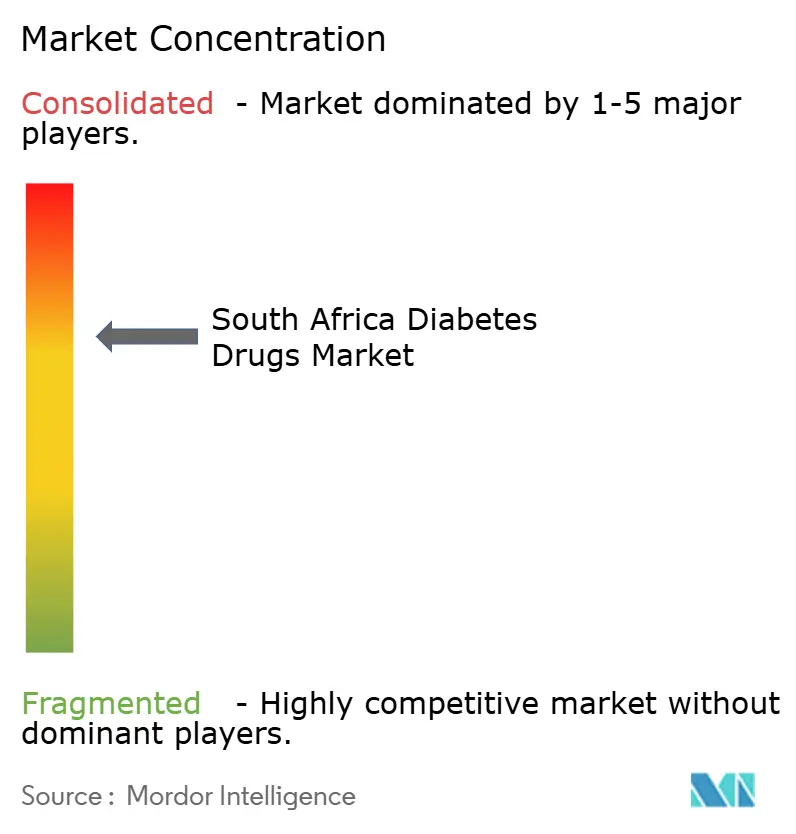
Multinational incumbents—Novo Nordisk, Sanofi and Eli Lilly—retain market leadership through well-established insulin and GLP-1 portfolios. Their combined volume share in insulin eclipses 60%, marking a moderate concentration level. Each firm embeds clinician-education programs and patient-support hotlines to reinforce brand loyalty. Recent shortages, however, exposed vulnerabilities that biosimilar manufacturers intend to exploit once SAHPRA clears regulatory backlogs.
Strategic alliances typify the current playbook: Novo Nordisk’s fill-finish deal with Aspen Pharmacare, Sanofi’s packaging collaboration in KwaZulu-Natal and Lilly’s IT partnership for cloud-based dose-adjustment tools. These moves localize value addition and mitigate import duties while sharpening supply-chain resilience. Digital therapeutics loom as a differentiator; companies integrate Bluetooth-enabled pens with mobile coaching apps, aligning with payer interest in verifiable adherence.
Regulatory dynamics shape competitive cadence. SAHPRA’s fast-track lane for biosimilars promises to open price-elastic segments, especially in basal insulin. Meanwhile, National Health Insurance negotiations prioritize lowest sustainable tender bids, incentivizing cost-efficient producers. Cultural acceptance of traditional medicine nudges innovators to craft communication campaigns that respect local healing narratives, reducing mistrust. Collectively, these trends maintain vigorous rivalry but also encourage collaboration around supply security within the South Africa diabetes drugs market.
South Africa Diabetes Drugs Industry Leaders
-
AstraZeneca
-
Merck
-
Novo Nordisk A/S
-
Eli Lilly
-
Sanofi
- *Disclaimer: Major Players sorted in no particular order
Market Opportunities and Future Outlook
The opportunity for regulated, lower-cost GLP-1 supply is narrowing as South Africa shifts from constrained originator availability and sporadic compounded products toward registered generics and authorized alternatives. SAHPRA has indicated it is reviewing 12 generic semaglutide applications, and enforcement in May 2026 against unlawful manufacturing of unregistered GLP-1 medicines increases the premium on compliant, registered products. This combination supports opportunities for manufacturers with SAHPRA-ready dossiers, reliable cold-chain distribution, and pricing strategies aligned to private medical-aid access as well as potential public procurement pathways.
On the demand side, policy-driven screening and earlier detection programs bring more patients into pharmacotherapy, supported by guideline-driven uptake of SGLT-2 inhibitors and GLP-1 receptor agonists in higher-risk Type 2 populations. The National Department of Health has set a diabetes screening target of 105 million individuals over the MTEF period and is expanding community-based screening for elevated blood glucose to enable earlier referral, increasing the diagnosed pool that can be treated across oral therapies, insulin, and newer classes. On the supply side, local manufacturing and fill-finish initiatives, alongside tighter controls on unregistered GLP-1 supply, create room for compliant entrants to build share through better continuity of supply, more predictable tender participation, and broader geographic reach into underserved provinces.
Recent Industry Developments
- July 2026: Novo Nordisk announced the upcoming launch (July 27, 2026) of Extensior, a lower-cost copy of its semaglutide diabetes medication, in partnership with Acino. The launch expands GLP-1 market options and signals pricing pressure on existing therapies. The move strengthens Novo Nordisk's ability to defend its GLP-1 dominance amid generics competition.
- July 2026: Sun Pharmaceutical Industries received SAHPRA regulatory approval to manufacture and market a generic semaglutide injection for adults with inadequately controlled type 2 diabetes. The entry of generic semaglutide in SA broadens access and price competition. Localized production strengthens supply security and affordability for patients on GLP-1 therapy.
- May 2026: Aspen Pharmacare commenced commercial release of the first batches of locally manufactured human insulin in Gqeberha following SAHPRA approval. Insulin supply localization supports private sector uptake. Domestic insulin production enhances supply resilience and supports private sector uptake.
Research Methodology Framework and Report Scope
Market Definition and Coverage
For this report, the market covers prescription medicines used to treat diabetes in South Africa, counted as revenue earned through hospital, retail, and online pharmacy channels at the manufacturer level in USD.
Scope exclusions: Diabetes monitoring devices, insulin delivery devices, and general weight management products are excluded from this market sizing.
Segmentation Overview
- By Drug Class
- Oral Anti-Diabetic Drugs
- Insulins
- Combination Drugs
- Non-Insulin Injectables
- By Diabetes Type
- Type-1 Diabetes
- Type-2 Diabetes
- By Distribution Channel
- Hospital Pharmacies
- Retail Pharmacies
- Online Pharmacies / Tele-pharmacy
Data Sources, Market Sizing, and Validation
Desk Research
Desk work starts by mapping the treated diabetes population and the local care pathway, then linking it to how drugs are procured and dispensed in South Africa. We rely on public health statistics and policy documents to understand diagnosis levels, therapy initiation, and how formularies shape access across the mixed public and private system.
For the core inputs, we used sources such as the International Diabetes Federation atlas, Statistics South Africa population tables, National Department of Health and Essential Medicines List materials, the South African Health Products Regulatory Authority updates for approvals and labeling, and OECD style health indicators where available for context. We also reviewed annual reports, results decks, and price or reimbursement notes in public documents, then supplemented gaps using paid subscriptions for company financial intelligence, patent databases, and shipment level import and export signals for selected molecules. These sources are not exhaustive, and many other public and paid references were used for data collection, cross-checking, and clarification during the work.
Primary Interviews and Surveys
Primary work was used to pressure test the demand pool and pricing logic with people who see diabetes prescriptions and procurement in real life, including clinicians, pharmacists, payor and scheme administrators, wholesalers, and local distributors. Since this is a single-country market, we covered the main metro provinces and also spoke with respondents serving peri-urban and rural catchments so channel mix and access differences were not averaged away.
Distribution of primary research fieldwork respondents
| Company type | Respondent position |
|---|---|
| Top tier: 28% | CXOs: 15% |
| Mid tier: 50% | Functional/Unit leaders: 38% |
| Smaller Players: 22% | Managers: 47% |
Market-Sizing & Forecasting
Sizing is built using a top-down and bottom-up hybrid, where the top-down side reconstructs annual medicine demand by starting from the diabetes population, applying diagnosis and treatment rates, and then splitting therapy into insulin, oral agents, and non-insulin injectables based on local practice. Once the patient and therapy pool is set, we translate it into value using typical daily dose patterns, pack sizes, and average selling price ranges observed in procurement and pharmacy channels, and then adjust for public tender dynamics versus private reimbursement behaviors.
Key drivers in the model include diabetes prevalence and age mix, share of type 1 versus type 2, insulin penetration, uptake of newer non-insulin injectables, average duration on therapy, and channel shifts between hospital, retail, and online pharmacies. Where data is thin for smaller classes, we cross-check through selective bottom-up approximations such as sampled brand and generic price points multiplied by expected volumes and distributor channel checks. For gaps, we use analog molecules with similar dosing and utilization until primary feedback supports a more accurate split.
For forecasting, we use scenario analysis supported by trend smoothing on key drivers, and the assumptions are anchored to expected diagnosis growth, therapy intensification rates, and pricing progression, including tender-related price steps, as validated by experts. The final forecast is kept practical and repeatable, so each driver can be adjusted and the impact on the total is visible.
Data Validation & Update Cycle
Validation is done through several checks that look for internal consistency and real-world fit. We compare the model output against independent signals such as public procurement patterns, known shifts in prescribing, and changes in availability after regulatory updates, then review any sharp jumps by class or channel before sign-off.
A second analyst reviews the logic, the key assumptions, and the math trail, and respondents are re-contacted when a variance cannot be explained by a visible demand or pricing change. Reports are refreshed annually, with interim updates when material events occur, and before delivery we do a final pass so clients receive the latest updated view.
Mordor Intelligence's South Africa Diabetes Drugs Market Size Compared With Other Published Estimates
Published numbers for diabetes drugs in South Africa can look quite different because the counted products and the revenue capture points are not always the same, and some studies use retail-only tracking as a shortcut. Timing also matters, since currency conversion dates, tender price revisions, and the speed of uptake for newer injectables can shift a single-year value noticeably.
Diabetes devices and glucose monitoring supplies sit outside Mordor Intelligence's scope, and that alone can explain why some broader diabetes care figures appear larger than a drugs-only estimate. Other gaps usually come from whether public sector tenders are normalized across provinces, whether private scheme reimbursement volumes are assumed from membership data without therapy splits, and whether average prices are held flat even when generic penetration is rising in oral classes.
Benchmark comparison
| Source | Market Size | Gaps in Research Methodology |
|---|---|---|
| Mordor Intelligence | USD 326.12 M (2025) | |
| Trade Journal A | USD 309.30 M (2022) | Uses a retail-oriented view for oral therapies and does not clearly show how insulin and non-insulin injectables are valued, which can undercount tender-driven volumes and newer class uptake. |
| Industry Bulletin B | USD 332.82 M (2023) | Leans on historic pharmacy sales style reporting and gives limited adjustment for public procurement timing and channel shifts, so the year-to-year comparability can be weaker. |
Overall, the spread mostly comes from what is counted as drugs versus broader diabetes care, and from how public procurement and channel mix are treated in the conversion from volumes to USD value. By keeping the demand pool tied to treated patients and then checking price and volume logic with local channel feedback, the estimate stays traceable to clear steps that can be repeated and updated.
Key Questions Answered in the Report
What is the current South Africa diabetes drugs market size?
The South Africa diabetes drugs market size is USD 344.78 million in 2026 and is projected to reach USD 455.26 million by 2031 at a 5.72% CAGR.
Which drug class holds the largest share in the South Africa diabetes drugs market?
Insulins lead with 51.62% market share in 2025 due to their indispensable role in Type 1 and advanced Type 2 diabetes management.
Why are GLP-1 receptor agonists gaining traction in South Africa?
GLP-1 agents offer combined glycaemic, cardiovascular and weight-loss benefits, aligning with updated local guidelines that prioritize complication reduction.
How is private medical-aid coverage influencing drug uptake?
Expanded chronic benefits enable broader access to premium therapies, accelerating adoption of next-generation agents in urban centers where medical-aid penetration is highest.
What challenges impede wider usage of novel diabetes therapies?
High out-of-pocket costs and intermittent public-sector stock-outs limit consistent access, especially in rural areas lacking robust medical-aid coverage.
How will local manufacturing partnerships impact future drug prices?
Fill-finish agreements such as Novo Nordisk’s deal with Aspen Pharmacare aim to cap insulin vial prices at USD 3, potentially lowering overall therapy costs and improving supply security.