South Africa Courier, Express, And Parcel (CEP) Market Size and Share
Market Overview
| Study Period | 2017 - 2030 |
|---|---|
| Base Year For Estimation | 2024 |
| Forecast Data Period | 2025 - 2030 |
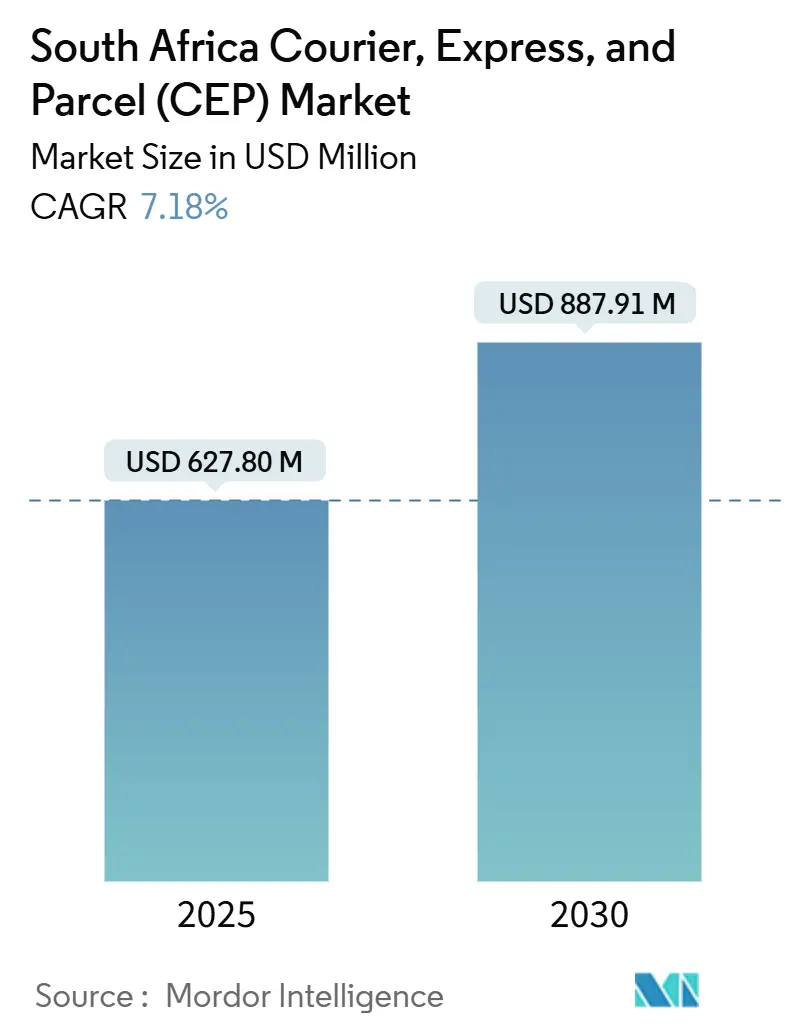
| Market Size (2025) | USD 627.80 Million |
| Market Size (2030) | USD 887.91 Million |
| Growth Rate (2025 - 2030) | 7.18% CAGR |
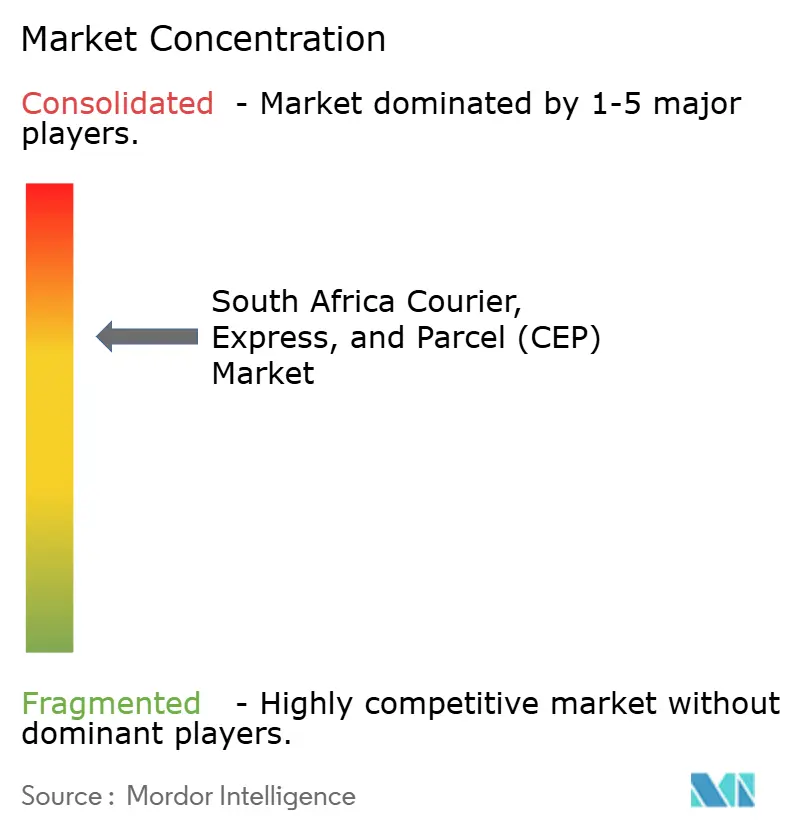
| Market Concentration | Medium |
Major Players
*Disclaimer: Major Players sorted in no particular order Image © Mordor Intelligence. Reuse requires attribution under CC BY 4.0. |
|
South Africa Courier, Express, And Parcel (CEP) Market Analysis by Mordor Intelligence
The South Africa courier, express, and parcel market size stands at USD 627.80 million in 2025 and is projected to reach USD 887.91 million by 2030, expanding at a 7.18% CAGR between 2025-2030. Improving trade links under AfCFTA, rapid urbanization, and more sophisticated digital sales channels are combining to keep demand for parcel movement buoyant despite persistent power outages and road congestion. Domestic operators continue to leverage extensive road networks and diversified pickup-point ecosystems, while international integrators concentrate on air-express and cross-border volumes that yield higher margins. Heavy investment in electric vans, smart locker grids, and route-optimization software signals a structural pivot toward greener and more data-driven fulfillment systems. Cost pressure remains, yet scale economics coupled with growing healthcare and B2B e-commerce flows point to new service niches capable of underpinning steady returns across economic cycles.
Key Report Takeaways
- By destination, domestic services captured 64.76% of the South Africa courier, express, and parcel market share in 2024; international services are advancing at a 7.44% CAGR between 2025-2030.
- By speed of delivery, non-express held 75.36% of the South Africa courier, express, and parcel market size in 2024, while express shipments are growing at 8.23% CAGR between 2025-2030.
- By business model, business-to-consumer (B2C) deliveries represented 54.75% of the South Africa courier, express, and parcel market in 2024; consumer-to-consumer (C2C) is the fastest-rising model at 4.83% CAGR between 2025-2030.
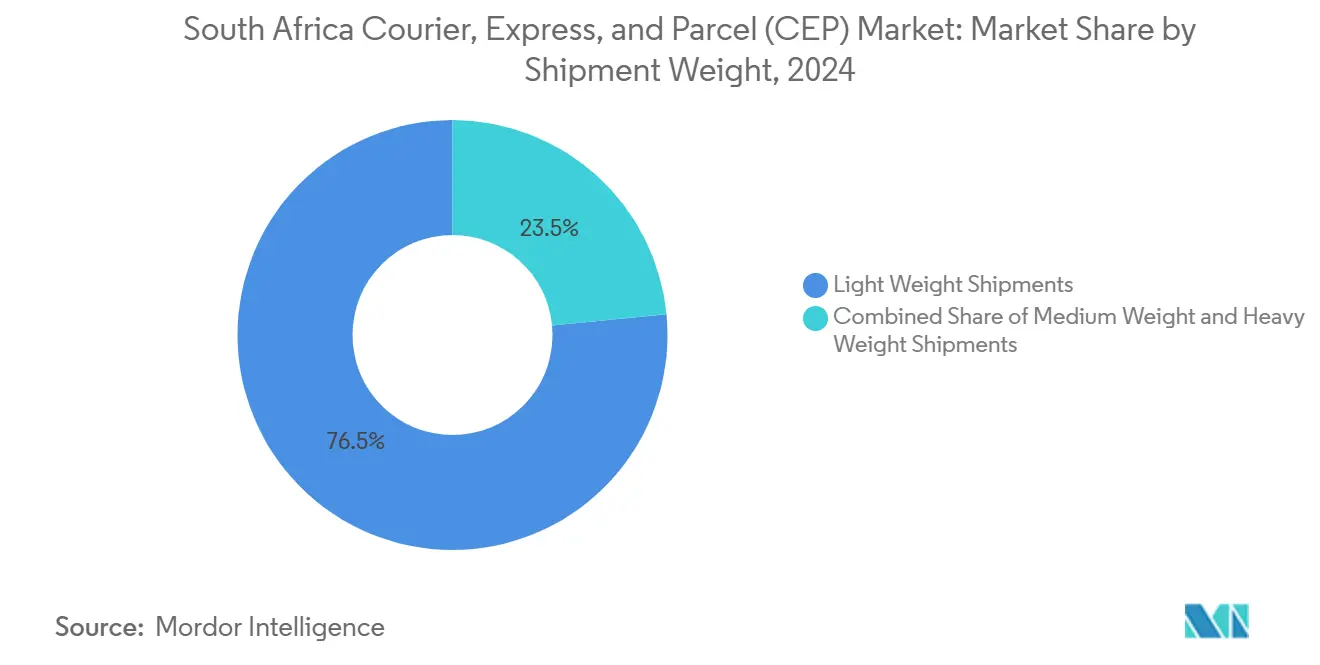
- By shipment weight, light weight parcels accounted for 76.53% of total revenue share in 2024; medium weight parcels are expanding most quickly at 5.38% CAGR between 2025-2030.
- By mode of transport, road carried 78.57% of 2024 consignments; air cargo is increasing at 6.10% CAGR between 2025-2030, supported by OR Tambo International Airport’s capacity upgrades.
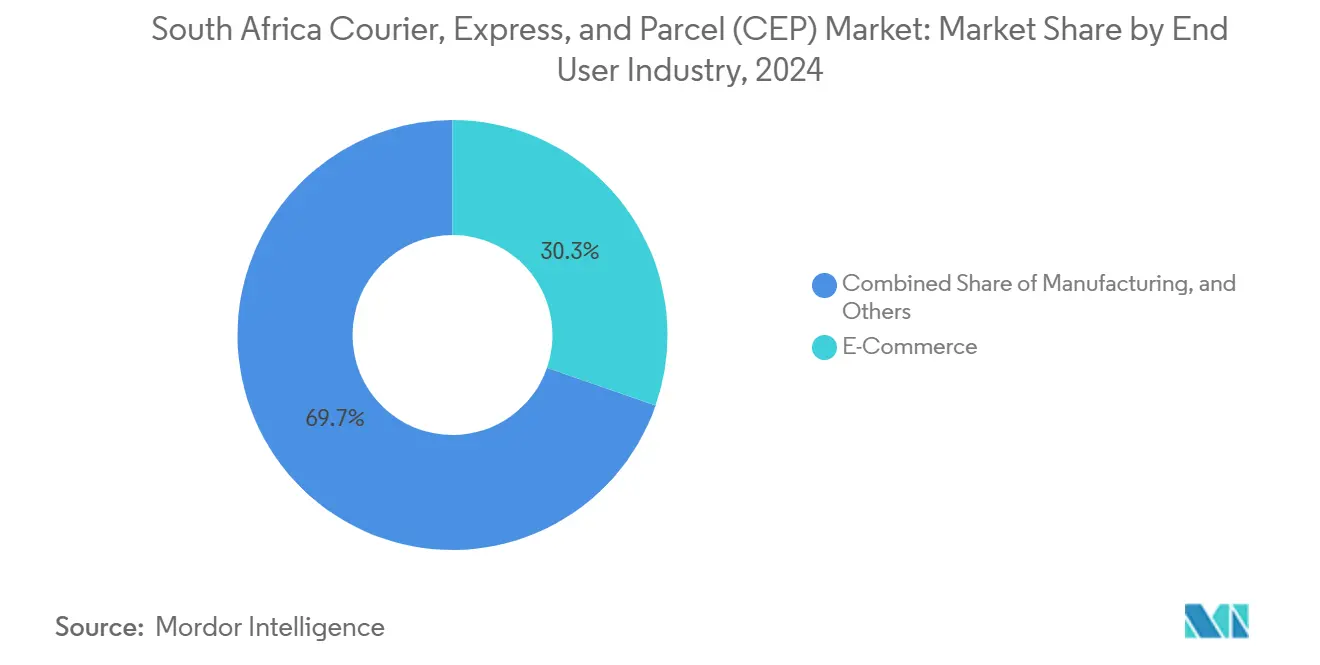
- By end user industry, e-commerce generated 30.32% of 2024 revenue; healthcare is forecast to post a 7.54% CAGR between 2025 and 2030.
South Africa Courier, Express, And Parcel (CEP) Market Trends and Insights
Drivers Impact Analysis
| Driver | (~) % Impact on CAGR Forecast | Geographic Relevance | Impact Timeline |
|---|---|---|---|
| Rapid expansion of e-commerce and on-demand delivery volumes | +2.1% | National, with concentration in Gauteng, Western Cape, KwaZulu-Natal | Short term (≤ 2 years) |
| Regulatory pressure to improve on-time delivery and tracking (Postal Services Amendment Bill) | +1.3% | National | Medium term (2-4 years) |
| Adoption of digital route optimization and gig-driver platforms reducing last-mile costs | +1.8% | Urban centers: Johannesburg, Cape Town, Durban | Short term (≤ 2 years) |
| Infrastructure upgrades at OR Tambo Air Cargo Terminal boosting air-express capacity | +0.9% | National, with spillover to SADC region | Medium term (2-4 years) |
| Rising intra-Africa trade via AfCFTA corridors positioning Johannesburg as a parcel hub | +1.2% | National, with regional impact across Southern Africa | Long term (≥ 4 years) |
| Corporate sustainability mandates pushing for electric vans and micro-fulfillment models | +0.7% | Urban centers with early adoption in Cape Town, Johannesburg | Long term (≥ 4 years) |
| Source: Mordor Intelligence | |||
Rapid Expansion of E-commerce and On-Demand Delivery Volumes
Mobile shopping now drives more than 70% of online transactions, powered by falling data costs and a sophisticated app-based payments stack. Platform entrants such as Amazon and Shein have raised consumer expectations for next-day fulfillment, triggering a wave of micro-fulfillment center launches around Johannesburg and Cape Town. Domestic leaders respond with smart-locker pick-ups that lower failed delivery rates and cut urban traffic dwell times. Cross-border e-commerce flows into Botswana, Namibia, and Zimbabwe are accelerating, reinforcing Johannesburg’s status as a regional re-export hub. The overall effect is a wider and more predictable parcel stream that supports network densification and drives volume discounts on air-cargo lanes[1]“President Ramaphosa Assents to South African Post Office SOC Ltd Amendment Bill,” The Presidency, thepresidency.gov.za.
Regulatory Pressure to Improve On-Time Delivery and Tracking
The South African Post Office Amendment Act of 2024 eliminates exclusive small-parcel rights and obliges the national operator to partner with private carriers. In parallel, ICASA’s new performance framework mandates real-time scan events and end-to-end visibility for licensed courier firms, pushing the sector toward uniform service metrics. A unified address database initiative aims to alleviate routing inefficiencies in townships and rural settlements where street naming is inconsistent. Compliance costs are significant, yet carriers that achieve 98%-plus on-time scores, such as DSV, already use service quality as a differentiator during corporate tenders[2]“Air Cargo Africa Exhibition Press Release,” Airports Company South Africa, airports.co.za.
Adoption of Digital Route Optimization and Gig-Driver Platforms Reducing Last-Mile Costs
Local tech providers integrate live traffic, fuel, and toll data to model the lowest-cost travel path between successive drop nodes. When combined with crowdsourced couriers, fleets can flex output up to 30% during peak promotional events without expanding fixed payrolls. Uber reports that South African drivers and couriers earned ZAR 2.3 billion (USD 125.58 million) in 2023, channeling under-utilized vehicles into logistics tasks at scale. Vehicle subscription plans that bundle maintenance, insurance, and telematics lower entry barriers for owner-drivers, making on-demand capacity more predictable for parcel operators.
Infrastructure Upgrades at OR Tambo Air Cargo Terminal Boosting Air-Express Capacity
OR Tambo handled roughly 317,000 metric tons of freight in 2024, with expansion projects adding automated pallet-handling and temperature-controlled zones. UPS’s extended Asia–MEA network now connects via Sharjah, trimming transit to Johannesburg to two business days for many electronics and fashion SKUs. Concentrating 80% of the country’s air cargo at a single node delivers scale benefits, yet it also highlights the need for secondary hubs in Durban and Port Elizabeth to enhance resilience.
Restraints Impact Analysis
| Restraint | (~) % Impact on CAGR Forecast | Geographic Relevance | Impact Timeline |
|---|---|---|---|
| Persistent load-shedding disrupting distribution-centre operations | -1.4% | National, with severe impact in industrial areas | Short term (≤ 2 years) |
| High prevalence of informal addresses complicating last-mile delivery | -0.8% | National, concentrated in townships and rural areas | Medium term (2-4 years) |
| SAPO litigation to reserve ≤1 kg parcels creating legal uncertainty | -0.6% | National | Medium term (2-4 years) |
| Chronic rail and port bottlenecks increasing cross-border transit times | -0.9% | National, with spillover to SADC region | Long term (≥ 4 years) |
| Source: Mordor Intelligence | |||
Persistent Load-Shedding Disrupting Distribution-Center Operations
Unplanned electricity cuts stall automated sorters and force diesel-generator reliance, adding operating costs and carbon emissions. Battery-backed locker banks capable of five years off-grid mitigate the problem by shifting final-mile fulfilment away from door-to-door drops. Solar rooftop arrays are rapidly appearing at major Johannesburg depots, yet high upfront capital outlays deter smaller regional couriers. Power instability also threatens pharmaceutical cold-chain compliance, compelling carriers to invest in active temperature-control packaging that elevates shipment value but squeezes price-sensitive customer segments[3]“The African Continental Free Trade Area,” Government of South Africa, gov.za.
High Prevalence of Informal Addresses Complicating Last-Mile Delivery
Large swathes of the population reside in areas without formal street numbers, extending drop-times and inflating first-attempt failure rates. Parcel lockers at public clinics, fuel stations, and police precincts bridge this gap by clustering deliveries into single stops. Pargo’s network of more than 3,000 pick-up points demonstrates the scalability of click-and-collect in under-served regions. While the forthcoming national address database should standardize location information, its rollout requires municipal coordination that will likely span several budget cycles. Until then, crowdsourced mapping apps and SMS-based geocodes remain critical interim tools for couriers[4]“Transport and Communications Bulletin No. 78,” United Nations ESCAP, unescap.org.
Segment Analysis
By End User Industry: E-commerce Leads Healthcare Surge
E-commerce represented 30.32% of shipments in 2024, consolidating its role as the sector’s growth anchor. Apparel and consumer electronics dominate volume, while fast-moving consumer goods accelerate thanks to “buy-now-deliver-in-two-hours” offers in Cape Town and Johannesburg. Healthcare, expanding at 7.54% CAGR between 2025-2030, demands GDP-certified warehousing, active temperature logging, and secure chain-of-custody processes that command premium pricing. Specialized cold-chain parcels travel mostly by air and overnight road shuttles equipped with active coolers.
Manufacturing holds steady share through supplier-managed inventory programs that dispatch spare parts just ahead of assembly-line demand. Financial services leverage secure envelope couriers for same-day delivery of credit cards and legal documents. Overall diversification ensures the South Africa courier, express, and parcel market remains insulated from volatility in any single vertical.
Note: Segment shares of all individual segments available upon report purchase
By Destination: Cross-Border Growth Accelerates
Domestic consignments held 64.76% of the South Africa courier, express, and parcel market in 2024 as dense urban road networks favor fast, low-cost movement of goods between local merchants and consumers. International volumes, while smaller, are rising at a 7.44% CAGR between 2025-2030 and benefit from customs-cleared parcel hubs at OR Tambo, Durban, and Cape Town. Johannesburg’s consolidation role for goods transiting to Botswana, Namibia, and Mozambique strengthens as AfCFTA lowers tariff barriers and streamlines documentary processes. E-retailers targeting regional shoppers rely on bundled export lanes that collapse multiple same-day orders into a single airwaybill, cutting per-parcel cost and bypassing congested ports. Domestic operators adapt by forging alliances with cross-border specialists and by installing multi-currency payment gateways to reduce cart abandonment during international checkout.
The domestic segment’s scale advantage underpins network density, but urban congestion and fuel inflation erode margins. Carriers counter with dynamic rerouting engines that sequence stops based on live traffic and package urgency. Cross-border players seek ISO-certified warehouse zones near Beitbridge and Kazungula bridges to minimize border dwell times, extending competitive reach northward. End-of-runway facilities at OR Tambo increasingly serve as regional fulfillment nodes, allowing exporters to offer two-day delivery into Lusaka and Kinshasa, thereby expanding the overall South Africa courier, express, and parcel market.
By Speed of Delivery: Express Services Gain Momentum
Non-express still controlled 75.36% of the revenue share in 2024, yet express volumes are accelerating at 8.23% CAGR between 2025-2030 as next-day turnarounds become baseline for electronics, fashion, and personal-care SKUs. The premium sub-segment commands a higher yield per kilo, helping carriers recoup technology and aircraft charter costs. Key e-commerce portals now display real-time service-level pricing, nudging shoppers toward expedited delivery when stock-outs are imminent. Load-shedding and peak-hour traffic threaten service promises, so operators preload contingency routes and keep standby vans on opposite sides of major highways to avoid gridlock. Same-day pilots in Johannesburg’s northern suburbs post first-year average delivery windows of under three hours, illustrating latent demand for hyperlocal point-to-point fulfillment.
Rural express remains cost-intensive because lower parcel drop densities inflate last-leg mileage. Integrators partly offset this by staging consolidated overnight line-haul trucks to secondary nodes before switching to pickup trucks at dawn for final distribution. Take-up of real-time redelivery rescheduling is high among gig economy workers who are often only home during off-peak slots, demonstrating the value of flexible windows. Overall, service innovation in this segment keeps the South Africa courier, express, and parcel market driving operational excellence benchmarks.
By Shipment Weight: Light Parcels Dominate Evolving Mix
Light weight parcels deliver 76.53% of consignments, aligned with the cosmetics, phone-accessories, and small-appliances categories dominating online baskets. Medium-weight pieces (3–10 kg) are scaling quickest at 5.38% CAGR between 2025-2030 as home-office equipment, bulk pet food, and small furniture shift online. Locker station designs now incorporate wider apertures to fit midsize cartons, avoiding costly multiple-locker reservations per parcel. The South Africa courier, express, and parcel market size allocated to heavy freight remains niche, but healthcare, industrial spares, and event staging drive regular demand for 30 kg-plus packages that require mechanical handling equipment on delivery.
Light-parcel density enables foot-courier services in CBDs, cutting carbon output and parking fines. Growing medium-parcel traffic pushes fleet diversification toward panel vans with higher rooflines, improving cube utilization per liter of fuel burned. Operators monitor item-weight mix closely because medium parcels boost revenue per stop but cut total stops per route, affecting driver incentive models and overall wage economics.
Note: Segment shares of all individual segments available upon report purchase
By Mode of Transport: Road Dominance with Air Growth
Road carriage produced 78.57% of 2024 parcel-kilometers thanks to competitive trucking rates and flexible routing. Congestion on the N1 and N3 corridors plus rising diesel prices erode cost advantages, prompting renewed interest in intermodal strategies whenever rail reliability improves. Air freight’s 6.10% CAGR between 2025-2030 reflects expanding express duty, time-critical spares, and temperature-controlled pharmaceuticals that demand airport-to-door service within 48 hours. Consolidation of cargo at OR Tambo provides network synergies; however, single-hub dependency amplifies risk from security delays and weather disruptions.
Electric vehicle pilots for final-mile drops reduce fuel spend and comply with corporate decarbonization pledges, yet grid instability limits depot charging schedules. Longer-term, the National Logistics Crisis Committee’s corridor upgrades could coax containerized parcel flows toward rail-road transfers, freeing highway capacity for last-mile vans. Such modal rebalancing would foster environmentally aligned growth across the South Africa courier, express, and parcel market.
By Model: B2C Dominance with C2C Emergence
B2C retained 54.75% share in 2024, propelled by omnichannel retailers and marketplace sellers that account for the bulk of mobile checkout traffic. Returns policies are tightening: fashion portals now demand 48-hour turnaround from doorstep pick-up to warehouse scanning to improve refund speed. C2C exchanges, aided by social-commerce ecosystems inside Instagram and TikTok, produce small, high-frequency consignments that seldom fit rigid pickup windows. Couriers respond with booking slots at metro rail stations and petrol forecourts, allowing senders to hand over goods outside office hours. Linked insurance add-ons mitigate perceived risk and generate fee opportunities. B2B movement stays resilient across auto parts, chemicals, and spares replenishment, where just-in-time workflows depend on predictable cut-off times for regional air and consolidated trunk routes.
The emerging C2C category reshapes service design, set to grow at a CAGR of 4.83% between 2025-2030: scalable identity verification, escrow payments, and tamper-evident packaging become differentiators. Carriers providing app-based origin quotes gain traction among casual sellers, lowering entry friction. Hybrid fulfillment—where a merchant stores inventory at the courier’s micro-hub but maintains own front-end—blurs B2C and C2C boundaries yet anchors sticky volumes that reinforce the South Africa courier, express, and parcel market’s long-run sustainability.
Geography Analysis
Gauteng generates nearly 37% of national GDP and anchors 60% of export trade, establishing Johannesburg as the epicenter of parcel sortation and trunking. OR Tambo’s proximity to City Deep Inland Container Terminal lets couriers cross-dock imports within hours, compressing customs-release-to-out-for-delivery time. Western Cape’s e-commerce ecosystem skews toward fresh produce and wine; frequent fog and port congestion at Cape Town nudge merchants to employ air-cargo work-arounds, lifting the region’s express share. KwaZulu-Natal relies on Durban harbor, but chronic berth delays spur interest in inland rail shuttles linking the port to Pietermaritzburg depots where same-day parcel injection is possible.
Secondary provinces trail on volume yet present green-field locker opportunities in malls and government service centers. Rural postal agencies often double as parcel pick-up counters, extending carrier reach at minimal overhead. AfCFTA ratification has positioned Johannesburg as a preferred transshipment hub for southern corridor traffic heading to Lusaka, Windhoek, and Gaborone.
The completed Kazungula Bridge over the Zambezi cuts cross-border drive-times by 6 hours, bolstering intra-Africa express demand. Despite gains, customs harmonization gaps and intermittent border ICT outages still hamper seamless parcel tracking. Future growth thus hinges on step-wise digital synchronization among revenue authorities across SADC.
Competitive Landscape
The market remains moderately consolidated: the top five players account significant share of total revenue, leaving room for regional specialists and tech-enabled disruptors. DHL and UPS reinforce air-express leadership through network alignments and sustainable aviation fuel pilots, while UPS’s Sharjah routing transfer slashes Asia–South Africa transit times. Domestic champion The Courier Guy, backed by Adenia Partners since 2024, scales pudo smart-locker installations to more than 1,200 sites, enhancing first-attempt delivery success in peri-urban catchments. RAM Hand-to-Hand deepens its alliance with DHL for outbound international parcels, leveraging global scan visibility without duplicating aircraft lift.
Technology adoption is the keystone of differentiation. Carriers deploy artificial-intelligence forecasting to stage inventory closer to buyers, thus narrowing delivery windows without bloating fleet size. Electric-van trials in Cape Town’s CBD suggest 20% fuel savings and lower maintenance downtime, tempting other operators to follow. Still, high battery import duties temper rapid fleet turnover.
Mergers and partnerships are likely as stricter ICASA performance metrics raise compliance costs for smaller firms. The overall narrative points to steady consolidation yet leaves ample space for niche operators serving pharmaceuticals, bulky furniture, or ultra-fast grocery top-ups—segments growing more quickly than headline volume averages.
South Africa Courier, Express, And Parcel (CEP) Industry Leaders
-
The Courier Guy
-
DHL Group
-
RAM Hand-to-Hand Couriers
-
Aramex
-
United Parcel Service of America, Inc. (UPS)
- *Disclaimer: Major Players sorted in no particular order
Recent Industry Developments
- October 2024: UPS enhanced its Asia Pacific air network via Sharjah, enabling two-business-day delivery from select Chinese and Korean cities into Johannesburg and Cape Town.
- September 2024: DHL Group unveiled Strategy 2030 targeting 50% revenue growth and a pronounced push into e-commerce and life-sciences logistics, with new investment earmarked for South African fleet electrification.
- April 2024: RAM Hand-to-Hand Couriers updated Standard Terms & Conditions and reaffirmed its partnership with DHL Express, extending international service coverage to more than 220 destinations.
- March 2024: Adenia Partners acquired The Courier Guy, unlocking capital to expand pudo smart-locker coverage across metropolitan and rural South Africa.
South Africa Courier, Express, And Parcel (CEP) Market Report Scope
Domestic, International are covered as segments by Destination. Express, Non-Express are covered as segments by Speed Of Delivery. Business-to-Business (B2B), Business-to-Consumer (B2C), Consumer-to-Consumer (C2C) are covered as segments by Model. Heavy Weight Shipments, Light Weight Shipments, Medium Weight Shipments are covered as segments by Shipment Weight. Air, Road, Others are covered as segments by Mode Of Transport. E-Commerce, Financial Services (BFSI), Healthcare, Manufacturing, Primary Industry, Wholesale and Retail Trade (Offline), Others are covered as segments by End User Industry.| Domestic |
| International |
| Express |
| Non-Express |
| Business-to-Business (B2B) |
| Business-to-Consumer (B2C) |
| Consumer-to-Consumer (C2C) |
| Heavy Weight Shipments |
| Light Weight Shipments |
| Medium Weight Shipments |
| Air |
| Road |
| Others |
| E-Commerce |
| Financial Services (BFSI) |
| Healthcare |
| Manufacturing |
| Primary Industry |
| Wholesale and Retail Trade (Offline) |
| Others |
| Destination | Domestic |
| International | |
| Speed of Delivery | Express |
| Non-Express | |
| Model | Business-to-Business (B2B) |
| Business-to-Consumer (B2C) | |
| Consumer-to-Consumer (C2C) | |
| Shipment Weight | Heavy Weight Shipments |
| Light Weight Shipments | |
| Medium Weight Shipments | |
| Mode of Transport | Air |
| Road | |
| Others | |
| End User Industry | E-Commerce |
| Financial Services (BFSI) | |
| Healthcare | |
| Manufacturing | |
| Primary Industry | |
| Wholesale and Retail Trade (Offline) | |
| Others |
Market Definition
- Courier, Express, and Parcel - The Courier, Express, and Parcel services, often called as CEP Market, refers to the logistics and postal service providers which specialize in moving small goods (parcels/packages). It captures the overall market size (USD) and market volume (number of parcels) of (1) the shipments/parcels/packages which are under 70kgs/ 154lbs weight, (2) Business Customer packages viz. Business-to-Business (B2B) & Business-to-Consumer (B2C) as well as private customer packages (C2C), (3) non-express parcel delivery services (Standard and Deferred) as well as express parcel delivery services (Day-Definite-Express and Time-Definite-Express), (4) domestic as well as international shipments.
- Demographics - To analyse total addressable market demand, population growth & forecasts have been studied and presented in this industry trend. It represents population distribution across categories like gender (male/female), development area (urban/rural), major cities among other key parameters like population density and final consumption expenditure (growth and share % of GDP). This data has been used for assessing the fluctations in demand & consumption expenditure, and the major hotspots (cities) of potential demand.
- Domestic Courier Market - Domestic Courier Market refers to the CEP shipments wherein the origin and destination is within the boundary of the geography studied (country or region as per the scope of report). It captures the market size (USD) and market volume (number of parcels) of (1) the shipments/parcels/packages which are under 70kgs/ 154lbs weight, including light weight shipments, medium weight shipments and heavy weight shipments (2) Business Customer packages viz. Business-to-Business (B2B) & Business-to-Consumer (B2C) as well as private customer packages (C2C), (3) non-express parcel delivery services (Standard and Deferred) as well as express parcel delivery services (Day-Definite-Express and Time-Definite-Express).
- E-Commerce - This end user industry segment captures the external (outsourced) logistics expenditure incurred by the e-tailers, through online sales channel, on Courier, Express, and Parcel (CEP) services. The scope includes (i) the supply chain of a company's online customer orders being fulfilled, (ii) the process of getting a product from the point of manufacturing to the point at which it is delivered to consumers. It involves managing inventory (deferred as well as time critical), shipping, and distribution.
- Export Trends and Import Trends - Overall logistics performance of an economy is positively and significantly (statistically) correlated to its trade performance (exports and imports). Hence, in this industry trend, total value of trade, major commodities/ commodity groups and the major trade partners, for the studied geography (country or region as per the scope of report) have been analysed alongside the impact of major trade/logistics infrastructure investments & regulatory environment.
- Financial Services (BFSI) - This end user industry segment captures the external (outsourced) logistics expenditure incurred by the BFSI players, on Courier, Express, and Parcel (CEP) services. CEP is important to the financial services industry in shipping of confidential documents and files. The establishments in this sector are engaged in (i) financial transactions (that is, transactions involving the creation, liquidation, or change in ownership of financial assets) or in facilitating financial transactions, (ii) financial intermediation, (iii) the pooling of risk by underwriting annuities and insurance, (iv) providing specialized services that facilitate or support financial intermediation, insurance and employee benefit programs, and (v) monetary control - the monetary authorities.
- Fuel Price - Fuel price spikes can cause delays and diruption for logistics service providers (LSPs), while drops in the same can result in higher short-term profitability and increased market rivalry to offer consumers with the best deals. Hence, the fuel price variations have been studied over the review period and presented along with the causes as well as market impacts.
- GDP Distribution by Economic Activity - Nominal Gross Domestic Product and distribution of the same, across major economic sectors in the geography studied (country or region as per scope of the report) have been studied and presented in this industry trend. As GDP is positively related to the profitability and growth of logistics industry, this data has been used in adjunction to the input-output tables/ supply-use tables for analyzing the potential major contributing sectors towards the logistics demand.
- GDP Growth by Economic Activity - Growth of Nominal Gross Domestic Product across major economic sectors, for the geography studied (country or region as per scope of the report) have been presented in this industry trend. This data has been utilized for assessing the growth of logistics demand from all the market end users (economic sectors considered here).
- Healthcare - This end user industry segment captures the external (outsourced) logistics expenditure incurred by the Healthcare players (Hospitals, clinics, mrdical centres) , on Courier, Express, and Parcel (CEP) services. The scope includes CEP services involved in the defrerred as well time critical movement of medical goods & supplies (surgical supplies and instruments, including gloves, masks, syringes, equipment). The establishments in this sector (i) include the ones providing medical care exclusively (ii) deliver services by trained professionals (iii) involve processes, including labor inputs of health practitioners with the requisite expertise (iv) are defined based on the educational degree held by the practitioners included in the industry.
- Inflation - Variations in both Wholesale Price Inflation (YoY change in producer price index) and Consumer Price Inflation have been presented in this industry trend. This data has been used to assess the inflationary environment as it plays a vital role in smooth functioning of the supply chain, directly impacting the logistics operational cost components e.g., pricing of tyres, driver wages & benefits, energy/fuel prices, maintenace costs, toll charges, warehousing rents, custom brokerage, forwarding rates, courier rates etc. hence impacting the overall freight and logistics market.
- Infrastructure - As infrastructure plays a vital role in an economy's logistics performance, variables like length of roads, distribution of road length by surface category (paved v/s unpaved), distribution of road length by road classification (expressways v/s highways v/s other roads), rail length, volume of containers handled by major ports and tonnage handled by major airports have been analysed and presented in this industry trend.
- International Express Service Market - International Express Service Market refers to the CEP shipments wherein the origin or destination is not within the boundary of the geography studied (country or region as per the scope of report). It captures the market size (USD) and market volume (number of parcels) of (1) the shipments/parcels/packages which are under 70kgs/ 154lbs weight, including light weight shipments, medium weight shipments and heavy weight shipments (ii) Inter-Region as well as Intra-Region Shipments
- Key Industry Trends - The report section named "Key Industry Trends" include all the key variables/parameters studied to better analyze the market size estimates and forecasts. All the trends have been presented in the form of data points (time series or latest available data points) along with analysis of the paramter in the form of concise market relevant commentary, for the geography studied (country or region as per the scope of report).
- Key Strategic Moves - The action taken by a company to differentiate from its competitor or used as a general strategy is referred to as a key strategic move (KSM). This includes (1) Agreements (2) Expansions (3) Financial Restructuring (4) Mergers and Acquisitions (5) Partnerships, and (6) Product Innovations. Key players (Logistics Service Providers, LSPs) in the market have been shortlisted, their KSM have been studied and presented in this section.
- Logistics Performance - Logistics Performance and Logistics Costs are the backbone of trade, and influences trade costs, making countries compete globally. Logistics performance is influenced by market wide adopted supply chain management strategies, government services, investments & policies, fuel/ energy costs, inflationary environment etc. Hence, in this industry trend, the logistics performance of the geography studied (country/ region as per the scope of report) has been analysed and presented over the review period.
- Manufacturing - This end user industry segment captures the external (outsourced) logistics expenditure incurred by the Manufacturing industry (including Hi-Tech/Technology) players, on Courier, Express, and Parcel (CEP) services. The end user players considered are the establishments primarily engaged in the chemical, mechanical or physical transformation of materials or substances into new products. Logistics Service Providers (LSPs) play a crucial role in maintaining a smooth flow of raw materials across the supply chain, enabling timely delivery of finished goods to distributors or end customers and storing & supplying the raw materials to clients for just-in-time manufacturing.
- Other End Users - Other end user segment captures the external (outsourced) logistics expenditure incurred by the construction, real estate, educational services, and professional services (administrative, waste management, legal, architectural, engineering, design, consulting, scientific R&D), on Courier, Express, and Parcel (CEP) services. Logistics Service Providers (LSPs) plays a crucial role in the reliable movement of time critical supplies and documents to/from these industries such as transporting any equipment or resources required, shipping confidential documents and files.
- Primary Industry - This end user industry segment captures the external (outsourced) logistics expenditure incurred by the AFF (Agriculture, Fishing, and Forestry) and Extraction indsutry (Oil &Gas, Quarrying and Mining) players, on Courier, Express, and Parcel (CEP) services. The end user players considered are the establishments (i) primarily engaged in growing crops, raising animals, harvesting timber, harvesting fish & other animals from their natural habitats and providing related support activities; (ii) that extract naturally occurring mineral solids, such as coal and ores; liquid minerals, such as crude petroleum; and gases, such as natural gas. Herein, Logistics Service Providers (LSPs) (i) play a crucial role in acquisition, storage, handling, transportation, and distribution activities for the optimal & continuous flow of inputs (seeds, pesticides, fertilizers, equipment, and water) from manufacturers or suppliers to the producers and smooth flow of output (produce, agro-goods) to distributors/ consumers; (ii) cover entire phases from upstream to downstream and play a crucial role in the transportation of machinery, drilling equipments, extracted minerals, crude oil & natural gas and refined/ processed products from one place to another. This includes both termperature controlled and non-temperature controlled logistics, as and when required according to the shelf life of goods being transported or stored.
- Producer Price Inflation - It indicates inflation from viewpoint of the producers viz. the average selling price received for their output over a period of time. Annual change (YoY) of producer price index is reported as wholesale price inflation in the "Inflation" industry trend. As WPI captures dynamic price movements in most comprehensive way, it is widely used by governments, banks, industry, business circles and is deemed important in formulation of trade, fiscal and other economic policies. The data has been used in adjunction to consumer price inflation for better understanding the inflationary environment.
- Segmental Revenue - Segmental Revenue has been triangulated or computed and presented for all the major players in the market. It refers to the courier, express, and parcel (CEP) market specific revenue earned by the company, over the base year of study, in the geography studied (country or region as per the scope of report). It is computed through the study and analysis of major parameters like financials, service portfolio, employee strength, fleet size, investments, number of countries present in, major economies of concern, etc. that have been reported by the company in its annual reports, webpage. For companies having scarce financial disclosures, paid databases like D&B Hoovers, Dow Jones Factiva have been resorted to and verified through industry/expert interactions.
- Transport and Storage Sector GDP - Value and growth of Transport and Storage Sector GDP has a direct relation to the freight and logistics market size. Hence, this variable has been studied and presented over the review period, in value terms (USD) and as share % of total GDP, in this industry trend. The data has been supported by concise and relevant commentary around the investments, developments, and current market scenario.
- Trends in E-Commerce Industry - Enhanced internet connectivity and boom in smartphone penetration, coupled with increasing disposable incomes, has led to a phenomenal growth in the e-commerce market globally. Online shoppers require fast and efficient delivery of their orders leading to an increase in the demand for logistics services especially e-commerce fulfilment services. Hence, the Gross Merchandise Value (GMV), historial and projected growth, breakup of major commodity groups in e-commerce industry for the studied geography (country or region as per scope of the report) have been analysed and presented in this industry trend.
- Trends in Manufacturing Industry - Manufacturing industry involves the transformation of raw materials into finished products, while logistics industry ensures the efficient flow of raw materials to the factory, and the transport of manufactured products to the distributors & consumers. Demand-Supply of both industries are highly cross-linked and critical for a seamless supply chain. Hence, the Gross Value Added (GVA), breakup of GVA into major manufacturing sectors, and growth of manufacturing industry over the review period have been analysed and presented, in this industry trend.
- Wholesale and Retail Trade (Offline) - This end user industry segment captures the external (outsourced) logistics expenditure incurred by the wholesalers and retailers, through offline sales channel, on Courier, Express, and Parcel (CEP) services. The end user players considered are the establishments primarily engaged in wholesaling or retailing merchandise, generally without transformation, and rendering services incidental to the sale of merchandise. Logistics Service Providers (LSPs) plays a crucial role in the reliable movement of supplies to and finished products from production houses to the distributors and finally to the end customer covering activites like material sourcing, transportation, order fulfillment, warehousing & storage, demand forecasting, inventory management etc.
| Keyword | Definition |
|---|---|
| Axle Load | The axle load refers to the total load (weight) bearing on the roadway through wheels connected to a given axle. Across the globe, there are systems in place to ensure axle load monitoring, wherein surpassing the defined limits set by the concerned regulatory authority can lead to penalty/fine. For transportation of goods via road this can be an important determinant of costs as knowledge about the axle load limits can be used to (i) load the vehicle optimally for maximizing profits (ii) avoid exceeding the same and hence the probable fines associated (iii) avoid wear and tear of the vehicle (iv) avoid damage to pavement resulting in noticeable public maintenance and repair costs (v) achieve better turnaround time. |
| Back Haul | Backhaul is the return movement of a transport vehicle from its original destination to its original point of departure, and can include full, partial, or empty truck loads (all or part of the way) depending on the visibility of the local freight ecosystem. In this regard, transportation of empty containers to the point of origin, known as deadheading is also a significant factor, considering the supply/container shortages across the geographies, resulting in cost escalation and under optimized profit potential attainment. Generally, the carriers offer discounts on the backhaul, to secure freight for the trip. |
| Bill of Lading (BOL) | A bill of lading is a legal contract document issued by a carrier to a shipper to acknowledge reception of their cargo, and is evidence for the contract of carriage between the two parties. Broadly it details the (i) type, quantity, and other specifications of the goods being carried (ii) destination, and terms & conditions of the shipment (iii) carrier and drivers with all the necessary information to process the shipment, which can be used for insurance and customs clearance purposes (iv) assurance that the consignment is damage-free and ready to be shipped to the consignee. In this regard, a house bill of lading (HBL) is a document issued by a freight forwarder or a non-vessel operating common carrier (NVOCC) to acknowledge receipt of items for shipment (to a shipper). If shipments from several shippers are involved a master bill of lading (MBL) might be involved which is a consolidated version of the same for all the shipments being taken care of by the carrier (to a common destination) and might be issued by the carrier to the freight forwarder or the shipper (depending on who books the transport). |
| Bunkering | Bunkering is the process of supplying fuel to power the propulsion system of a ship. It includes the logistics of loading and distributing the fuel among available shipboard tanks. In this regard, (i) Bunker fuel is technically any type of fuel oil used aboard ships. It gets its name from the containers on ships and in ports that it is stored in; in the days of steam they were coal bunkers but now they are bunker-fuel tanks, (ii) Bunker refers to the spaces (Tank) on board a vessel to store fuel, (iii) Bunker trader refers to a person dealing in trade of bunker (fuel), (iv) Bunker call is made when a cargo ship anchors or berths in a port to take on bunker oil or supplies, (v) Bunkering service is the supply of a requested quality and quantity of bunkers to a ship. Bunkering is signficant from point of view of freight rates applicable to the shipper as Bunker Contribution (BUC)/ Fuel Adjustment Factor (FAF)/ Bunker Adjustment Factor (BAF) are applied by shipping lines to offset the effect of fluctuations in the cost of bunkers. |
| Cabotage | Transport by a vehicle registered in a country, performed on the national territory of another country. Cabotage law may restrict domestic cargo traffic to be carried in its own nationally registered, and sometimes built and crewed vehicles, though regulations vary across industries/commodity groups/countries and sometimes specify maximum allowable percentage of cabotage that can be serviced by foreign registered fleet. |
| C-commerce | Collaborative commerce (also known as C-commerce), (i) describes electronically enabled business interactions among an enterprise’s internal personnel, business partners and customers throughout a trading community (industry, industry segment, supply chain or supply chain segment); (ii) is the optimization of supply and distribution channels to capitalize on the global economy by using new technology efficiently. Advantages of C-commerce, to detail few include (i) maximization of organization's efficiency and profitability (ii) technology integration with physical channels to allow companies to work together (iii) increased information exchange such as inventory and product specifications, using the web as an intermediary (iv) increased competitiveness by reaching a broader audience. Examples of C-commerce, also known as peer-to-peer commerce, include (i) companies that allow consumers to rent things from each other, or marketplaces, such as Meta (formerly Facebook) Marketplace, that allow the sale of used goods; (ii) DoorDash teamed up with many national brands, such as McDonald’s and Chipotle, to offer fast food delivery, building their business model on c-commerce. They have since expanded their delivery service from restaurants to retailers and even offer 'fleets' of drivers to businesses. |
| Courier | A business/company that delivers packages/parcels/shipments (upto 70 kgs) including quick door to door pickup and delivery service for goods or documents, domestically or internationally, on a commercial contract basis. Example, DHL Group, FedEx, United Parcel Service of America, Inc., USPS, International Distributions Services, J&T Express, SF Express among several others |
| Cross docking | Cross docking is a practice in logistics management that includes unloading incoming delivery vehicles and loading the materials directly into outbound delivery vehicles, omitting traditional warehouse logistical practices and saving time and money. It requires close synchronization of both inbound and outbound movements. It is highly significant in reduction of costs pertaining to warehousing & storage (and the associated Value Added Services). |
| Cross Trade | International transport between two different countries performed by a vehicle registered in a third country. A third country is a country other than the country of loading/embarkation and the country of unloading/disembarkation. Cross Trade law may restrict international cargo traffic to be carried by respective country's registered vehicles, and sometimes built and crewed vehicles, though regulations vary across industries/commodity groups/countries and sometimes specify maximum allowable percentage of cross trade that can be serviced by foreign registered fleet. |
| Customs Clearance | The process of declaring and clearing cargoes through customs. It includes the procedures involved in getting cargo released by Customs through designated formalities such as presenting import license/permit, payment of import duties and other required documentations by the nature of the cargo. In this regard, a customs broker is a person or company licensed by the respective department of the country to act on behalf of freight importers and exporters. |
| Dangerous Goods | Dangerous goods (or hazardous materials or HAZMAT) include flammable liquids/solids, gases (compressed, liquified, dissolved under pressure), corrosives, oxidising substances, explosive substances and articles, substances which on contact with water emit flammable gasses, organic peroxides, toxic substances, infectious substances, radioactive materials, miscellaneous dangerous goods and articles. |
| First mile Delivery | First mile delivery refers to the (i) first stage of the freight/shipment/cargo/courier transportation (ii) the transportation of goods from a merchant’s premises or warehouse to the next fulfillment centre/warehouse/hub from where the goods are forwarded (iii) shipping goods from local distribution centers to stores (For retailers) (iv) transportation of finished goods from a plant or a factory to a distribution center (For manufacturers), (v) pick up of goods from the end-customer’s home or store followed by movement to a warehouse or storage location (movers and packers), (vi) process where goods are picked up from a retailer and then transferred to third-party logistics providers or courier service providers to be delivered to the end-consumer (e-commerce). Once the package reaches the next warehouse or the courier’s hub, it is then sorted and transported further until it reaches the customer’s doorstep. Example, if one chooses UPS as a courier, first-mile delivery will be the product being delivered from manufacturer's/retailer's warehouse to the UPS’s warehouse/ fulfilment centre. |
| Last Mile Delivery | Last mile delivery refers to the very last step of the delivery process when a parcel is moved from a transportation hub (warehouse or a distribution center or fulfillment centre) to its final destination, which usually is a personal residence/retail store/ business, or parcel locker. It accounts for around half of the total cost involved in entire process of first mile, middle mile, and last mile delivery, though it can vary shipment to shipment, based on commodity, business model and similar factors. |
| Milkrun | A Milk Run is a delivery method used to transport mixed loads from various suppliers to one customer, using lean management principles applied to logistics. Instead of each supplier sending a truck every week to meet the needs of one customer, one truck (or vehicle) visits the suppliers to pick up the loads for that customer. This method of transport got its name from the dairy industry practice, where one tanker used to collect milk from several dairy farms for delivery to a milk processing company. A milk run can be a more efficient way to handle logistics but require proper planning. If the route involves products from different companies, there is need for an agreement about cost-sharing and other aspects of the cooperative delivery arrangement. Once the group settles these issues, this delivery method can save time and money for everyone by pooling operation costs and resources. |
| Multi country consolidation | Multi-Country Consolidation (MCC) is a cost-effective solution that consolidates one's cargo from different countries of origin to build Full Container Loads (FCL). MCC is most suitable for companies that import light volumes of goods from multiple countries but want to take advantage of the more economic FCL freight rates. Apart from costing some of the other advantages include (i) flexibility to choose suppliers from a wider range of origin countries without worrying about the logistics to final destination from each origin, (ii) ability to pick the most suitable suppliers from many different countries for one's business operations. The increase in one's sourcing options by MCC provides the kind of flexibility needed in competitive global markets. |
| Q-commerce | Q-commerce, also referred to as quick commerce, is a type of e-commerce where emphasis is on quick deliveries, typically in less than an hour. The companies providing Q-Commerce services might have vertically intergrated model or might be using third party delivery platforms (outsourced logistics). It has advantages like (i) competitve USP, (ii) potential to earn greater profit margins, (iii) better customer experience, (iv) guaranteed availability of products, (v) traceability, and (vi) scaleability. |
| ReverseLogistics | Reverse logistics is a type of supply chain management that moves goods from customers back to the sellers or manufacturers and may involve ciruclar economy principles (3Rs) viz. recycling, reuse (repurposing, reselling), reducing or repairing. In this regard, reverse commerce (or Recommerce) is the selling of previously owned items through physical or online marketplaces/distribution channels to buyers who reuse, recycle or resell them. |
Research Methodology
Mordor Intelligence follows a four-step methodology in all our reports.
- Step-1: Identify Key Variables: In order to build a robust forecasting methodology, the variables and factors identified in Step-1 are tested against available historical market numbers. Through an iterative process, the variables required for market forecast are set and the model is built on the basis of these variables.
- Step-2: Build a Market Model: Market-size estimations for the forecast years are in nominal terms. Inflation is considered to be a part of the pricing, and the average selling price (ASP) is varying throughout the forecast period for each country
- Step-3: Validate and Finalize: In this important step, all market numbers, variables and analyst calls are validated through an extensive network of primary research experts from the market studied. The respondents are selected across levels and functions to generate a holistic picture of the market studied.
- Step-4: Research Outputs: Syndicated Reports, Custom Consulting Assignments, Databases & Subscription Platforms


