
| Study Period | 2017 - 2030 |
| Base Year For Estimation | 2024 |
| Forecast Data Period | 2025 - 2030 |
| Market Size (2025) | USD 1.95 Billion |
| Market Size (2030) | USD 2.66 Billion |
| CAGR (2025 - 2030) | 6.44 % |
| Market Concentration | Medium |
Major Players*Disclaimer: Major Players sorted in no particular order |


South Africa Confectionery Market Analysis
The South Africa Confectionery Market size is estimated at 1.95 billion USD in 2025, and is expected to reach 2.66 billion USD by 2030, growing at a CAGR of 6.44% during the forecast period (2025-2030).
The confectionery market in South Africa is experiencing significant transformation driven by digitalization and changing consumer behaviors. With 43.48 million internet users representing a 72% penetration rate in 2023, digital channels are reshaping how consumers purchase confectionery products. The rise of social media, reaching 25.80 million users or 42.9% of the population, has revolutionized product discovery and marketing strategies. The increasing adoption of digital payment solutions is evident, with 76% of consumers familiar with online banking and digital transactions in 2022, facilitating seamless online purchases.
The retail landscape for confectionery products continues to evolve, with both traditional and modern channels adapting to changing consumer preferences. The market is characterized by a robust retail infrastructure comprising 4,018 supermarkets across the country, led by major chains like Shoprite and Pick n Pay. The convenience store segment has witnessed significant expansion, with retail partnerships at forecourts growing by 69% over five years to reach 745 stores in 2022. This expansion reflects the growing consumer demand for accessible purchase points and immediate consumption options.
Health consciousness and dietary preferences are reshaping product innovations in the confectionery industry. A notable 66% of South African consumers have expressed interest in plant-based products, prompting manufacturers to expand their offerings. This trend is exemplified by Lindt's introduction of vegan chocolate variants in 2023, catering to the growing plant-based consumer segment. The market is also witnessing increased demand for functional confectionery products, particularly among the fitness-conscious population, with approximately 3 million gym and fitness club members recorded in 2022.
Local manufacturing capabilities are strengthening, marking a significant shift in the confectionery market dynamics. The establishment of South Africa's first local chewing gum manufacturing facility by Richester Foods represents a milestone in reducing import dependency. This development not only enhances domestic production capabilities but also enables better customization of products to local preferences. The facility's modern infrastructure, capable of producing approximately 600 sachets per minute, demonstrates the market's potential for local manufacturing excellence and innovation in meeting consumer demands.
South Africa Confectionery Market Trends
The emerging trend of gifting chocolate on birthdays, anniversaries, and other life events is propelling the confectionery market to grow
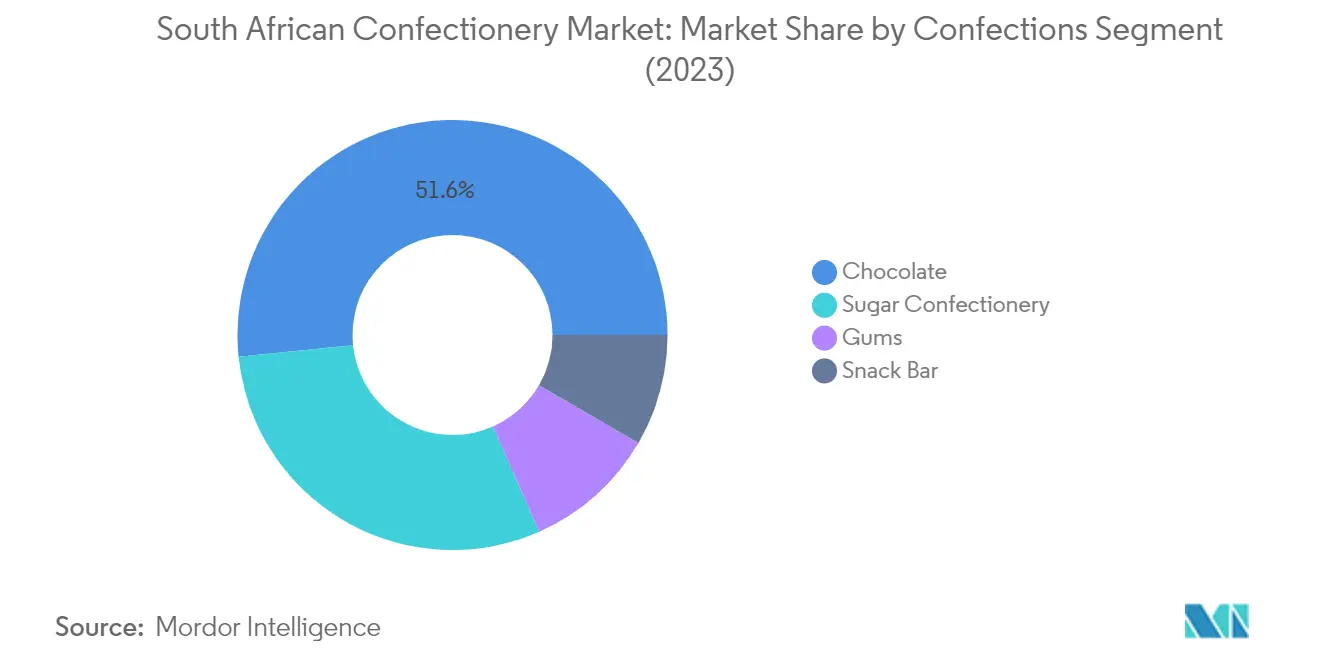
- South Africa remains the prominent confectionery-consuming country in Africa. Sugar confections are largely consumed in the country, followed by chocolates. The emerging trend of gifting chocolate on birthdays, anniversaries, and other life events drives the consumption of milk chocolates and dark chocolates.
- Creative advertisement campaigns and packaging are the most prominent factors influencing the impulse buying of confectionery in the region. Consumers continuously scrutinize labels and contents to make healthy choices about their sugar confectionery intake.
- Confectionery sales registered a growth of 11.44% from 2021 to 2023. The sales growth is linked to the evolving snacking preferences in South Africa.; In 2023, the chocolate segment accounted for 51.42% of the overall confectionery consumption in South Africa;
- The rising consumer inclination toward low-sugar or low-calorie snack food is estimated to create lucrative opportunities for healthy variants of confectionery during the forecast period.
Understand The Key Trends Shaping This Market
Download PDF
OTHER KEY INDUSTRY TRENDS COVERED IN THE REPORT
- The use of naturally produced color with unique color emulsion technology is expected to propel the market
Segment Analysis: Confections
Chocolate Segment in South African Confectionery Market
The chocolate segment maintains its dominant position in South Africa's confectionery market, commanding approximately 52% market share in 2024. This leadership position is primarily driven by the rising consumption of chocolates, especially among the youth population in the region. The segment's growth is further bolstered by the increasing popularity of premium confectionery variants, including vegan chocolates, sugar-free chocolates, and artisanal confectionery chocolates. Major manufacturers are actively expanding their product portfolios with innovative offerings to capture a broader customer base. The segment has also witnessed significant growth in dark chocolate consumption, particularly among health-conscious consumers who appreciate its nutritional benefits and antioxidant properties.
Snack Bar Segment in South African Confectionery Market
The snack bar segment is experiencing remarkable growth in South Africa's confectionery market, projected to grow at approximately 11% during 2024-2029. This impressive growth trajectory is primarily driven by the increasing demand among the expanding working population for wholesome and nutritious snacks that serve as convenient meal replacements. The segment's growth is further fueled by rising health consciousness and busy lifestyles, with consumers actively seeking nutritious alternatives to traditional snacks. Manufacturers are responding to this trend by introducing innovative confectionery products loaded with superfoods like chia, whole grain fibers, and quinoa, offering nutrition in a convenient format. The protein bar category, in particular, is gaining significant traction due to the growing fitness culture and increasing gym memberships across the country.
Remaining Segments in Confections Market
The sugar confectionery and gums segments continue to play vital roles in shaping South Africa's confectionery market landscape. The sugar confectionery segment maintains its position as the second-largest category, offering a diverse range of confectionery products including hard candies, pastilles, gummies, and jellies. This segment's growth is particularly driven by innovative flavor profiles and increasing demand for functional confectionery products. The gums segment, while smaller in market share, remains significant with its expanding portfolio of sugar-free variants and functional benefits, particularly appealing to health-conscious consumers and those seeking oral hygiene benefits. Both segments are witnessing continuous innovation in terms of ingredients, flavors, and functional benefits to meet evolving consumer preferences.
Segment Analysis: Distribution Channel
Supermarket/Hypermarket Segment in South Africa Confectionery Market
The supermarket/hypermarket channel dominates the South African confectionery market, commanding approximately 49% market share by value in 2024. This significant market position is attributed to these retailers' extensive product variety and their ability to stock a wide range of confectionery products to meet consumers' diverse preferences for on-the-go snacks. Major retail chains like Shoprite, Pick n Pay, Spar, and Woolworths, with their extensive networks of 1,983, 1,574, 2,000, and 872 stores respectively across South Africa, provide convenient access to both local and imported confectionery products. These large-format stores offer confectionery products under various labels, including clean-label and free-form products, enabling consumers to easily select products based on their preferences. Their larger infrastructure allows them to accommodate diverse confectionery products with different packaging sizes and brands, while their ability to offer competitive pricing and regular promotions further strengthens their market position.
Online Retail Store Segment in South Africa Confectionery Market
The online retail channel is experiencing remarkable growth in South Africa's confectionery market, projected to achieve the highest growth rate during 2024-2029. This growth is primarily driven by increasing internet connectivity and rising smartphone usage, with South Africa boasting 43.48 million internet users and an internet penetration rate of 72%. The channel's expansion is further supported by the growing social media presence, with 25.80 million users representing 42.9% of the total population, facilitating digital marketing strategies and expanding online grocery delivery networks. The convenience and ease of delivery have made online channels increasingly popular, with approximately 77% of consumers preferring online channels over in-store shopping. The growth is also supported by the increasing adoption of online banking and cashless transactions, with about 76% of consumers being familiar with digital payment methods, making online shopping more accessible and secure.
Remaining Segments in Distribution Channel
The convenience store and other retail formats continue to play vital roles in South Africa's confectionery market. Convenience stores serve as crucial points of sale, particularly in high-traffic areas and along major highways, offering easy access to confectionery products for on-the-go consumers. The 'Others' category encompasses various retail formats including vending machines, specialist stores, drug stores, warehouse clubs, direct selling, and forecourt retailers. These channels are particularly important in serving specific market niches, with specialty retail stores focusing on premium and artisanal confectionery products, while vending machines and forecourt retailers cater to impulse purchases and convenience-seeking consumers. The diverse nature of these channels ensures comprehensive market coverage and meets varying consumer preferences and shopping patterns across different locations and demographics.
South Africa Confectionery Industry Overview
Top Companies in South Africa Confectionery Market
The confectionery market in South Africa is characterized by continuous product innovation and strategic expansion initiatives by major players. Companies are focusing on developing new flavors, healthier variants, and premium offerings to meet evolving consumer preferences, particularly in chocolate and sugar confectionery segments. Operational agility is demonstrated through investments in advanced manufacturing capabilities and sustainable sourcing practices, especially for key ingredients like cocoa and sugar. Strategic moves include partnerships with local distributors to enhance market share in confectionery and collaboration with retail chains for better shelf presence. Companies are also expanding their product portfolios through acquisitions and launching region-specific products that cater to local tastes and preferences. Digital transformation initiatives and e-commerce partnerships are becoming increasingly important for market expansion and consumer reach.
Market Dominated by Global-Local Player Mix
The South African confectionery market exhibits a balanced mix of global leading confectionery companies and established local players, creating a competitive yet consolidated marketplace. Global conglomerates leverage their international expertise and robust supply chains, while local specialists capitalize on their understanding of regional preferences and established distribution networks. The market structure is characterized by strong brand loyalty and significant barriers to entry, particularly in terms of manufacturing capabilities and distribution infrastructure. The presence of diversified food and beverage conglomerates alongside specialized confectionery manufacturers creates a dynamic competitive environment.
Merger and acquisition activities in the market are primarily driven by global players seeking to strengthen their local presence and expand their product portfolios. Local companies are increasingly becoming attractive acquisition targets due to their established distribution networks and strong regional brand recognition. The market also witnesses strategic partnerships between international and local players to combine global expertise with local market knowledge. These collaborations often focus on product development, manufacturing efficiency, and distribution optimization, contributing to market consolidation while maintaining competitive diversity.
Innovation and Distribution Key to Growth
Success in the South African confectionery industry increasingly depends on companies' ability to innovate while maintaining operational efficiency. Market leaders must focus on product differentiation through unique flavors, healthier alternatives, and premium offerings while optimizing their production costs and supply chain efficiency. Building strong relationships with retailers and investing in direct-to-consumer channels are becoming crucial for maintaining market share. Companies need to balance premium positioning with affordability while investing in sustainable practices and transparent sourcing to meet evolving consumer expectations.
For emerging players and market contenders, success lies in identifying and serving niche market segments while building strong distribution networks. Companies must focus on developing unique value propositions, whether through innovative products, competitive pricing, or superior customer service. The ability to adapt to changing consumer preferences and regulatory requirements, particularly regarding sugar content and packaging sustainability, will be crucial. Investment in digital capabilities and e-commerce platforms, combined with strategic partnerships with established players, can provide pathways for growth. Understanding and addressing potential substitution risks from healthy snacking alternatives while maintaining product quality and safety standards will be essential for long-term success.
South Africa Confectionery Market Leaders
-
Chocoladefabriken Lindt & Sprüngli AG
-
Mars Incorporated
-
Mondelēz International Inc.
-
Premier Foods Pty
-
Tiger Brands
- *Disclaimer: Major Players sorted in no particular order

Need More Details on Market Players and Competiters?
Download PDF
South Africa Confectionery Market News
- July 2023: Chocoladefabriken Lindt & Sprüngli AG launched a vegan chocolate range in South Africa. The products are available in two vegan flavors – Lindt Vegan Smooth Chocolate (made with oats and almonds to deliver a smooth, creamy texture) and Lindt Vegan Hazelnut Chocolate (made with roasted hazelnuts and premium vegan chocolate for a nutty flavor).
- May 2023: Under its brand, Mondelēz International Inc. launched three new special edition flavors that deliver indulgence with much-loved flavor combinations. The 150 g slabs include Dairy Milk Fudge Cookie Crumble, Fudge Mint Crisp, and Dream Coconut & Hazelnut Bliss.
- April 2023: Under the ONE brand, The Hershey Company launched the Peanut Butter & Jelly Flavored Protein Bar. The ONE Limited Edition Peanut Butter & Jelly flavored bars are packed with 20 g of protein, 1 g of sugar, and the familiar taste of peanut butter and strawberry jelly flavors.
Free With This Report
We provide a comprehensive and exhaustive set of data pointers for global, regional, and country-level metrics that illustrate the fundamentals of the confectionery industry. With the help of 45+ free charts, clients can access in-depth market analysis based on price trend analysis of confectionery ingredients and per capita consumption of confections, through granular-level segmental information supported by a repository of market data, trends, and expert analysis. Data and analysis on confections, confectionery variants, sugar content, insights into consumer preferences and purchasing patterns, an overview of key market players, etc., are available in the form of comprehensive reports as well as excel-based data worksheets.


South Africa Confectionery Market Report - Table of Contents
1. EXECUTIVE SUMMARY & KEY FINDINGS
2. REPORT OFFERS
3. INTRODUCTION
- 3.1 Study Assumptions & Market Definition
- 3.2 Scope of the Study
- 3.3 Research Methodology
4. KEY INDUSTRY TRENDS
- 4.1 Regulatory Framework
- 4.2 Consumer Buying Behavior
- 4.3 Ingredient Analysis
- 4.4 Value Chain & Distribution Channel Analysis
5. MARKET SEGMENTATION (includes market size in Value in USD and Volume, Forecasts up to 2030 and analysis of growth prospects)
-
5.1 Confections
- 5.1.1 Chocolate
- 5.1.1.1 By Confectionery Variant
- 5.1.1.1.1 Dark Chocolate
- 5.1.1.1.2 Milk and White Chocolate
- 5.1.2 Gums
- 5.1.2.1 By Confectionery Variant
- 5.1.2.1.1 Bubble Gum
- 5.1.2.1.2 Chewing Gum
- 5.1.2.1.2.1 By Sugar Content
- 5.1.2.1.2.1.1 Sugar Chewing Gum
- 5.1.2.1.2.1.2 Sugar-free Chewing Gum
- 5.1.3 Snack Bar
- 5.1.3.1 By Confectionery Variant
- 5.1.3.1.1 Cereal Bar
- 5.1.3.1.2 Fruit & Nut Bar
- 5.1.3.1.3 Protein Bar
- 5.1.4 Sugar Confectionery
- 5.1.4.1 By Confectionery Variant
- 5.1.4.1.1 Hard Candy
- 5.1.4.1.2 Lollipops
- 5.1.4.1.3 Mints
- 5.1.4.1.4 Pastilles, Gummies, and Jellies
- 5.1.4.1.5 Toffees and Nougats
- 5.1.4.1.6 Others
-
5.2 Distribution Channel
- 5.2.1 Convenience Store
- 5.2.2 Online Retail Store
- 5.2.3 Supermarket/Hypermarket
- 5.2.4 Others
6. COMPETITIVE LANDSCAPE
- 6.1 Key Strategic Moves
- 6.2 Market Share Analysis
- 6.3 Company Landscape
-
6.4 Company Profiles
- 6.4.1 Abbott Laboratories
- 6.4.2 Arcor S.A.I.C
- 6.4.3 August Storck KG
- 6.4.4 Chocoladefabriken Lindt & Sprüngli AG
- 6.4.5 Ferrero International SA
- 6.4.6 General Mills Inc.
- 6.4.7 HARIBO Holding GmbH & Co. KG
- 6.4.8 Kellogg Company
- 6.4.9 Mars Incorporated
- 6.4.10 Mondelēz International Inc.
- 6.4.11 Nestlé SA
- 6.4.12 PepsiCo Inc.
- 6.4.13 Perfetti Van Melle BV
- 6.4.14 Premier Foods Pty
- 6.4.15 The Hershey Company
- 6.4.16 Tiger Brands
- 6.4.17 Yıldız Holding AS
- *List Not Exhaustive
7. KEY STRATEGIC QUESTIONS FOR CONFECTIONERY CEOS
8. APPENDIX
-
8.1 Global Overview
- 8.1.1 Overview
- 8.1.2 Porter’s Five Forces Framework
- 8.1.3 Global Value Chain Analysis
- 8.1.4 Market Dynamics (DROs)
- 8.2 Sources & References
- 8.3 List of Tables & Figures
- 8.4 Primary Insights
- 8.5 Data Pack
- 8.6 Glossary of Terms
You Can Purchase Parts Of This Report. Check Out Prices For Specific Sections
Get Price Break-up Now
List of Tables & Figures
- Figure 1:
- VOLUME OF CONFECTIONERY MARKET, METRIC TONNES, SOUTH AFRICA, 2018 - 2030
- Figure 2:
- VALUE OF CONFECTIONERY MARKET, USD, SOUTH AFRICA, 2018 - 2030
- Figure 3:
- VOLUME OF CONFECTIONERY MARKET BY CONFECTIONS, METRIC TONNES, SOUTH AFRICA, 2018 - 2030
- Figure 4:
- VALUE OF CONFECTIONERY MARKET BY CONFECTIONS, USD, SOUTH AFRICA, 2018 - 2030
- Figure 5:
- VOLUME SHARE OF CONFECTIONERY MARKET BY CONFECTIONS, %, SOUTH AFRICA, 2018 VS 2024 VS 2030
- Figure 6:
- VALUE SHARE OF CONFECTIONERY MARKET BY CONFECTIONS, %, SOUTH AFRICA, 2018 VS 2024 VS 2030
- Figure 7:
- VOLUME OF CHOCOLATE MARKET BY CONFECTIONERY VARIANT, METRIC TONNES, SOUTH AFRICA, 2018 - 2030
- Figure 8:
- VALUE OF CHOCOLATE MARKET BY CONFECTIONERY VARIANT, USD, SOUTH AFRICA, 2018 - 2030
- Figure 9:
- VOLUME SHARE OF CHOCOLATE MARKET BY CONFECTIONERY VARIANT, %, SOUTH AFRICA, 2018 VS 2024 VS 2030
- Figure 10:
- VALUE SHARE OF CHOCOLATE MARKET BY CONFECTIONERY VARIANT, %, SOUTH AFRICA, 2018 VS 2024 VS 2030
- Figure 11:
- VOLUME OF DARK CHOCOLATE MARKET, METRIC TONNES, SOUTH AFRICA, 2018 - 2030
- Figure 12:
- VALUE OF DARK CHOCOLATE MARKET, USD, SOUTH AFRICA, 2018 - 2030
- Figure 13:
- VALUE SHARE OF DARK CHOCOLATE MARKET BY DISTRIBUTION CHANNEL, %, SOUTH AFRICA, 2023 VS 2030
- Figure 14:
- VOLUME OF MILK AND WHITE CHOCOLATE MARKET, METRIC TONNES, SOUTH AFRICA, 2018 - 2030
- Figure 15:
- VALUE OF MILK AND WHITE CHOCOLATE MARKET, USD, SOUTH AFRICA, 2018 - 2030
- Figure 16:
- VALUE SHARE OF MILK AND WHITE CHOCOLATE MARKET BY DISTRIBUTION CHANNEL, %, SOUTH AFRICA, 2023 VS 2030
- Figure 17:
- VOLUME OF GUMS MARKET BY CONFECTIONERY VARIANT, METRIC TONNES, SOUTH AFRICA, 2018 - 2030
- Figure 18:
- VALUE OF GUMS MARKET BY CONFECTIONERY VARIANT, USD, SOUTH AFRICA, 2018 - 2030
- Figure 19:
- VOLUME SHARE OF GUMS MARKET BY CONFECTIONERY VARIANT, %, SOUTH AFRICA, 2018 VS 2024 VS 2030
- Figure 20:
- VALUE SHARE OF GUMS MARKET BY CONFECTIONERY VARIANT, %, SOUTH AFRICA, 2018 VS 2024 VS 2030
- Figure 21:
- VOLUME OF BUBBLE GUM MARKET, METRIC TONNES, SOUTH AFRICA, 2018 - 2030
- Figure 22:
- VALUE OF BUBBLE GUM MARKET, USD, SOUTH AFRICA, 2018 - 2030
- Figure 23:
- VALUE SHARE OF BUBBLE GUM MARKET BY DISTRIBUTION CHANNEL, %, SOUTH AFRICA, 2023 VS 2030
- Figure 24:
- VOLUME OF CHEWING GUM MARKET BY SUGAR CONTENT, METRIC TONNES, SOUTH AFRICA, 2018 - 2030
- Figure 25:
- VALUE OF CHEWING GUM MARKET BY SUGAR CONTENT, USD, SOUTH AFRICA, 2018 - 2030
- Figure 26:
- VOLUME SHARE OF CHEWING GUM MARKET BY SUGAR CONTENT, %, SOUTH AFRICA, 2018 VS 2024 VS 2030
- Figure 27:
- VALUE SHARE OF CHEWING GUM MARKET BY SUGAR CONTENT, %, SOUTH AFRICA, 2018 VS 2024 VS 2030
- Figure 28:
- VOLUME OF SUGAR CHEWING GUM MARKET, METRIC TONNES, SOUTH AFRICA, 2018 - 2030
- Figure 29:
- VALUE OF SUGAR CHEWING GUM MARKET, USD, SOUTH AFRICA, 2018 - 2030
- Figure 30:
- VALUE SHARE OF SUGAR CHEWING GUM MARKET BY DISTRIBUTION CHANNEL, %, SOUTH AFRICA, 2023 VS 2030
- Figure 31:
- VOLUME OF SUGAR-FREE CHEWING GUM MARKET, METRIC TONNES, SOUTH AFRICA, 2018 - 2030
- Figure 32:
- VALUE OF SUGAR-FREE CHEWING GUM MARKET, USD, SOUTH AFRICA, 2018 - 2030
- Figure 33:
- VALUE SHARE OF SUGAR-FREE CHEWING GUM MARKET BY DISTRIBUTION CHANNEL, %, SOUTH AFRICA, 2023 VS 2030
- Figure 34:
- VOLUME OF SNACK BAR MARKET BY CONFECTIONERY VARIANT, METRIC TONNES, SOUTH AFRICA, 2018 - 2030
- Figure 35:
- VALUE OF SNACK BAR MARKET BY CONFECTIONERY VARIANT, USD, SOUTH AFRICA, 2018 - 2030
- Figure 36:
- VOLUME SHARE OF SNACK BAR MARKET BY CONFECTIONERY VARIANT, %, SOUTH AFRICA, 2018 VS 2024 VS 2030
- Figure 37:
- VALUE SHARE OF SNACK BAR MARKET BY CONFECTIONERY VARIANT, %, SOUTH AFRICA, 2018 VS 2024 VS 2030
- Figure 38:
- VOLUME OF CEREAL BAR MARKET, METRIC TONNES, SOUTH AFRICA, 2018 - 2030
- Figure 39:
- VALUE OF CEREAL BAR MARKET, USD, SOUTH AFRICA, 2018 - 2030
- Figure 40:
- VALUE SHARE OF CEREAL BAR MARKET BY DISTRIBUTION CHANNEL, %, SOUTH AFRICA, 2023 VS 2030
- Figure 41:
- VOLUME OF FRUIT & NUT BAR MARKET, METRIC TONNES, SOUTH AFRICA, 2018 - 2030
- Figure 42:
- VALUE OF FRUIT & NUT BAR MARKET, USD, SOUTH AFRICA, 2018 - 2030
- Figure 43:
- VALUE SHARE OF FRUIT & NUT BAR MARKET BY DISTRIBUTION CHANNEL, %, SOUTH AFRICA, 2023 VS 2030
- Figure 44:
- VOLUME OF PROTEIN BAR MARKET, METRIC TONNES, SOUTH AFRICA, 2018 - 2030
- Figure 45:
- VALUE OF PROTEIN BAR MARKET, USD, SOUTH AFRICA, 2018 - 2030
- Figure 46:
- VALUE SHARE OF PROTEIN BAR MARKET BY DISTRIBUTION CHANNEL, %, SOUTH AFRICA, 2023 VS 2030
- Figure 47:
- VOLUME OF SUGAR CONFECTIONERY MARKET BY CONFECTIONERY VARIANT, METRIC TONNES, SOUTH AFRICA, 2018 - 2030
- Figure 48:
- VALUE OF SUGAR CONFECTIONERY MARKET BY CONFECTIONERY VARIANT, USD, SOUTH AFRICA, 2018 - 2030
- Figure 49:
- VOLUME SHARE OF SUGAR CONFECTIONERY MARKET BY CONFECTIONERY VARIANT, %, SOUTH AFRICA, 2018 VS 2024 VS 2030
- Figure 50:
- VALUE SHARE OF SUGAR CONFECTIONERY MARKET BY CONFECTIONERY VARIANT, %, SOUTH AFRICA, 2018 VS 2024 VS 2030
- Figure 51:
- VOLUME OF HARD CANDY MARKET, METRIC TONNES, SOUTH AFRICA, 2018 - 2030
- Figure 52:
- VALUE OF HARD CANDY MARKET, USD, SOUTH AFRICA, 2018 - 2030
- Figure 53:
- VALUE SHARE OF HARD CANDY MARKET BY DISTRIBUTION CHANNEL, %, SOUTH AFRICA, 2023 VS 2030
- Figure 54:
- VOLUME OF LOLLIPOPS MARKET, METRIC TONNES, SOUTH AFRICA, 2018 - 2030
- Figure 55:
- VALUE OF LOLLIPOPS MARKET, USD, SOUTH AFRICA, 2018 - 2030
- Figure 56:
- VALUE SHARE OF LOLLIPOPS MARKET BY DISTRIBUTION CHANNEL, %, SOUTH AFRICA, 2023 VS 2030
- Figure 57:
- VOLUME OF MINTS MARKET, METRIC TONNES, SOUTH AFRICA, 2018 - 2030
- Figure 58:
- VALUE OF MINTS MARKET, USD, SOUTH AFRICA, 2018 - 2030
- Figure 59:
- VALUE SHARE OF MINTS MARKET BY DISTRIBUTION CHANNEL, %, SOUTH AFRICA, 2023 VS 2030
- Figure 60:
- VOLUME OF PASTILLES, GUMMIES, AND JELLIES MARKET, METRIC TONNES, SOUTH AFRICA, 2018 - 2030
- Figure 61:
- VALUE OF PASTILLES, GUMMIES, AND JELLIES MARKET, USD, SOUTH AFRICA, 2018 - 2030
- Figure 62:
- VALUE SHARE OF PASTILLES, GUMMIES, AND JELLIES MARKET BY DISTRIBUTION CHANNEL, %, SOUTH AFRICA, 2023 VS 2030
- Figure 63:
- VOLUME OF TOFFEES AND NOUGATS MARKET, METRIC TONNES, SOUTH AFRICA, 2018 - 2030
- Figure 64:
- VALUE OF TOFFEES AND NOUGATS MARKET, USD, SOUTH AFRICA, 2018 - 2030
- Figure 65:
- VALUE SHARE OF TOFFEES AND NOUGATS MARKET BY DISTRIBUTION CHANNEL, %, SOUTH AFRICA, 2023 VS 2030
- Figure 66:
- VOLUME OF OTHERS MARKET, METRIC TONNES, SOUTH AFRICA, 2018 - 2030
- Figure 67:
- VALUE OF OTHERS MARKET, USD, SOUTH AFRICA, 2018 - 2030
- Figure 68:
- VALUE SHARE OF OTHERS MARKET BY DISTRIBUTION CHANNEL, %, SOUTH AFRICA, 2023 VS 2030
- Figure 69:
- VOLUME OF CONFECTIONERY MARKET BY DISTRIBUTION CHANNEL, METRIC TONNES, SOUTH AFRICA, 2018 - 2030
- Figure 70:
- VALUE OF CONFECTIONERY MARKET BY DISTRIBUTION CHANNEL, USD, SOUTH AFRICA, 2018 - 2030
- Figure 71:
- VOLUME SHARE OF CONFECTIONERY MARKET BY DISTRIBUTION CHANNEL, %, SOUTH AFRICA, 2018 VS 2024 VS 2030
- Figure 72:
- VALUE SHARE OF CONFECTIONERY MARKET BY DISTRIBUTION CHANNEL, %, SOUTH AFRICA, 2018 VS 2024 VS 2030
- Figure 73:
- VOLUME OF CONFECTIONERY MARKET SOLD VIA CONVENIENCE STORE, METRIC TONNES, SOUTH AFRICA, 2018 - 2030
- Figure 74:
- VALUE OF CONFECTIONERY MARKET SOLD VIA CONVENIENCE STORE, USD, SOUTH AFRICA, 2018 - 2030
- Figure 75:
- VALUE SHARE OF CONFECTIONERY MARKET SOLD VIA CONVENIENCE STORE BY CONFECTION, %, SOUTH AFRICA, 2023 VS 2030
- Figure 76:
- VOLUME OF CONFECTIONERY MARKET SOLD VIA ONLINE RETAIL STORE, METRIC TONNES, SOUTH AFRICA, 2018 - 2030
- Figure 77:
- VALUE OF CONFECTIONERY MARKET SOLD VIA ONLINE RETAIL STORE, USD, SOUTH AFRICA, 2018 - 2030
- Figure 78:
- VALUE SHARE OF CONFECTIONERY MARKET SOLD VIA ONLINE RETAIL STORE BY CONFECTION, %, SOUTH AFRICA, 2023 VS 2030
- Figure 79:
- VOLUME OF CONFECTIONERY MARKET SOLD VIA SUPERMARKET/HYPERMARKET, METRIC TONNES, SOUTH AFRICA, 2018 - 2030
- Figure 80:
- VALUE OF CONFECTIONERY MARKET SOLD VIA SUPERMARKET/HYPERMARKET, USD, SOUTH AFRICA, 2018 - 2030
- Figure 81:
- VALUE SHARE OF CONFECTIONERY MARKET SOLD VIA SUPERMARKET/HYPERMARKET BY CONFECTION, %, SOUTH AFRICA, 2023 VS 2030
- Figure 82:
- VOLUME OF CONFECTIONERY MARKET SOLD VIA OTHERS, METRIC TONNES, SOUTH AFRICA, 2018 - 2030
- Figure 83:
- VALUE OF CONFECTIONERY MARKET SOLD VIA OTHERS, USD, SOUTH AFRICA, 2018 - 2030
- Figure 84:
- VALUE SHARE OF CONFECTIONERY MARKET SOLD VIA OTHERS BY CONFECTION, %, SOUTH AFRICA, 2023 VS 2030
- Figure 85:
- MOST ACTIVE COMPANIES BY NUMBER OF STRATEGIC MOVES, COUNT, SOUTH AFRICA, 2018 - 2023
- Figure 86:
- MOST ADOPTED STRATEGIES, COUNT, SOUTH AFRICA, 2018 - 2023
- Figure 87:
- VALUE SHARE OF MAJOR PLAYERS, %, SOUTH AFRICA
South Africa Confectionery Industry Segmentation
Chocolate, Gums, Snack Bar, Sugar Confectionery are covered as segments by Confections. Convenience Store, Online Retail Store, Supermarket/Hypermarket, Others are covered as segments by Distribution Channel.| Confections | Chocolate | By Confectionery Variant | Dark Chocolate | ||
| Milk and White Chocolate | |||||
| Gums | By Confectionery Variant | Bubble Gum | |||
| Chewing Gum | By Sugar Content | Sugar Chewing Gum | |||
| Sugar-free Chewing Gum | |||||
| Snack Bar | By Confectionery Variant | Cereal Bar | |||
| Fruit & Nut Bar | |||||
| Protein Bar | |||||
| Sugar Confectionery | By Confectionery Variant | Hard Candy | |||
| Lollipops | |||||
| Mints | |||||
| Pastilles, Gummies, and Jellies | |||||
| Toffees and Nougats | |||||
| Others | |||||
| Distribution Channel | Convenience Store | ||||
| Online Retail Store | |||||
| Supermarket/Hypermarket | |||||
| Others | |||||
Need A Different Region or Segment?
Customize Now
Market Definition
- Milk and White Chocolate - Milk chocolates is a solid chocolate made with milk (in the form of either milk powder, liquid milk, or condensed milk) and cocoa solids. White chocolate is made from cocoa butter and milk and contains no cocoa solids whatsoever. The scope includes regular chocolates, low-sugar, and sugar-free variants
- Toffees & Nougats - Toffees include hard, chewy, and small or one-bite candies marketed with labels as toffee or toffee-like confectionery. Nougat is a chewy confection with almond, sugar, and egg white as a basic ingredient; and it originated in Europe and Middle East countries.
- Cereals Bars - A snack composed of breakfast cereal that has been compressed into a bar shape and is held together with a form of edible adhesive. The scope includes snack bars made with cereals such as rice, oats, corn, etc. mixed with a binding syrup. These also include products labeled as cereal bars, cereal treat bars, or grain bars.
- Chewing Gum - This is a preparation for chewing, usually made of flavored and sweetened chicle or such substitutes as polyvinyl acetate. The types of chewing gums included in the scope are sugar-chewing gums and sugar-free chewing gums
| Keyword | Definition |
|---|---|
| Dark Chocolate | Dark chocolate is a form of chocolate containing cocoa solids and cocoa butter without the milk. |
| White Chocolate | White chocolate is the type of chocolate containing the highest percentage of milk solids, typically around or over 30 percent. |
| Milk Chocolate | Milk chocolate is made from dark chocolate that has a low cocoa solid content and higher sugar content, plus a milk product. |
| Hard Candy | A candy made of sugar and corn syrup boiled without crystallizing. |
| Toffees | A hard, chewy, often brown sweet that is made from sugar boiled with butter. |
| Nougats | A chewy or brittle candy containing almonds or other nuts and sometimes fruit. |
| Cereal bar | A cereal bar is a bar-shaped food product, made by pressing cereals and usually dried fruit or berries, which are in most cases held together by glucose syrup. |
| Protein bar | Protein bars are nutrition bars that contain a high proportion of protein to carbohydrates/fats. |
| Fruit & Nut bar | These are often based on dates with other dried fruit and nut additions and, in some cases, flavorings. |
| NCA | The National Confectioners Association is an American trade organization that promotes chocolate, candy, gum and mints, and the companies that make these treats. |
| CGMP | Current good manufacturing practices are those conforming to the guidelines recommended by relevant agencies. |
| Unstandardized foods | Unstandardized foods are those that do not have a standard of identity or that deviate from a prescribed standard in any manner. |
| GI | The glycemic index (GI) is a way of ranking carbohydrate-containing foods based on how slowly or quickly they are digested and increase blood glucose levels over a period of time |
| Skimmed milk powder | Skimmed milk powder is obtained by removing water from pasteurized skim milk by spray-drying. |
| Flavanols | Flavanols are a group of compounds found in cocoa, tea, apples, and many other plant-based foods and beverages. |
| WPC | Whey protein concentrate- the substance obtained by the removal of sufficient nonprotein constituents from pasteurized whey so that the finished dry product contains greater than 25% protein. |
| LDL | Low density Lipoprotein- the bad cholesterol |
| HDL | High density Lipoprotein- the good cholesterol |
| BHT | butylated Hydroxytoluene is a lab-made chemical that is added to foods as a preservative. |
| Carrageenan | Carrageenan is an additive used to thicken, emulsify, and preserve foods and drinks. |
| Free form | Not containing certain ingredients, such as gluten, dairy, or sugar. |
| Cocoa butter | It is a fatty substance obtained from cocoa beans, used in the manufacture of confectionery. |
| Pastellies | A type of of Brazilian candy made from sugar, eggs, and milk. |
| Draggees | Small, round candies that are coated with a hard sugar shell |
| CHOPRABISCO | Royal Belgian Association of the chocolate, pralines, biscuit, and confectionery industry- A trade association that represents the Belgian chocolate industry. |
| European Directive 2000/13 | A European Union directive that regulates the labeling of food products |
| Kakao-Verordnung | The German chocolate ordinance, a set of regulations that define what can be labeled as "chocolate" in Germany. |
| FASFC | Federal Agency for the Safety of the Food Chain |
| Pectin | A natural substance that is derived from fruits and vegetables. It is used in confectionery to create a gel-like texture. |
| Invert sugars | A type of sugar that is made up of glucose and fructose. |
| Emulsifier | A substance that helps to mix to liquids that does not mix together. |
| Anthocyanins | A type of flavonoid that is responsible for the red, purple, and blue colors of confectionery. |
| Functional Foods | Foods that have been modified to provide additional health benefits beyond basic nutrition. |
| Kosher certificate | This certification verifies that the ingredients, production process including all machinery, and/or food-service process complies with the standards of Jewish dietary law |
| Chicory root extract | A natural extract from the chicory root that is a good source of fiber, calcium, phosphorous, and folate |
| RDD | Recommended daily dose |
| Gummies | A chewy gelatin-based candy that is often flavored with fruit. |
| Nutraceuticals | Food or dietary supplements that are claimed to have health benefits. |
| Energy bars | Snack bars that are high in carbohydrates and calories are designed to provide energy on the go. |
| BFSO | Belgian Food Safety Organization for the food chain. |
Need More Details on Market Definition?
Ask a Question
Research Methodology
Mordor Intelligence follows a four-step methodology in all our reports.
- Step-1: Identify Key Variables: In order to build a robust forecasting methodology, the variables and factors identified in Step 1 are tested against available historical market numbers. Through an iterative process, the variables required for market forecast are set, and the model is built on the basis of these variables.
- Step-2: Build a Market Model: Market-size estimations for the forecast years are in nominal terms. Inflation is not a part of the pricing, and the average selling price (ASP) is kept constant throughout the forecast period for each country.
- Step-3: Validate and Finalize: In this important step, all market numbers, variables, and analyst calls are validated through an extensive network of primary research experts from the market studied. The respondents are selected across levels and functions to generate a holistic picture of the market studied.
- Step-4: Research Outputs: Syndicated Reports, Custom Consulting Assignments, Databases & Subscription Platforms

Get More Details On Research Methodology
Download PDF


