
Market Overview
| Study Period | 2021 - 2031 |
|---|---|
| Forecast Data Period | 2026 - 2031 |
| Base Year Market Size (2025) | USD 19.80 Billion |
| Market Size (2026) | USD 20.79 Billion |
| Market Size (2031) | USD 26.52 Billion |
| Growth Rate (2026 - 2031) | 4.99 % |
| Market Concentration | Medium |
Major Players *Disclaimer: Major Players sorted in no particular order Image © Mordor Intelligence. Reuse requires attribution under CC BY 4.0. | |
South Africa Beverages Market Analysis by Mordor Intelligence
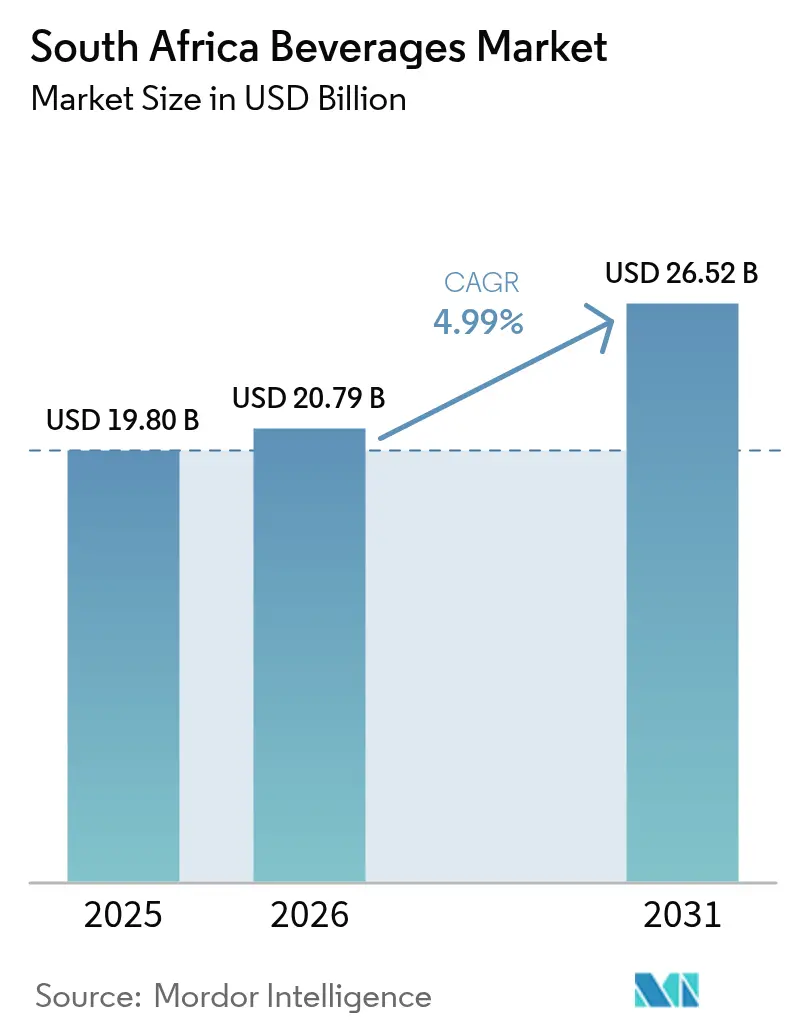
The South African beverage market size is expected to grow from USD 19.80 billion in 2025 to USD 20.79 billion in 2026 and is forecast to reach USD 26.52 billion by 2031 at 4.99% CAGR over 2026-2031. Urbanization, longer working hours, and increased female workforce participation are driving demand, while functional formulations and digital retail strategies are fueling growth. The demand for premium beverages, particularly in the alcoholic segment, is rising, with craft beers and high-quality spirits gaining popularity. Consumers are increasingly willing to pay a premium for these distinctive products. Additionally, the adoption of technologies such as automation and digitalization is improving production efficiency, enhancing product quality, and optimizing supply chain management. Significant investments by global players, including t and Varun Beverages, reflect confidence in the market's long-term potential, despite challenges like sin taxes and water scarcity.
Key Report Takeaways
- By product type, alcoholic beverages led with 52.46% revenue share in 2025; non-alcoholic beverages are projected to grow at a 6.74% CAGR through 2031.
- By packaging type, PET bottles accounted for 39.76% of the South African beverage market share in 2025, while cans are advancing at a 5.81% CAGR to 2031.
- By distribution channel, off-trade held 72.15% share of the South African beverage market size in 2025 and is expanding at a 6.10% CAGR during 2026-2031.
- By province, Gauteng commanded a 29.98% share in 2025, whereas the Western Cape is projected to post a 5.55% CAGR through 2031.
Note: Market size and forecast figures in this report are generated using Mordor Intelligence’s proprietary estimation framework, updated with the latest available data and insights as of 2026.
South Africa Beverages Market Trends and Insights
Drivers Impact Analysis*
| Driver | (~) % Impact on CAGR Forecast | Geographic Relevance | Impact Timeline |
|---|---|---|---|
| Flavoured-beverage premiumisation | +1.2% | National, early gains in Western Cape, Gauteng | Medium term (2-4 years) |
| Health-centric sugar reformulation | +0.9% | National, strongest in urban centers | Long term (≥4 years) |
| Functional and energy-drink boom | +1.5% | National, Gauteng, KwaZulu-Natal | Short term (≤2 years) |
| Local craft and independent breweries | +0.7% | Western Cape, Gauteng | Medium term (2-4 years) |
| Digital and e-commerce growth | +1.1% | National, urban-focused | Short term (≤2 years) |
| Expanding cocktail culture and social drinking | +0.8% | Urban centers, tourism regions | Medium term (2-4 years) |
| Source: Mordor Intelligence | |||
Flavored-beverage premiumization wave
As South African incomes grow, consumers are increasingly opting for premium beverages, transforming spending habits. This change, supported by the International Monetary Fund's forecast of South Africa's GDP per capita reaching 6,800 in 2025, has driven a wave of innovation and experience-focused branding, boosting sales values[1]. Brands are capitalizing on this trend, achieving higher margins as consumers prioritize quality experiences over quantity. Tiger Brands has tapped into this opportunity by offering Rose's Ginger and Blueberry Cordials, addressing the rising demand for premium mixers in the cocktail and mocktail culture. Local craft producers, such as Soul Barrel Brewing, are also benefiting from this premiumization trend. Their Wild African Soul was named Best Beer in Africa at the 2025 African Beer Cup, showcasing the premium potential of traditional ingredients like sorghum umqombothi. Additionally, the preference for locally sourced beverages is creating opportunities for domestic brands to use provenance as a premium differentiator. As consumers increasingly view premium purchases as worthwhile, the competitive landscape is shifting, emphasizing quality over quantity.
Health-centric sugar-reformulation race
In South Africa, the Health Promotion Levy is driving beverage manufacturers to reformulate their products. More than half of the country's beverages now carry warning labels due to high sugar content and the use of artificial sweeteners. The levy, which charges 2.1 cents for every gram of sugar exceeding 4 grams per 100ml, is encouraging manufacturers to explore innovative strategies beyond simple sugar reduction, as noted by the South African Revenue Service[2]. In July 2024, Tiger Brands launched the Jungle Oat Drink range, South Africa's first oat drink line featuring 5 unique flavors. This development highlights a growing industry shift, with companies focusing on health-oriented alternatives to avoid sugar penalties while meeting nutritional trends. Reformulation efforts are also expanding beyond sugar to include functional ingredients. Local brands like Carmién Tea and Laager are now offering products enriched with probiotics and CBD. This regulatory-driven shift is benefiting companies that adapt proactively while penalizing those that continue to produce high-sugar formulations. As South Africans prioritize health more this year, market demand is increasingly aligning with these regulatory changes.
Functional and energy-drink boom
In South Africa's non-alcoholic beverage sector, ready-to-drink energy drinks continue to dominate as the fastest-growing segment. This expansion reflects changing consumption habits, with energy drinks now catering not only to active lifestyles but also serving as hangover remedies and cocktail mixers. Competitive pricing strategies and impactful promotions have made premium energy drinks more accessible, driving the category's growth. Local value-added brands are increasingly competing with imported products, creating a dynamic and innovative market landscape. Wholesale channels are leading distribution growth as retailers capitalize on the category's profitability and consistent consumer demand. The functional beverage trend extends beyond energy drinks, with companies incorporating adaptogens, vitamins, and natural stimulants into wellness-focused formulations to differentiate themselves in a crowded market.
Local craft and independent breweries growth
South Africa's craft beer renaissance highlights a surge of innovation. Local breweries are increasingly using traditional African ingredients to create unique brews that emphasize authenticity over scale. For instance, in June 2024, Soul Barrel Brewing collaborated with Tolokazi Beer to produce 'Wild African Soul', a beer that combines traditional sorghum umqombothi with modern farmhouse ale techniques. This reflects the evolution of craft brewing, blending local heritage with contemporary taste preferences. The African Beer Cup 2025 acknowledged this trend by introducing a new category for 'Specialty African Beers', celebrating traditional ingredients like sorghum and millet. This move signifies growing recognition and acceptance of indigenous brewing methods in the market. These innovations challenge established breweries by offering distinctive flavor profiles and authentic storytelling that mass-produced beers cannot replicate, creating premium opportunities for smaller producers. The craft beer segment is further supported by shifting consumer preferences among younger demographics, who prioritize sustainability and health. Local breweries are also leveraging the rising demand for low and no-alcohol options. Beers like Devil's Peak Lite and Darling Brew's Light Speed Lager provide complex flavors while meeting reduced alcohol consumption goals.
Restraints Impact Analysis*
| Restraint | (~) % Impact on CAGR Forecast | Geographic Relevance | Impact Timeline |
|---|---|---|---|
| Rising tax on soft drinks and sugary beverages | -1.3% | National, lower-income segments | Short term (≤2 years) |
| Health concerns and consumer shift | -0.8% | Urban centers, educated consumers | Long term (≥4 years) |
| Chronic water-scarcity production risk | -1.1% | Western Cape, Gauteng hubs | Medium term (2-4 years) |
| Ban on alcohol advertising | -0.6% | National, tourism and entertainment | Medium term (2-4 years) |
| Source: Mordor Intelligence | |||
Rising tax on soft drinks and sugary beverages
The South African government is strengthening its sin tax policy, with the 2025 budget proposing a 6.75% increase in excise duties on alcoholic beverages, surpassing expected inflation rates. Combined with the Health Promotion Levy on sugary drinks, this policy is altering cost structures for manufacturers and retailers, pushing them toward lower-taxed product categories. The wine industry is particularly affected, as these taxes drive up production costs and contribute to a rise in illicit trade, especially during economic downturns. The government is also considering a progressive excise duty rate for wine and beer, with public consultations planned for 2025, signaling potential tax increases that could reshape competitive dynamics. Despite these fiscal challenges, consumer demand for wine remains steady, with premium segments absorbing tax hikes while value segments experience volume declines. The tax burden disproportionately affects lower-income consumers, potentially driving market segmentation toward premium products that can sustain profitability despite higher taxes.
Chronic water-scarcity production risk
South Africa's water crisis poses a significant threat to its beverage manufacturing industry. In Johannesburg, water cuts similar to power load shedding have been introduced, with some areas experiencing water outages lasting up to 86 hours. Mismanagement and illegal connections result in substantial water losses from reservoirs before reaching consumers. This uncertainty forces manufacturers to invest in expensive backup systems and alternative sourcing strategies. The National Water Act requires businesses to renew water licenses every five years, creating regulatory challenges for long-term investment planning in water-intensive beverage production. Companies are increasingly relocating from water-stressed regions, with some moving from Johannesburg to Cape Town, despite Cape Town's own water issues. This shift highlights the severity of regional water security concerns. Additionally, government-led infrastructure upgrades in partnership with Lesotho to enhance water supply are delayed, with completion now anticipated by 2028, further postponing structural improvements in water security. As water scarcity drives up operational costs and raises consumer awareness of environmental impacts, beverage manufacturers face the challenge of balancing production continuity with sustainability goals. Companies with advanced water management systems and circular economy practices are likely to gain a competitive edge in this environment.
*Our forecasts treat driver/restraint impacts as directional, not additive. The impact forecasts reflect baseline growth, mix effects, and variable interactions.
Segment Analysis
By Product Type – Health Drives Non-Alcoholic Acceleration
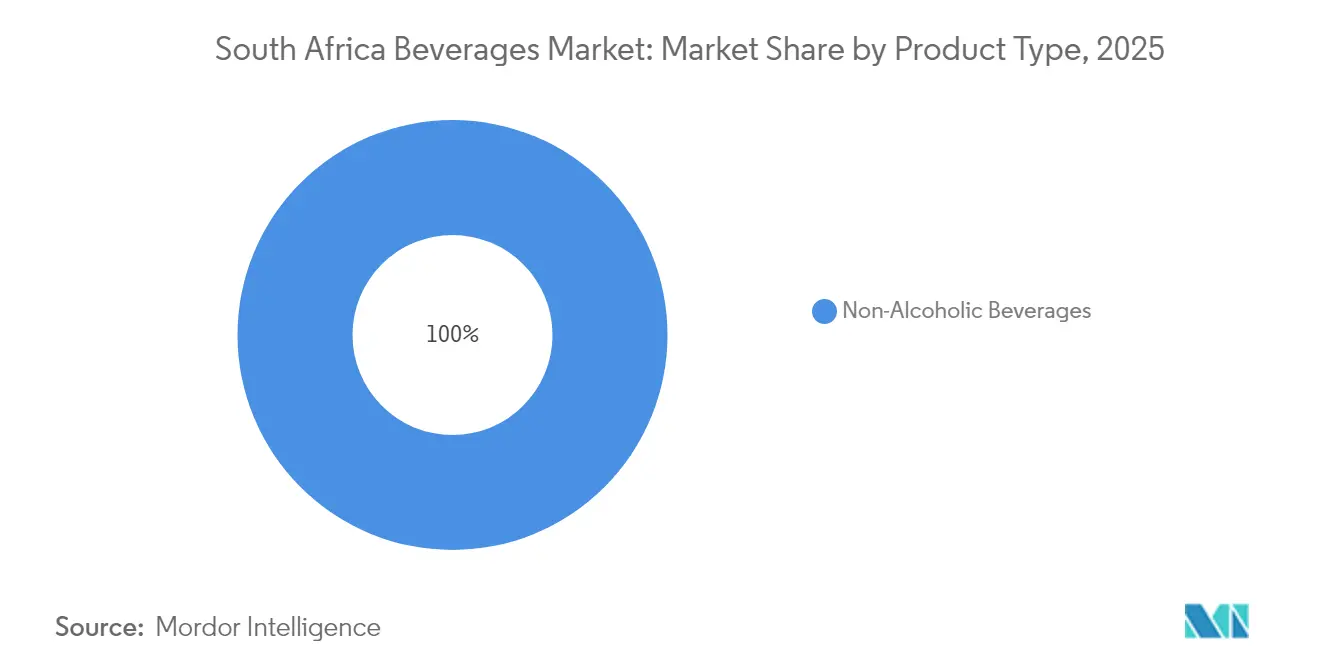
Non-alcoholic beverages are expected to achieve a CAGR of 6.74% from 2026 to 2031, surpassing the growth of the broader South African beverage market. This growth is fueled by the increasing demand for sugar-free energy drinks, ready-to-drink teas, and plant-based milks. Regulatory measures and changing consumer preferences, particularly toward premium products, are driving this momentum. The energy-drink segment is contributing significantly to the expansion of the South African beverage market, transitioning its appeal from performance-driven consumption to social occasions. Additionally, ready-to-drink teas and coffees, such as Red Espresso's rooibos line, are gaining traction internationally, highlighting their export opportunities.
Alcoholic beverages hold a substantial 52.46% market share but are encountering challenges due to moderation trends. Beer continues to sustain its volume primarily because of its affordability, while the market is evolving with the introduction of craft innovations and low-alcohol alternatives. South Africa's growing wine production, reported at 8.8 million hectoliters in 2024 by the International Organisation of Vine and Wine, reinforces the leading position of alcoholic beverages in the country's beverage market. Premium gins and specialty seltzers are attracting experiential consumers, adding value to the market, though their overall contribution remains limited. Moreover, producers are proactively aligning their portfolios with health-focused narratives to mitigate risks associated with potential tax increases and advertising restrictions.

By Packaging Type – Sustainability Reshapes Container Preferences
Cans emerge as the fastest-growing packaging format with a 5.81% CAGR for 2026-2031, while PET bottles maintain the largest market share at 39.76% in 2025. This growth pattern reflects converging sustainability imperatives and consumer convenience preferences that favor recyclable and portable packaging solutions. The new ZAR 300 million PET processing facility, beginning operations in 2025, will enable bottle-to-bottle recycling for the first time in the Western Cape, increasing food-grade recycled PET output by 15,000 tonnes annually and supporting the circular economy transition, according to the Department of Forestry, Fisheries, and the Environment.
Glass bottles, while facing challenges such as weight and transportation costs, maintain a premium position in the craft beverage and wine segments. The beer industry's returnable packaging system continues to achieve high recycling rates. Tetrapack and other alternative packaging formats cater to niche applications but encounter difficulties in gaining broader market acceptance due to consumer habits and recycling infrastructure limitations. The packaging industry is increasingly shaped by regulatory compliance. Consumers are gravitating toward packaging solutions that combine convenience, sustainability, and brand differentiation, favoring options that support on-the-go consumption while minimizing environmental impact.
By Distribution Channel – Digital Transformation Accelerates Off-Trade Dominance
In 2025, off-trade channels hold a 72.15% market share and are projected to lead with a 6.10% CAGR from 2026 to 2031. This growth is primarily driven by the expansion of e-commerce and evolving consumer shopping patterns. Pick'n Pay's increase in online sales highlights this digital transformation in beverage retail. The company's strategic initiatives, such as collaborations with platforms like asap! grocery delivery and integration with the Mr D app enhances customer convenience and engagement.
On-trade channels face challenges due to economic pressures and shifting social behaviors, but premium venues benefit from the growing cocktail culture and a preference for experiential consumption. Specialty stores remain significant by offering curated selections and expert advice, particularly for craft and premium beverages. The growth of the digital population continues to drive e-commerce, creating opportunities for agile companies that adopt digital transformation. Convenience stores gain from urbanization and fast-paced lifestyles but face competition from online delivery services that provide similar convenience with a broader product range.

Geography Analysis
In 2025, Gauteng holds a 29.98% market share, attributed to its high urbanization, concentrated economic activities, and elevated disposable incomes that drive diverse beverage consumption. As the central hub for beverage distribution and marketing, Gauteng houses the headquarters and key facilities of major retailers and manufacturers. However, the province faces water security challenges; Johannesburg's water cuts, similar to power load shedding, create operational risks for beverage producers. Although high unemployment and inflation pressure consumer spending, the significant presence of middle and upper-income households provides stability, particularly for premium beverage categories.
Western Cape, with an anticipated 5.55% CAGR for 2026-2031, is emerging as a key growth area due to its strengths in tourism, wine production, and craft beverage innovation. The province will benefit from a new ZAR 300 million PET processing facility starting operations in 2025, which will enhance sustainability efforts by enabling bottle-to-bottle recycling and appealing to environmentally conscious consumers. Cape Town's prominence as a tourist destination drives demand for premium beverages, especially in wine and craft beer. Additionally, the region's strong agricultural base supports local sourcing. Having dealt with its own water crisis, the province has fostered consumer awareness and industry expertise in water management, positioning its companies as leaders in sustainable production practices.
KwaZulu-Natal ranks as the second-largest provincial economy, with strong food and beverage manufacturing capabilities that make it a vital production hub for the national market. Its coastal location provides logistical advantages for trade, while its diverse agricultural base supports local sourcing for various beverage categories. Mpumalanga and Limpopo are contributing through agricultural production and growing opportunities in traditional beverages. Limpopo's Setšong Tea Crafters exemplify this trend by leveraging indigenous knowledge to create economic value through organic tea and gin production. Across the rest of South Africa, regional markets exhibit varied growth potential, influenced by local economic conditions, infrastructure, and consumer preferences.
Regulatory Landscape
South Africa's beverage regulation combines national frameworks for alcohol with fiscal and health measures that shape both alcoholic and non-alcoholic portfolios. The National Liquor Act 59 of 2003 is administered at the national level through the National Liquor Authority (NLA) within the Department of Trade, Industry and Competition (dtic), while Provincial Liquor Authorities oversee micro-manufacturing and retail licensing, supported by coordination mechanisms such as the National Liquor Policy Council. On the non-alcoholic side, the Health Promotion Levy administered by the South African Revenue Service (2.1 cents per gram of sugar above 4 g/100 ml) is a central compliance and pricing consideration for carbonated soft drinks and other sugar-containing beverages.
Transaction oversight also shapes market structure. The Competition Commission of South Africa provides regulatory review of major deals in the sector, including acquisitions that expand bottling and route-to-market capability. Operational compliance is increasingly tied to resource constraints as well, with water-scarcity exposure and five-year water license renewals under the National Water Act adding permitting and continuity risk for water-intensive beverage production, especially in high-demand hubs such as Gauteng and the Western Cape.
Value Chain Analysis
The South African beverages value chain runs from agricultural inputs (barley, sugar, fruit, and botanicals) to packaging (notably PET, cans, and glass), then to manufacturing and blending/brewing, followed by distribution through a high-share off-trade channel and expanding e-commerce-enabled delivery. In beer, localization of key inputs stands out, with Soufflet Malt's new malting investment adjacent to HEINEKEN's Sedibeng Brewery, designed to reduce reliance on imported malt and tighten inbound logistics. Packaging circularity is another structural lever, as the Western Cape's ZAR 300 million PET processing facility, which started operations in 2025, enables bottle-to-bottle recycling and adds food-grade recycled PET output.
Downstream, distribution performance depends on national warehousing and transport capacity, alongside retailer execution. Large beverage systems operate multi-site footprints and increasingly use consolidated third-party logistics (3PL) models to standardize service levels across provinces. The Coca-Cola system illustrates scale across manufacturing and distribution with 11 plants across 6 provinces, while digital ordering and rapid delivery partnerships are reshaping last-mile fulfillment for off-trade-led beverage purchasing.
Competitive Landscape
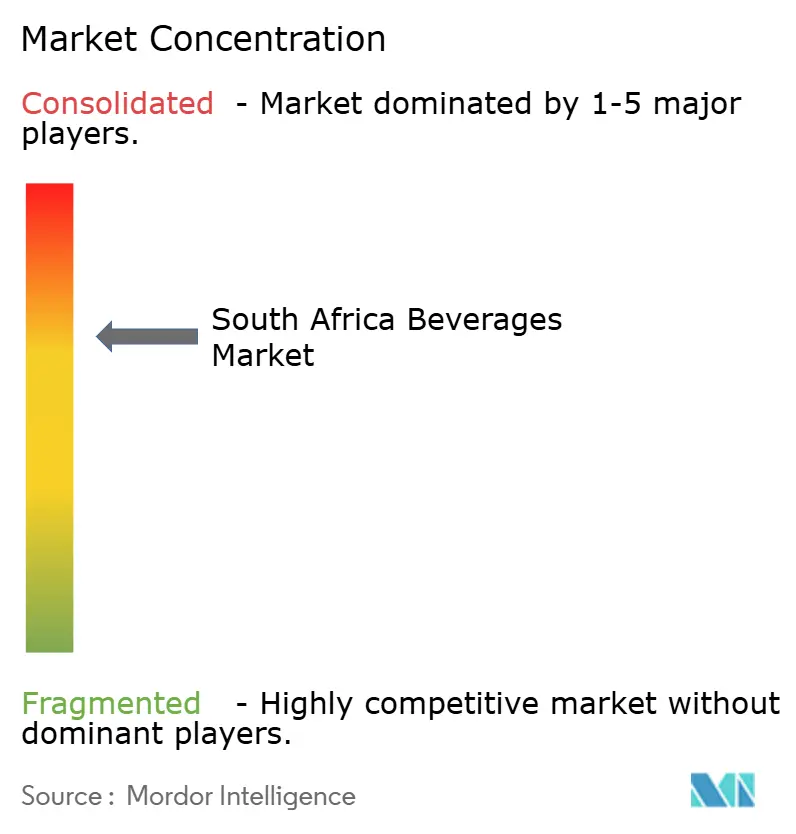
The South African beverage market is moderately concentrated, with intense competition between established multinational corporations and emerging local players employing distinct strategies. AB InBev's South African Breweries holds a significant share of the beer market, competing closely with global entrants like Heineken. For instance, in March 2025, Heineken announced a ZAR 2 billion investment, including its partnership with Soufflet Malt. The competitive landscape further evolved when Varun Beverages acquired BevCo, strengthening PepsiCo's distribution network and challenging Coca-Cola's market position through increased production capacity and local expertise.
Technology adoption is driving competitive differentiation, as companies utilize data analytics for personalized marketing, supply chain efficiency, and consumer engagement through digital platforms. Major players in the market include Anheuser-Busch InBev NV, PepsiCo Inc., Heineken N.V., The Coca-Cola Company, and Red Bull GmbH, among others. Players are increasing their investments in research and development and marketing, and expanding their distribution channels to maintain their roles in the market. They also focus on providing consumers with innovative offerings while including functional benefits in each product.
White-space opportunities are emerging in functional beverages, sustainable packaging solutions, and premium local products that align with authenticity trends. Craft breweries like Soul Barrel Brewing are gaining recognition, winning Best Beer in Africa 2025 by innovatively incorporating traditional ingredients. Similarly, indigenous producers such as Setšong Tea Crafters are expanding their portfolios, moving from organic teas into gin production. Companies that proactively address regulatory requirements, such as sugar reduction and sustainability, are gaining a competitive edge over those that react later.
South Africa Beverages Industry Leaders
-
Anheuser-Busch InBev NV
-
PepsiCo Inc.
-
Heineken N.V.
-
The Coca Cola Company
-
Red Bull GmbH
- *Disclaimer: Major Players sorted in no particular order
Market Opportunities and Future Outlook
Investment-led capacity and localization programs are creating room for suppliers and co-manufacturers across ingredients, packaging, and logistics. In April 2026, the Coca-Cola system in South Africa announced a ZAR 17.6 billion commitment through 2030 across production, distribution, and innovation, and it also cited local procurement linkages, including ZAR 25.6 billion in locally sourced goods and services in 2024. These commitments expand opportunities for domestic ingredient processors, packaging converters, and cold-chain or route-to-market partners that can meet volume, quality, and sustainability requirements.
Upstream substitution and efficiency projects are also opening whitespace in beer inputs and adjacent agri-processing. Soufflet Malt's R2 billion Midvaal malting facility for HEINEKEN, designed around local barley sourcing and reduced import reliance, supports contracted barley supply, storage, and inbound handling services. On the branded portfolio side, regulatory pressure from the Health Promotion Levy continues to favor reformulation, reduced-sugar line extensions, and functional positioning, while water-scarcity risk increases the value of water-efficient manufacturing solutions, reuse systems, and site-level resilience investments for producers operating in Gauteng and the Western Cape.
Recent Industry Developments
- February 2026: SAB/AB InBev SA/NV (SAB) 2025-2026 results release and outlook press materials (SENS filing). The release outlines SAB's 2025-2026 earnings and outlook for the SA beverage market. The update signals financial health and capacity to fund market expansion in SA beverages, informing competitive dynamics and investment appetite for 2026-2031 horizon.
- February 2026: Soufflet Malt breaks ground on R2 billion Midvaal malting facility adjacent to Sedibeng Brewery. The ground-breaking expands upstream malt supply for SA beer production. The project strengthens local sourcing and may reduce import reliance and logistics costs for Heineken Beverages SA.
- February 2026: Soufflet Malt builds new Midvaal malting facility with 100,000 t/year capacity, sourcing 100% local barley. The facility adds 100,000 tonnes of annual malt capacity and will source all barley locally. Local supply chain strengthening could shift malting market dynamics in 2026-2027.
Research Methodology Framework and Report Scope
Market Definition and Coverage
For this study, the South Africa beverages market is defined as the value of alcoholic and non-alcoholic drinks sold for consumption in the country through on-trade and off-trade channels, counted at the market level in USD.
Scope exclusions: We exclude non-beverage liquid foods and ingredient inputs that are not sold as finished drinks (for example, cooking stocks and industrial flavor bases).
Segmentation Overview
- By Product Type
- Alcoholic Beverages
- Beer
- Wine
- Spirit
- Ready-to-Drink (RTD) Cocktails
- Hard Seltzers
- Non-Alcoholic Beverages
- Carbonated Soft Drinks
- Bottled Water
- Juices and Nectars
- Energy and Sports Drinks
- Ready-to-Drink (RTD) Tea and Coffee
- Dairy and Plant-based Drinks
- Other Non-Alcoholic Beverages
- Alcoholic Beverages
- By Packaging Type
- PET Bottles
- Glass Bottles
- Cans
- Tetrapack
- Other
- By Distribution Channel
- On-trade
- Off-trade
- Supermarkets / Hypermarkets
- Convenience Stores
- Online Retail Stores
- Specialty Stores
- By Province
- Gauteng
- KwaZulu-Natal
- Western Cape
- Mpumalanga
- Limpopo
- Rest of South Africa
Data Sources, Market Sizing, and Validation
Desk Research
Desk research was used to set the market context and build the first set of demand and supply signals that the model can be anchored to. We mainly referenced official and public sources such as Statistics South Africa releases, South African Revenue Service customs and excise information, and selected trade data series for relevant beverage flows.
To make the category split and channel assumptions more realistic, we also reviewed sources such as the South African Reserve Bank macro indicators, the Department of Agriculture, Land Reform and Rural Development for upstream agricultural signals that influence beverage inputs, and peer-reviewed nutrition and consumption studies where they help explain shifts in non-alcoholic demand. Company annual reports, investor presentations, and reputable press were used to sanity check direction of pricing and packaging moves, and we also used a paid subscription focused on company financials and news to cross-check public disclosures. The sources listed here are illustrative only, and many other references were also reviewed to collect data, validate it, and clarify open questions.
Primary Interviews and Surveys
Primary work focused on validating what is inside the market, what sits adjacent to it, and what should be treated as a pricing or volume driver in South Africa. We spoke with a mix of manufacturers, distributors, on-trade buyers, and retail-linked respondents, and then cross-checked the feedback with independent channel signals so assumptions did not rely on one viewpoint alone. Since this is a single-country market, interviews were planned to reflect major demand centers and different route-to-market realities.
Distribution of primary research fieldwork respondents
| Company type | Respondent position |
|---|---|
| Top tier: 26% | CXOs: 16% |
| Mid tier: 53% | Functional/Unit leaders: 38% |
| Smaller Players: 21% | Managers: 46% |
Market-Sizing & Forecasting
Sizing starts with a top-down build where reported category consumption patterns and channel splits are reconstructed into a single value pool for beverages in South Africa, and then mapped to alcoholic and non-alcoholic groupings. To keep the totals grounded, we corroborate the outcome with selective bottom-up checks such as sampled brand and channel price points, distributor throughput signals, and supplier roll-ups where coverage is clear enough to avoid double counting.
Key inputs used in the model include the on-trade versus off-trade mix, packaging shifts that change average selling price, inflation and exchange-rate timing for imported inputs that can move shelf prices, and category-level volume direction for beer, wine, spirits, carbonated soft drinks, and energy and sports drinks. Where direct volume signals were patchy, gaps were handled using proxy indicators (like channel traffic direction and price ladder changes) and then re-tested with expert feedback before finalizing the level.
For the forecast, we rely on scenario analysis supported by an ARIMA-based time series view for the total market, and then adjust the category paths using expected pricing progression and channel recovery patterns discussed in primary calls. The end result is a set of forecasts that can be recreated with the same inputs and updated when a major tax, currency, or demand shift occurs.
Data Validation & Update Cycle
Validation is done through repeated checks across the model so that one weak input does not drive the final number. We compare the implied per-capita spending direction with macro household indicators, review category splits against independent consumption and trade signals, and then investigate outliers before sign-off so unusual jumps are explained and documented.
Before publishing, the work goes through a multi-step internal review where assumptions are challenged and recalculated where needed, and analysts re-contact sources when a key variable moves outside the expected range. Reports are refreshed annually, and interim updates are made when material events occur (such as excise changes, sharp currency movements, or category disruptions). Right before delivery, an analyst runs a fresh pass on the key inputs so clients receive the latest updated view.
Mordor Intelligence's South Africa Beverages Market Size Versus Other Published Estimates
Published market sizes for beverages in South Africa often differ because the scope can shift, the year can shift, and the pricing basis can shift, and each of these changes can move the final value by a meaningful amount. We see the biggest differences when sources mix finished beverage sales with adjacent drink-like items, or when they apply a single price inflation path across all categories.
The main gap comes from whether drinkable dairy and plant-based drinks are counted inside beverages, where Mordor Intelligence keeps the core market tied to alcoholic and non-alcoholic drink categories tracked through on-trade and off-trade sales, instead of broadening into wider liquid nutrition baskets.
Benchmark comparison
| Source | Market Size | Gaps in Research Methodology |
|---|---|---|
| Mordor Intelligence | USD 19.80 B (2025) | |
| Industry Research House A | USD 19.80 B (2024) | Uses a different base year and appears to extend the category list to include drinkable dairy and plant-based beverages, which lifts the total when compared to a core beverages-only scope. |
| Sector Analytics Group B | USD 4.13 B (2025) | Limits coverage to alcoholic beverages only, so non-alcoholic categories and the full channel universe are not captured in the stated market value. |
The table shows that most variance is explainable once the scope and year are aligned, rather than being driven by a single calculation step. When we keep categories consistent, apply clear channel inclusion, and test pricing and mix assumptions with real-world feedback, the resulting market size stays traceable to practical inputs and can be updated without changing the logic.
Key Questions Answered in the Report
What is the current value of the South Africa beverage market?
The South Africa beverage market size reached USD 20.79 billion in 2026.
Which segment is growing fastest within South African beverages?
Non-alcoholic beverages are projected to grow at a 6.74% CAGR between 2026 and 2031.
How significant is off-trade retail in beverage sales?
Off-trade channels account for 72.15% of 2025 value and are expanding at 6.10% annually during 2026-2031.
Which province is the growth hotspot for beverage consumption?
Western Cape is forecast to post the fastest provincial CAGR at 5.55% through 2031.