
Market Overview
| Study Period | 2021 - 2031 |
|---|---|
| Forecast Data Period | 2026 - 2031 |
| Base Year Market Size (2025) | USD 0.92 Billion |
| Market Size (2026) | USD 0.98 Billion |
| Market Size (2031) | USD 1.34 Billion |
| Growth Rate (2026 - 2031) | 6.46 % |
| Market Concentration | Medium |
Major Players *Disclaimer: Major Players sorted in no particular order Image © Mordor Intelligence. Reuse requires attribution under CC BY 4.0. | |
South Africa Agricultural Machinery Market Analysis by Mordor Intelligence
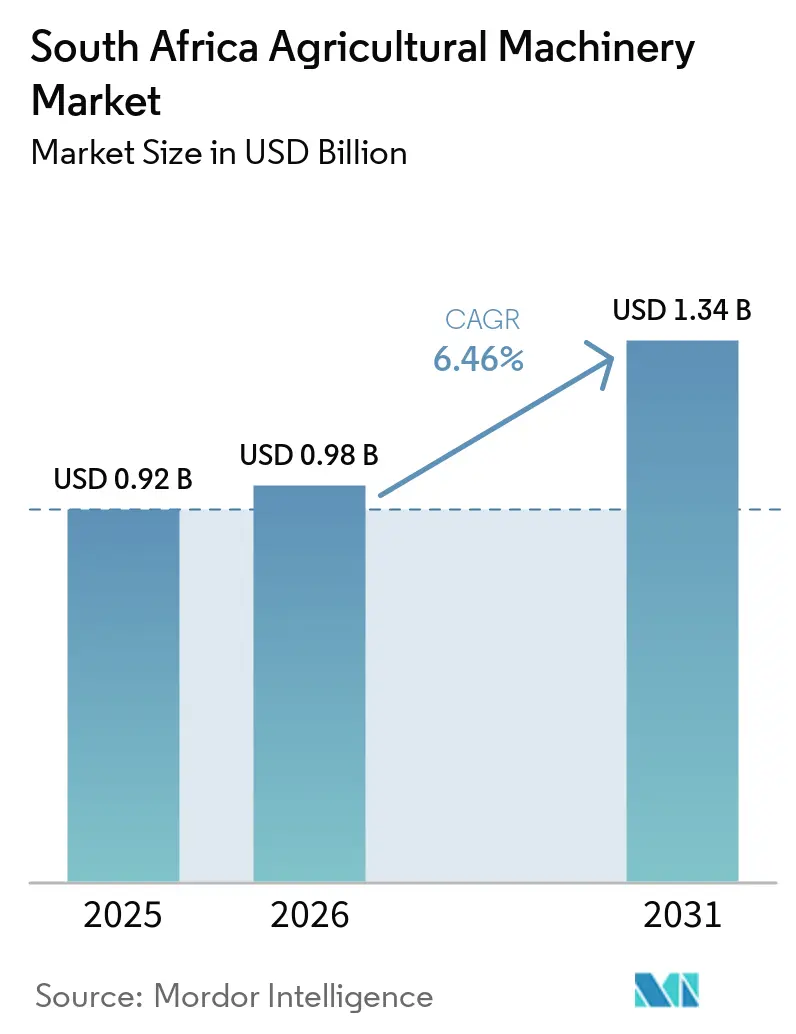
South Africa agricultural machinery market size was valued at USD 0.92 billion in 2025 and estimated to grow from USD 0.98 billion in 2026 to reach USD 1.34 billion by 2031, at a Compound Annual Growth Rate (CAGR) of 6.46% during the forecast period (2026-2031). Persistent grid-power instability is steering commercial farms toward diesel-efficient tractors and autonomous systems that keep production moving during load-shedding windows. Medium operators are scaling up quickly because recapitalization grants from the Department of Agriculture, Land Reform and Rural Development cover up to 50% of machinery costs, while original equipment manufacturer financing arms remove deposit hurdles for large-ticket purchases. Water stress is accelerating spending on pivot and drip irrigation, favoring suppliers that bundle hardware with telemetry that meets provincial water license requirements. Online marketplaces are widening price transparency, prompting authorized dealers to emphasize after-sales service as their main differentiator.
Key Report Takeaways
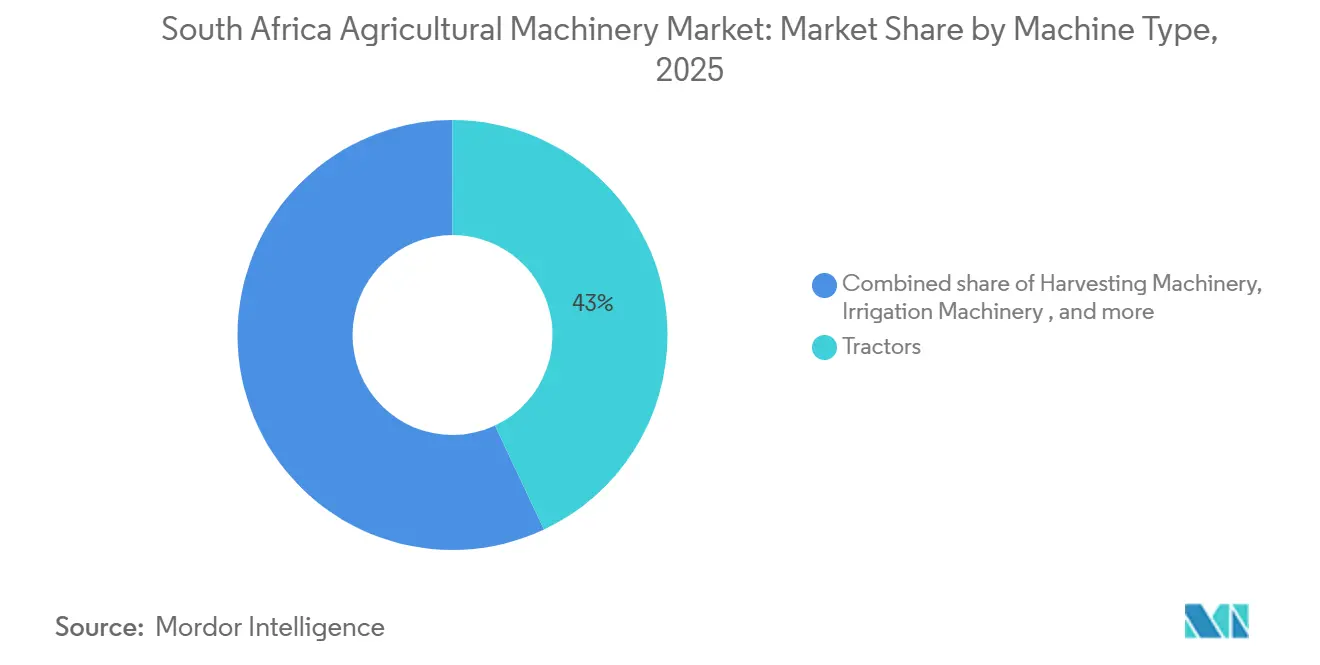
- By type, tractors led with 43% of the South Africa agricultural machinery market share in 2025, while irrigation machinery is projected to record the fastest CAGR of 11.2% through 2031.
Note: Market size and forecast figures in this report are generated using Mordor Intelligence’s proprietary estimation framework, updated with the latest available data and insights as of 2026.
South Africa Agricultural Machinery Market Trends and Insights
Drivers Impact Analysis*
| Driver | (~) % Impact on CAGR Forecast | Geographic Relevance | Impact Timeline |
|---|---|---|---|
| Deepening mechanization demand post-pandemic | +1.8% | National, with a focus on Free State, Mpumalanga, and KwaZulu-Natal | Medium term (2–4 years) |
| Water-scarcity push toward precision irrigation | +1.5% | Northern Cape, Western Cape, and Free State | Long term (≥ 4 years) |
| Government recap grants for emerging farmers | +1.2% | Eastern Cape, Limpopo, and KwaZulu-Natal | Short term (≤ 2 years) |
| Original Equipment Manufacturer (OEM) financing arms lowering entry barriers | +1.0% | National, with higher uptake in the Free State and Western Cape | Medium term (2–4 years) |
| Ag-tech incubators driving machinery-sharing co-ops | +0.7% | Western Cape horticulture clusters and Gauteng peri-urban zones | Long term (≥ 4 years) |
| Sugarcane green-fuel mandate boosting harvester demand | +0.6% | KwaZulu-Natal sugarcane areas | Short term (≤ 2 years) |
| Source: Mordor Intelligence | |||
Deepening Mechanization Demand Post-Pandemic
Commercial agricultural employment in South Africa has increased by 18% since 2020. Despite this, machinery and equipment now account for nearly 60% of capital expenditure, driven by rising labor costs and the need for consistent output. The 40-120 horsepower tractor segment leads the market, offering a balance between operating costs and field capacity, particularly during expensive diesel-generator operations. Government grants are also promoting the adoption of compact utility tractors, which are well-suited for vegetable and legume crop rotations on revitalized farmland. To align with this demand, dealer networks are prioritizing inventory of entry-level models over premium articulated options.
Water-Scarcity Push Toward Precision Irrigation
South Africa's agricultural sector relies heavily on water, accounting for 55-60% of the country's total water consumption. Recent drought declarations in the Northern Cape and Western Cape have led growers to shift from flood irrigation to pivot and drip systems, which can reduce water usage by up to 40%. In 2024, advanced groundwater and aquifer mapping identified new water resources, driving increased demand for variable-rate fertigation controllers and precision monitoring systems among South African growers. Companies such as Lindsay Corporation are integrating pivots with soil sensors and weather telemetry, helping farms comply with water-license requirements. Additionally, recurring revenue from data subscriptions provides these suppliers with improved cash flow predictability, further supporting the adoption of these technologies.
Government Recap Grants for Emerging Farmers
The South African agricultural machinery market is experiencing growth driven by government-led recapitalization initiatives. Notable programs include the Comprehensive Agricultural Support Programme (CASP), with a budget of ZAR 1.685 billion (USD 93 million), and the Ilima/Letsema allocation, amounting to ZAR 677.4 million (USD 37 million)[1]. Regional projects, such as the Eastern Cape irrigation revival launched in January 2026, further stimulate demand by allocating funds for high-intensity equipment and solar-pump bundles. To address challenges associated with Public Finance Management Act procurement processes, Original Equipment Manufacturers (OEMs) have collaborated directly with the ministry through prequalified vendor panels. This strategy ensures quicker delivery of subsidized technology to farmers, enhancing the efficiency and commercial sustainability of the entry-level equipment market
Original Equipment Manufacturer (OEM) Financing Arms Lowering Entry Barriers
Deere and Company Financial and similar entities offer zero-deposit plans spanning 4 to 6 years, mitigating residual-value risk for financially constrained growers[2]. Balloon payment structures, aligned with harvest cycles, are particularly appealing to grain producers in regions such as the Free State and Mpumalanga that face price volatility. AGCO Corporation and CNH Industrial N.V. enhance these financing packages by including warranties and telematics, generating subscription revenue that offsets narrow hardware margins. Additionally, tariff-free tractor imports have heightened price competition, shifting the focus from product specifications to financing terms as the primary competitive factor.
Restraints Impact Analysis*
| Restraint | (~) % Impact on CAGR Forecast | Geographic Relevance | Impact Timeline |
|---|---|---|---|
| Grid-power instability inflating operating costs | -1.3% | National, with acute impact in Free State, Mpumalanga, and KwaZulu-Natal | Short term (≤ 2 years) |
| Rising interest rates curbing cap-ex cycles | -1.1% | National, with a stronger effect on medium farms in the Western Cape and Limpopo | Medium term (2–4 years) |
| Grey-market imports undermining dealer margins | -0.8% | National, with clusters in Gauteng and Western Cape | Medium term (2–4 years) |
| Digital skills gap for high-tech equipment | -0.6% | Rural Eastern Cape, Limpopo, and Northern Cape | Long term (≥ 4 years) |
| Source: Mordor Intelligence | |||
Grid-Power Instability Inflating Operating Costs
In early 2025, Stage 6 load shedding forced farmers to depend on diesel generators, leading to a 40% increase in energy costs and delaying equipment upgrades. By February 2026, the South African grid achieved stability, maintaining over 300 consecutive days without outages, which supported a 1.6 GW increase in farm-level solar capacity. Tractor operating hours were shifted to daylight to minimize reliance on artificial lighting, reducing the utilization efficiency of larger units. The National Energy Regulator approved average tariff increases of 12.7% for 2025-2026, adding to cost pressures[3]. Although original equipment manufacturers are introducing hybrid diesel-electric tractors, rural charging infrastructure remains insufficient. Sugarcane and timber operations, which require a consistent power supply, continue to face challenges until microgrid solutions become more widely available.
Rising Interest Rates Curbing Capital-Expenditure Cycles
The prime rate, surpassing 11% through 2025, has extended tractor loan repayment periods beyond practical lifespans, leading to an 8% decline in combine purchases during the first quarter of 2025. Medium-sized farms in the Western Cape and Limpopo, reliant on commercial bank financing, have postponed equipment upgrades, choosing instead to repair existing machinery. Elevated interest rates have also decreased land values, reducing the collateral available for securing credit lines. Conversely, well-capitalized large operators have continued investing in precision equipment, further widening the productivity gap. Any potential relief depends on inflation moderation and the possibility of an easing cycle in late 2026, both of which remain uncertain.
*Our forecasts treat driver/restraint impacts as directional, not additive. The impact forecasts reflect baseline growth, mix effects, and variable interactions.
Segment Analysis
By Machine Type: Tractors Hold the Dominant Share
Tractors held 43% of South Africa agricultural machinery market share in 2025, while irrigation machinery is projected to record the fastest CAGR of 11.2% through 2031, confirming their position as the workhorse for tillage, planting, and haulage duties. Medium 40 to 120 horsepower models maintain a leading position due to their combination of solid field capacity and reduced diesel consumption during Stage-6 generator cycles. In response to drought-resilience mandates, South African farms are increasingly adopting center-pivot and drip irrigation systems, driving growth in the irrigation machinery segment, which is projected to achieve a notable CAGR through 2031. In the Northern Cape, advanced aquifer mapping is supporting borehole development, allowing vendors to expand market share by offering high-efficiency pumps and telemetry systems, often bundled with competitive financing options.
Planting equipment remains stable, with growers preferring no-till seed drills and precision planters that minimize input overlap and improve stand counts in crops such as corn and soybeans. Harvesting equipment experienced a recovery in 2025, with combine sales increasing as stronger grain prices enabled the use of deferred replacement budgets. Plowing and cultivating tools are under pressure as conservation farming reduces the demand for deep tillage, shifting buyer interest toward lighter cultivators that preserve protective residue. Haying and forage machinery remains a niche segment; however, balers could see increased demand if biomass energy projects expand under future renewable energy mandates.

Geography Analysis
The Free State remains the largest buyer of agricultural machinery, driven by significant provincial spending in 2025. The region's flat corn belt supports high-horsepower fleets and bulk combine purchases. Meanwhile, the Northern Cape is anticipated to experience the fastest growth. This growth is attributed to groundwater mapping, which is unlocking thousands of new irrigated hectares and boosting demand for pivot irrigation systems. The Free State's scale provides dealers with predictable service revenue, justifying the maintenance of large inventories. In contrast, Northern Cape's greenfield projects favor suppliers offering bundled solutions, such as pumps with telemetry systems. Together, these two provinces lead capital deployment in South Africa's agricultural machinery market.
KwaZulu-Natal demonstrates strong demand for harvesters, driven by the ethanol mandate, while the Western Cape focuses its investments on compact utility tractors and precision sprayers tailored to its horticulture clusters. Gauteng's peri-urban vegetable and poultry hubs prioritize greenhouse automation. Limpopo and Mpumalanga balance investments in fruit and timber machinery, though credit constraints slow fleet renewal in these regions. North West maintains a steady demand for grain and livestock equipment but faces challenges from land-tenure uncertainties, which dampen investment. The Eastern Cape currently holds the smallest market share but is showing renewed activity following the launch of a provincial irrigation revival scheme that provides subsidized implements to emerging farmers.
Future growth across provinces depends on targeted incentives and infrastructure improvements aimed at narrowing productivity gaps. In the Northern Cape, renewable microgrids are anticipated to provide reliable power for remote pivot systems, while Free State operators are testing autonomous tractors to reduce labor costs during load-shedding events. Online marketplaces are expanding access to used imports, particularly in Gauteng and the Western Cape. Additionally, government recapitalization grants continue to support smallholder mechanization programs. Financing options, such as zero-deposit leases, and bundled precision irrigation services are further enabling growth. These developments position all regions to contribute incremental volume, driving the overall growth of South Africa's agricultural machinery market through 2031.
Regulatory Landscape
South Africa agricultural machinery safety and use are primarily governed under the Occupational Health and Safety Act (Act 85 of 1993), including the Driven Machinery Regulations (2015), which set requirements for guarding, operation, and safe supervision of machinery in workplaces. In August 2025, the Department of Employment and Labour published Draft General Machinery Regulations 2025 for public comment, indicating an update cycle that could tighten compliance expectations for OEMs, importers, and dealer service networks that commission and maintain equipment in market.
On technical compliance and market access, the South African Bureau of Standards (SABS) maintains South African National Standards (SANS) relevant to agricultural tractors and equipment. The National Regulator for Compulsory Specifications (NRCS) then enforces compulsory specifications that reference SANS to protect health and safety. From a trade standpoint, core agricultural machinery imports (including tractors and certain soil preparation equipment) generally enter duty-free, and the International Trade Administration Commission (ITAC) remains the formal authority for tariff investigations, maintaining policy tools while supporting mechanization affordability.
Competitive Landscape
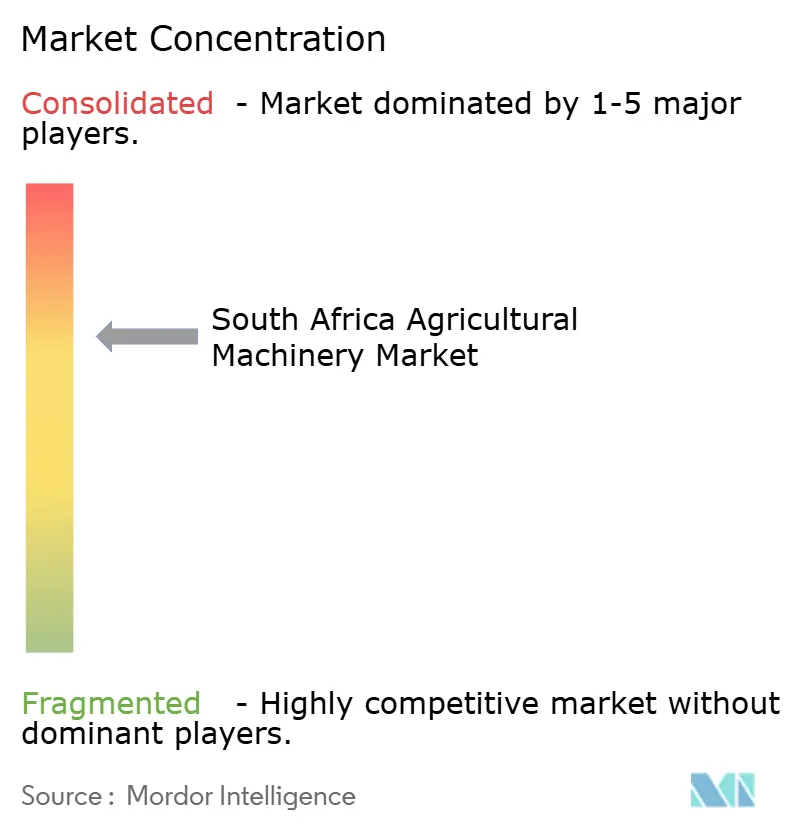
The South Africa agricultural machinery market remained moderately consolidated in 2025. Deere & Company and AGCO Corporation are key players in the market. Deere & Company leverages its JDLink telematics system and zero-deposit lease options to strengthen relationships with large grain producers. Meanwhile, AGCO Corporation's Massey Ferguson network operates across all provinces, excelling in mid-horsepower tractor sales. These companies set product standards, influence financing terms, and shape pricing for parts. Both companies also include multi-year data subscriptions in equipment packages, generating recurring revenue and supporting dealer profitability.
Other leading players, including CNH Industrial N.V., Mahindra and Mahindra Ltd., and Claas KGaA mbH, focus on technology-driven niches rather than engaging in direct price competition. CNH Industrial N.V. is advancing a hybrid power-take-off system designed to reduce fuel consumption by 25%, providing growers with a solution to manage diesel price volatility. Mahindra and Mahindra Ltd. targets high-torque applications with its Oja tractor range, specifically designed for sugarcane and vineyard operations requiring four-wheel drive. Claas KGaA mbH emphasizes chop-length control technology on its forage harvesters, catering to dairy regions that prioritize high-quality silage production.
Future market growth is projected to be driven by advancements in embedded electronics, captive financing options, and regional assembly partnerships aimed at reducing lead times. Deere & Company and AGCO Corporation plan to enhance remote diagnostic capabilities, enabling dealers to pre-dispatch parts and minimize downtime for large fleets. CNH Industrial N.V. is exploring subscription-based models for its hybrid systems, while Mahindra is investigating knock-down kit assembly to mitigate shipping delays. If these strategies align with increasing provincial grants and improved rural connectivity, suppliers are likely to expand addressable demand and boost overall market volume through 2031.
South Africa Agricultural Machinery Industry Leaders
-
Deere & Company
-
CNH Industrial N.V.
-
AGCO Corporation
-
Kubota Corporation
-
Mahindra & Mahindra Ltd
- *Disclaimer: Major Players sorted in no particular order
Market Opportunities and Future Outlook
Government-backed mechanization and infrastructure spend continues to create demand pockets, especially where provincial delivery programs and grant frameworks support equipment purchases alongside irrigation and on-farm infrastructure. In May 2026, the national agriculture department communicated a CASP allocation of R1.14 billion across provinces for infrastructure, irrigation, and mechanization, and merging CASP and Ilima/Letsema grant frameworks reduces administrative duplication for suppliers participating in state-supported projects. Provincial procurement activity also supports dealer throughput and service attachment, including a 2024/25 Gauteng tender for a 36-month panel to supply and deliver mechanization and agri-logistics for herb, grain, and vegetable farmers.
Opportunities are also emerging around connected machinery and precision agronomy services that can be bundled with hardware. The rollout of a hybrid digital extension support platform (mobile and web-based) creates room for OEMs and technology vendors to integrate telematics, remote diagnostics, and operator coaching into tractor and irrigation packages, particularly for emerging farmers receiving subsidized assets. Water-stress adaptation is further strengthening precision irrigation and telemetry bundles that help farms align with water-license compliance requirements, sustaining demand for end-to-end offerings that combine equipment, monitoring, and service contracts.
Recent Industry Developments
- May 2026: Zoomlion launched its DV3504 hybrid tractor in South Africa at NAMPO 2026 and moved to a dealership-led go-to-market approach with partners such as SNA Agriculture, BKB, AgriPresisie en Parte, Oelofse Trekkers, and Dicla Agri Group. The shift broadens product and price-point options for buyers while increasing competitive pressure on incumbents to defend dealer mindshare, parts availability, and financing-led sales motions.
- October 2025: John Deere launched the 2144G tracked harvester in South Africa for high-yield eucalyptus and pine plantation applications. The launch expands mechanization options in forestry-linked operations, and it supports higher-value aftermarket demand for specialized undercarriage, maintenance, and uptime-focused service support.
- May 2025: AFGRI Group acquired John Deere dealerships previously operated by MASCOR in KwaZulu-Natal and the Lowveld. This dealership consolidation expands service coverage and parts logistics for John Deere fleets in key farming regions, while raising the bar for competing brands on local support capability and response times.
Research Methodology Framework and Report Scope
Market Definition and Coverage
This market is sized as the value of agricultural machinery sold and used in South Africa for core farm operations, covering field preparation, planting, harvesting, forage handling, irrigation, and tractors.
Scope exclusions: routine repair services, fuel and lubricants, and general farm consumables that are not machinery purchases are excluded from the model.
Segmentation Overview
- By Machine Type
- Tractors
- Horsepower
- Below 40 HP
- 40 - 120 HP
- Above 120 HP
- Utility Type
- Compact Utility Tractors
- Utility Tractors
- Row Crop Tractors
- Horsepower
- Plowing and Cultivating Machinery
- Ploughs
- Harrows
- Cultivators and Tillers
- Other Planting and Cultivating Machinery (Rotary Hoes, Ridge Formers, etc.)
- Planting Machinery
- Seed Drills
- Planters
- Spreaders
- Other Planting Machinery (Transplanters, Bed Planters, etc.)
- Harvesting Machinery
- Combine Harvesters
- Forage Harvesters
- Other Harvesting Machinery (Sugarcane Harvesters, Potato Harvesters, etc.)
- Haying and Forage Machinery
- Mowers and Conditioners
- Balers
- Other Haying and Forage Machinery (Tedders, Rakes, etc.)
- Irrigation Machinery
- Sprinkler Irrigation
- Drip Irrigation
- Other Irrigation Machinery (Pivot Corner Arms, Flood Irrigation Sets, etc.)
- Other Machinery Types (Grain Dryers, Farm Loaders, etc.)
- Tractors
Data Sources, Market Sizing, and Validation
Desk Research
Desk research was used to set the factual base for farm activity, equipment demand signals, and price direction before assumptions were taken into interviews. We relied on public references such as national agriculture and trade statistics, customs import and export series, central bank macro indicators (inflation and exchange rate), and government water and irrigation updates where available.
To make the sizing more realistic, we also reviewed annual reports and investor decks from active equipment suppliers and distributors, dealer and association websites, and reputed press coverage around planting seasons and harvest outcomes. For cross-checking import dependency and average pricing movement, an import and export shipment-level database and a company financials and intelligence subscription were used selectively, mainly to validate direction rather than to replace primary inputs. These desk sources are illustrative only, and many other public references were used during data collection, validation, and clarification.
Primary Interviews and Surveys
Primary work focused on interviews and structured surveys with machinery dealers, distributors, large farm operators, financing partners, and service heads who see ordering patterns and replacement cycles firsthand. Since this is a single-country market, we emphasized coverage across major farming belts and crop systems, so assumptions on demand timing, availability, and discounting could be checked and then adjusted.
Distribution of primary research fieldwork respondents
| Company type | Respondent position |
|---|---|
| Top tier: 30% | CXOs: 12% |
| Mid tier: 56% | Functional/Unit leaders: 40% |
| Smaller Players: 14% | Managers: 48% |
Market-Sizing & Forecasting
Sizing starts with a top-down build where the addressable equipment demand pool is reconstructed from South Africa farm activity and mechanization needs, and then split across major machinery categories. In practice, planted area and cropping intensity, tractor fleet replacement behavior, seasonal rainfall expectations, irrigation investment intensity in water-stressed regions, and import mix trends were treated as key steering inputs (illustrative, not exhaustive).
Once this structure was set, we corroborated totals using selective bottom-up approximations, like dealer sell-through checks and sampled ASP times volume for tractors and key implements, which helped correct for discounting and model-mix shifts. Where direct volume signals were weak for smaller equipment types, gaps were handled through proxy ratios tied to cultivated area and typical equipment attachments per tractor, and then normalized using interview feedback.
Forecasting was done using scenario analysis because machinery purchases in South Africa can swing with weather and farm income, and respondents typically explain timing changes better than a single straight-line trend. The base case was stress-tested with exchange-rate sensitivity, input-cost inflation, and expected financing availability, and the final curve was kept consistent with the observed replacement cycle and investment payback logic shared in primary discussions.
Data Validation & Update Cycle
Outputs were validated through multiple checks, starting with internal consistency tests between category shares, implied unit counts, and reasonable price bands. We then compared results against independent signals like machinery import direction, dealer stocking commentary, and farm investment sentiment, and any large variance triggered a deeper review of the specific assumption behind it.
Before sign-off, the model is reviewed step-by-step by another analyst, and follow-up calls are initiated when a key input shifts or a segment shows an unusual swing versus known seasonality. Reports are refreshed annually, with interim updates when material events occur, and a final pre-delivery review is completed so the latest public and primary signals are reflected.
Mordor Intelligence's South Africa Agricultural Machinery Market Size Versus Other Published Estimates
Published market sizes for South Africa agricultural machinery can look different even when the topic name sounds the same, because the counted equipment set, the base year, and the price logic are not always aligned. Differences also come from whether estimates are anchored to farm demand indicators or are extrapolated mainly from older trend lines.
The main gap comes from whether irrigation machinery and haying and forage equipment are counted inside the same total, and how tractor pricing is converted and updated in a volatile currency environment. Mordor Intelligence counts only machinery value within defined equipment categories and updates average price progression using recent dealer discounting and import-mix signals.
Benchmark comparison
| Source | Market Size | Gaps in Research Methodology |
|---|---|---|
| Mordor Intelligence | USD 0.92 B (2025) | |
| Industry Marketplace A | USD 0.86 B (2024) | Uses a different base year and forecast window, and the public summary does not clarify whether all machinery categories are included consistently or how local-currency pricing is refreshed across years. |
| Trade News Digest B | USD 0.81 B (2023) | Anchored to an earlier market year and presented at a sector level, with limited visibility on equipment scope, exchange-rate timing, and whether dealer-level discounting and model-mix changes are reflected. |
Looking across the three figures, the spread is largely explained by scope completeness, base-year choice, and how price progression is treated for tractors and imported equipment. By keeping the inputs tied to farm activity signals and cross-checking them with channel feedback, the final estimate stays easier to trace and repeat when assumptions are updated.
Key Questions Answered in the Report
What is the current value of the South Africa agricultural machinery market?
It was valued at USD 0.98 billion in 2026 and is on track to reach USD 1.34 billion by 2031.
How fast is the market projected to grow?
The forecast Compound Annual Growth Rate is 6.46% between 2026 and 2031.
Which machine type leads spending?
Tractors led with 43% of South Africa agricultural machinery market in 2025.
Why is precision irrigation gaining traction?
Water scarcity and new groundwater mapping encourage growers to adopt pivot and drip systems that cut water use by up to 40%.