
Market Overview
| Study Period | 2021 - 2031 |
|---|---|
| Forecast Data Period | 2026 - 2031 |
| Base Year Market Size (2025) | USD 5.42 Billion |
| Market Size (2026) | USD 5.7 Billion |
| Market Size (2031) | USD 7.37 Billion |
| Growth Rate (2026 - 2031) | 5.25 % |
| Market Concentration | Low |
Major Players *Disclaimer: Major Players sorted in no particular order Image © Mordor Intelligence. Reuse requires attribution under CC BY 4.0. | |
South Africa Third-Party Logistics (3PL) Market Analysis by Mordor Intelligence
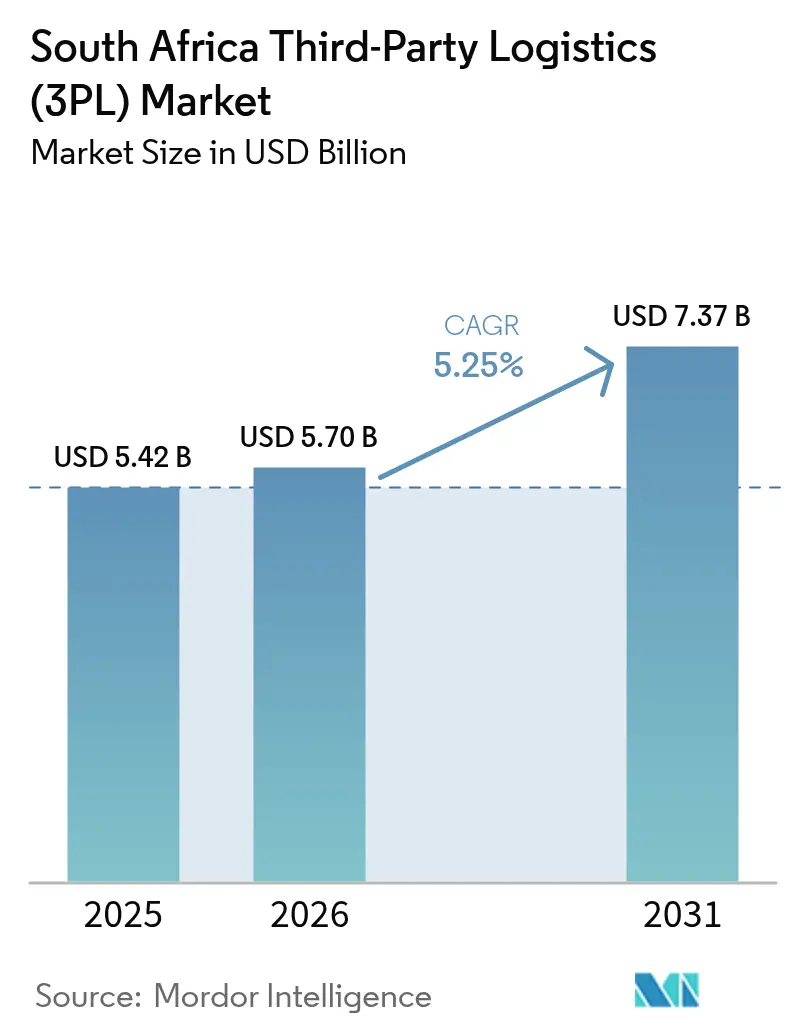
The South Africa Third-Party Logistics Market size in 2026 is estimated at USD 5.70 billion, growing from 2025 value of USD 5.42 billion with 2031 projections showing USD 7.37 billion, growing at 5.25% CAGR over 2026-2031.
Spending on logistics still exceeds 11% of national GDP, yet the shift from road-only freight toward multimodal solutions is steadily lowering total landed costs and widening service offerings. E-commerce fulfillment, automotive exports, and infrastructure upgrades along the Durban–Gauteng corridor are reshaping service portfolios, while technology investments in telematics and AI are improving asset utilization and security. Asset-light models remain prevalent, but hybrid fleets are gaining traction as operators balance capital efficiency with capacity control. Rising cross-border demand under the African Continental Free Trade Area (AfCFTA) reinforces South Africa’s position as a gateway for regional trade growth.
Key Report Takeaways
- Domestic Transportation Management held 41.45% of the South Africa third-party logistics market share in 2025.
- Value-Added Warehousing & Distribution is projected to post the fastest segment growth at 7.29% CAGR through 2031.
- E-commerce accounted for 23.30% of the South Africa third-party logistics market size in 2025, while Life Sciences & Healthcare is poised to expand at an 8.08% CAGR over the same horizon.
- Asset-light providers commanded a 51.35% share of the South Africa third-party logistics market in 2025; hybrid models are expected to grow at a 6.61% CAGR to 2031.
Note: Market size and forecast figures in this report are generated using Mordor Intelligence’s proprietary estimation framework, updated with the latest available data and insights as of 2026.
South Africa Third-Party Logistics (3PL) Market Trends and Insights
Drivers Impact Analysis*
| Driver | % Impact on CAGR Forecast | Geographic Relevance | Impact Timeline |
|---|---|---|---|
| E-commerce boom & last-mile demand | +1.2% | National, concentrated in Gauteng, Western Cape, KZN | Short term (≤ 2 years) |
| Automotive export-led logistics growth | +0.8% | Eastern Cape, Gauteng, KZN coastal corridors | Medium term (2-4 years) |
| Infrastructure upgrades on N3 & Durban port | +0.9% | KZN-Gauteng corridor, Durban metropolitan area | Medium term (2-4 years) |
| AfCFTA-driven cross-border trade flows | +0.7% | Border provinces, Gauteng hub, port cities | Long term (≥ 4 years) |
| Near-shoring of global supply chains into SA | +0.5% | Industrial corridors, Special Economic Zones | Long term (≥ 4 years) |
| Telematics-enabled cost efficiency for 3PLs | +0.6% | National, early adoption in urban centers | Short term (≤ 2 years) |
| Source: Mordor Intelligence | |||
E-commerce boom & last-mile demand
Online retail turnover reached ZAR 71 billion (USD 3.9 billion) in 2024, a 29% rise year on year, and the last-mile segment is expected to exceed USD 2.3 billion by 2030. Grocery shoppers ordering online now represent 53% of the customer base, accelerating demand for urban micro-fulfillment nodes. Locker networks have expanded to roughly 1,200 units, cutting door-to-door costs and boosting delivery density. Platforms such as Bob Go processed 1.9 million shipments during H1 2025, evidencing SME appetite for outsourced fulfillment. Warehouse investments that feature automated guided vehicles and AI-based inventory controls, typified by Huawei’s 30,000 sqm Cape Town center, illustrate the sophistication required to maintain delivery velocity.
Automotive export-led logistics growth
The automotive sector contributes 6.2% to GDP and sustains over 93,000 manufacturing jobs, generating sizable volumes for component consolidation and vehicle exports via Eastern Cape ports. Chinese automakers lifted domestic market share from 12% to 21% between 2019 and 2024, intensifying competitive pressures on local assembly lines and the supporting logistics network. Containerized vehicle-transport platforms such as Kar-Tainer mitigate ro-ro lead-time spikes and protect units in transit. Incentives under the Automotive Production and Development Programme underpin further OEM production volume commitments, opening opportunities for specialized just-in-time delivery and reverse-logistics services.
Infrastructure upgrades on N3 & Durban port
Transnet allocated R233 million to rehabilitate 16 critical roads inside the Port of Durban, which handles 60% of national container volumes[1]. The privately financed R3.4 billion Newlyn PX Bayhead Rail Terminal will manage 1,400 daily truck moves within a multimodal precinct. SANRAL’s R48 billion N2/N3 widening will double lane capacity and cut congestion between Durban and Gauteng[2]. Upgrades target the 20% rise in cross-border transit times that added R170 million in annual delay costs and will give 3PLs more predictable transit schedules.
AfCFTA-driven cross-border trade flows
Duty-free access to 1.3 billion consumers is expected to lift intra-African trade to USD 192.2 billion in 2024. Customs brokerage demand is rising as operators navigate varied border processes; South African 3PLs are investing in digital pre-arrival systems to speed clearances. The Maputo Development Corridor positions Mpumalanga for mineral and agricultural exports, while the Single African Air Transport Market promises lower freight costs for time-sensitive commodities. Compliance with the Border Management Authority’s risk-based controls is pushing the adoption of advanced cargo-tracking and electronic documentation capabilities.
Restraints Impact Analysis*
| Restraint | % Impact on CAGR Forecast | Geographic Relevance | Impact Timeline |
|---|---|---|---|
| Rail & port bottlenecks | -1.1% | National, concentrated at Durban, Richards Bay, Cape Town ports | Short term (≤ 2 years) |
| High and volatile diesel prices | -0.8% | National, affecting road transport operations | Short term (≤ 2 years) |
| Skilled labour gap in warehouse automation | -0.6% | Urban centers, industrial hubs | Medium term (2-4 years) |
| Cargo-theft hotspots along N3 corridor | -0.4% | N3 corridor, Gauteng province | Short term (≤ 2 years) |
| Source: Mordor Intelligence | |||
Rail & port bottlenecks
Durban continues to face berth congestion and equipment shortages that depress vessel productivity and increase dwell times. Richards Bay’s annual shutdowns to unlock rail slots succeeded in removing 1,035 daily truckloads from roads, yet underscore structural capacity deficits. Private-sector entry onto the Transnet rail network was formally approved in 2024, aiming to mobilize investment and restore reliability for bulk and container flows. Shippers diverted more than one-quarter of long-haul volumes from rail to roads over the past five years, boosting highway congestion and freight costs. Stakeholder alignment on open-access frameworks is critical to attract capital and modernize rolling stock.
High and volatile diesel prices
Diesel accounts for close to 50% of daily trucking costs, and pump prices climbed by up to ZAR 1.50 per liter during 2024. Extended client payment cycles reaching three months stretch operator liquidity. Some fleets respond by deploying load-planning software, rigorous driver coaching, and fuel procurement agreements to cap expenditure volatility. Leaders are piloting battery-electric trucks; Takealot reported 19% lower total cost of ownership and 14 tons of annual CO₂ cuts per vehicle. Wider electrification hinges on charging-station density and targeted incentives to offset higher upfront capital costs.
*Our forecasts treat driver/restraint impacts as directional, not additive. The impact forecasts reflect baseline growth, mix effects, and variable interactions.
Segment Analysis
By Service: Multimodal Integration Drives Efficiency
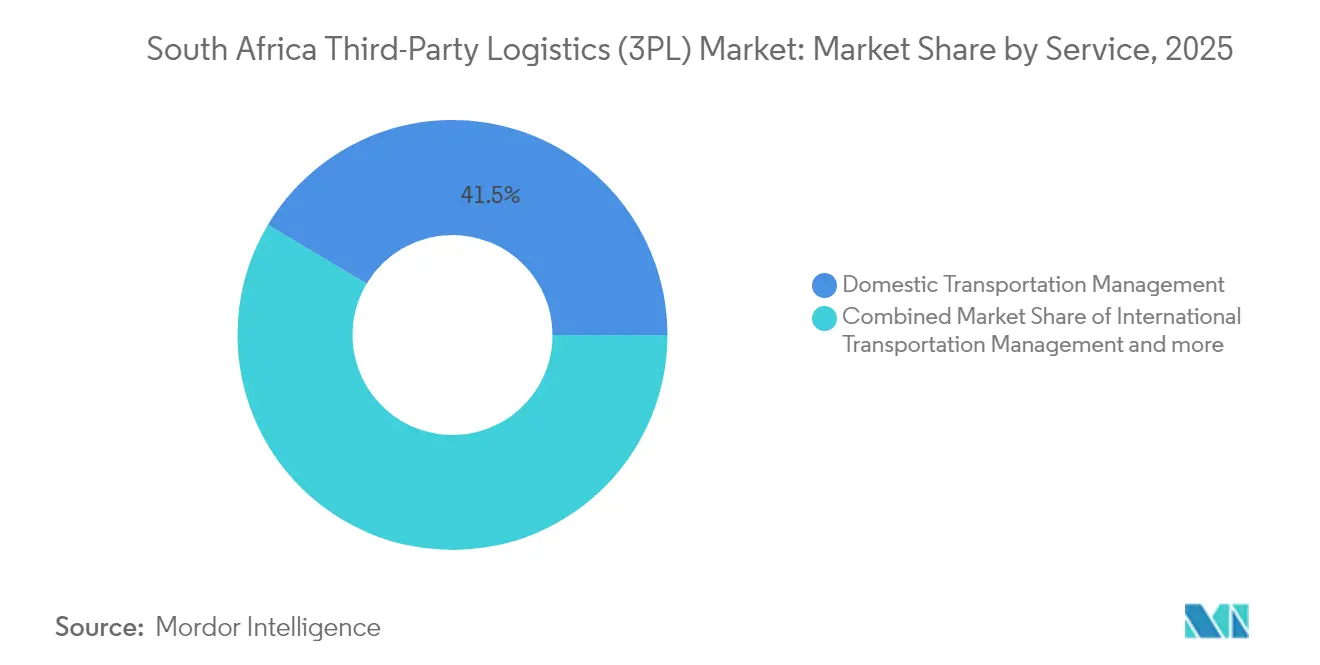
Domestic Transportation Management led with 41.45% of the South Africa third-party logistics market share in 2025, reflecting the road freight dominance in inland movements. Value-Added Warehousing & Distribution is projected to register a 7.29% CAGR, supported by automated facilities such as Shoprite’s Cilmor hub featuring 133 dock doors and high-density picking systems. The South Africa third-party logistics market size attached to international transport will benefit from AfCFTA-induced volume, but remains constrained by port congestion. Multimodal solutions that blend road, rail, and coastal shipping are increasingly specified in large tenders, indicating a structural pivot away from single-mode contracting.
Investment in supply-chain visibility is rising across all services. DSV opened a 100,000 sqm logistics campus near O.R. Tambo International Airport, consolidating air, ocean, road, and cross-dock operations within one technology-enabled platform. Grindrod leverages IoT sensors and cloud analytics to offer real-time cargo location dashboards, shortening exception-response cycles. Such capabilities set new performance baselines, reinforcing the market’s drift toward integrated, data-rich service contracts.

By End-User: Healthcare Logistics Accelerates Growth
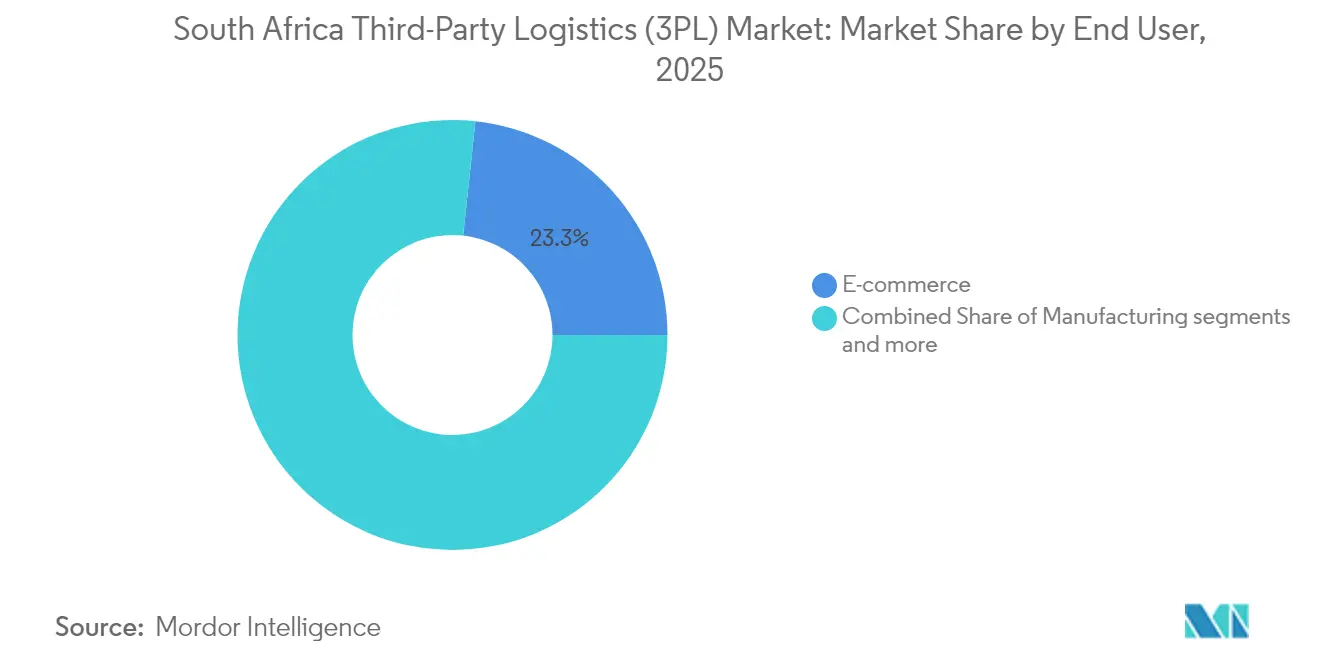
E-commerce retained 23.30% of the South Africa third-party logistics market size in 2025, buoyed by more than 1 billion online transactions annually. Life Sciences & Healthcare is forecast to expand at an 8.08% CAGR, propelled by vaccine storage requirements and growing biologics imports. DHL commissioned a specialized cold-chain facility adjacent to O.R. Tambo Airport, illustrating the capital intensity required to secure pharmaceutical integrity. The maritime reefer trade for citrus and grapes supports demand for validated temperature-controlled trucking networks, while regulatory oversight under the Foodstuffs, Cosmetics and Disinfectants Act tightens compliance obligations.
Automotive exports stimulate specialized parts sequencing and milk-run services, but component supply volatility linked to global steel market shifts adds complexity. Consumer Goods and FMCG players focus on mixed-case palletization and rural route-to-market coverage; security-sensitive Technology & Electronics shippers mandate sealed trailer operations and dual-driver protocols. The South Africa third-party logistics market share associated with cold-chain foodservice has risen as quick-service restaurant chains expand footprint, pushing 3PLs to add multi-temperature vehicles and hazard-analysis protocols.
By Logistics Model: Hybrid Approaches Gain Traction
Asset-light operators accounted for 51.35% of the South Africa third-party logistics market in 2025, relying on subcontracted fleets and leased warehouses to limit capital exposure. Hybrid models are projected to post a 6.61% CAGR, combining owned assets in strategic nodes with flexible partner capacity elsewhere, enabling service continuity during peak demand. Imperial Logistics exemplifies the model, integrating owned fleet operations with third-party alliances across 25 countries. Asset-heavy providers remain relevant in contract logistics requiring dedicated, high-spec equipment; Vector Logistics’ voice-directed picking technology raises accuracy and labor productivity in temperature-controlled distribution.
Telematics penetration is set to climb from 47.3% to 70% by 2028 as 98% of fleet managers budget for additional digital tools. Predictive maintenance and driving-behavior analytics lower unplanned downtime, supporting higher on-time delivery metrics. The South Africa third-party logistics industry continues to recalibrate capital allocation between trucks, IT, and warehouse automation to sustain margins in an environment of cost-plus pricing pressure.
Geography Analysis
Gauteng generates 34% of national GDP and anchors the country’s freight flows; the province secured R52.3 billion in new investment during 2023/24, including R21.6 billion from foreign investors, reinforcing its role as the core consolidation hub. The R21 corridor linking Pretoria to O.R. Tambo Airport is evolving into an inland port zone, attracting multinationals such as DSV and Takealot with bonded-warehouse incentives and rapid freeway access.
KwaZulu-Natal’s Port of Durban moves 60% of containers but grapples with quay congestion and variable truck turnaround times. Upgrades at the Dube TradeZone Special Economic Zone provide uninterruptible power and in-park customs offices, appealing to electronics assembly and high-value manufacturing tenants. Western Cape exports wine, fruit, and finished foods through Cape Town, necessitating chilled reefers and EU-compliant phytosanitary handling. Limited rail connectivity prompts intermodal operators to truck reefers north to inland depots before railing to ports.
Eastern Cape hosts automotive clusters around Gqeberha (Port Elizabeth), generating demand for sequencing centers and line-side deliveries. The Vaal Special Economic Zone in Gauteng seeks to integrate air, road, rail, and inland water transport to support mining supply chains. New rail spur links to Botswana and Zimbabwe via Limpopo are under feasibility study, aimed at diverting mineral exports from congested coastal ports. Across all regions, SARS’ mandatory 24-hour advance manifest filing incentivizes documentation digitization and promotes early-stage customs pre-clearance, cutting dwell time at entry points.
Regulatory Landscape
South Africa's 3PL operating environment is being reshaped by government-led logistics reform and cross-modal economic regulation. The Economic Regulation of Transport Act, 2024 created a Transport Economic Regulator and a Transport Economic Council, extending formal economic oversight across road, rail, maritime, and aviation. It also reinforces the framework for tariff, access, and service-level governance relevant to outsourced logistics contracts.
Freight-market structure reform is anchored in the Freight Logistics Roadmap (2023), including measures such as vertical separation between infrastructure ownership and terminal operations to improve efficiency and enable broader participation. In July 2026, the Department of Transport confirmed approval of Train Operating Companies to access the national rail network, with operations scheduled to start in April 2027. This shift increases compliance requirements around network statements, operating rules, and performance obligations for rail-linked 3PL offerings. Cross-border road logistics continues to be governed through the Cross-Border Road Transport Agency under the Cross-Border Road Transport Act, which supports permitting and compliance for SADC corridor movements that many South African 3PLs manage end-to-end.
Value Chain Analysis
The South Africa 3PL value chain runs from shippers (e-commerce, FMCG, automotive, mining, and healthcare) through freight forwarders and customs brokers, to transport operators (road and air, with rail increasingly tied to reform). Contract logistics providers then deliver warehousing, distribution, and value-added services, while enabling layers such as telematics, WMS/TMS, security, and energy resilience solutions help manage service delivery. Demand concentrates along the Durban-Gauteng corridor and key industrial nodes around Gauteng and coastal ports, where 3PLs orchestrate inbound port and airport flows, cross-dock and storage, and outbound distribution to retail and export channels.
Operational performance is closely tied to port and corridor conditions, with congestion and inland rail reliability influencing modal choices and increasing the need for control-tower style exception management. Activity in 2026 shows how the chain is adapting. Transnova secured an expanded Tiger Brands logistics mandate managing a network moving about 2 million tonnes of finished goods annually, while SMSA Africa Logistics Group started capacity expansion in Benoni, Gauteng, including a 10,000 sqm high-rise warehouse and cross-dock extension. Public-private participation in ports and rail also increases the number of interfaces for 3PLs, particularly around slot booking, terminal operating windows, and intermodal handoffs as terminal operators, precinct developers, and infrastructure financiers take on more responsibilities.
Competitive Landscape
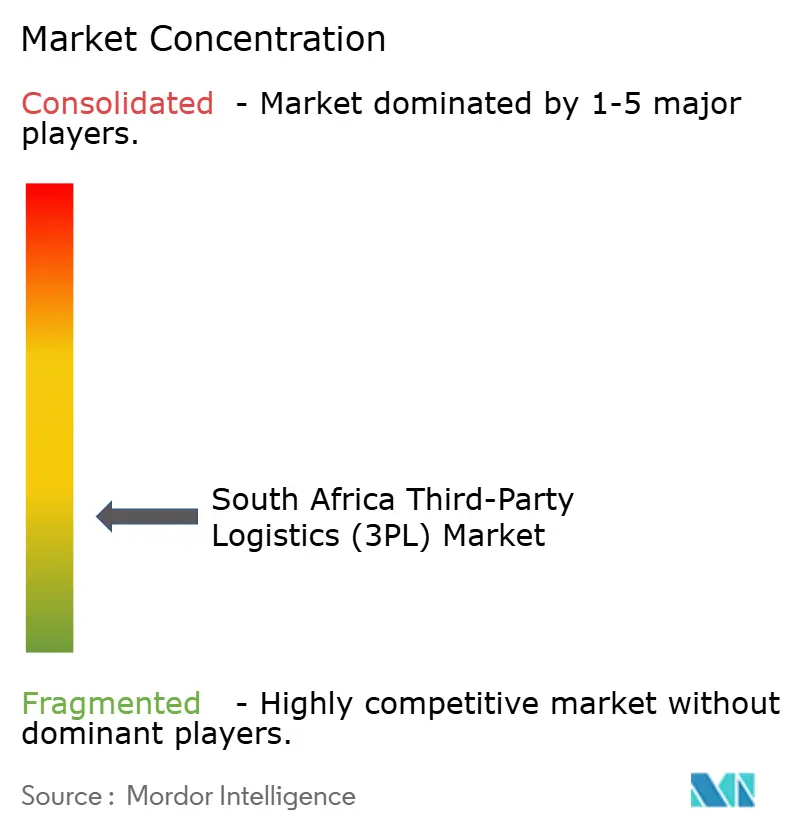
Market concentration is fragmented, with incumbent multinationals and large domestic groups holding material share while specialist entrants target high-growth niches. DP World’s USD 883 million acquisition of Imperial Logistics in March 2025 gave the port operator an integrated continental network and signaled intensifying competition from global players. Grindrod earmarked R8 billion for bulk-cargo, container, and rail expansions across South Africa and Mozambique, underlining the importance of corridor control for AfCFTA freight.
Five telematics providers—Cartrack, Tracker, MiX by Powerfleet, Ctrack, and Netstar—control 70% of installed fleet-management units, offering bundled routing, fuel management, and theft-recovery services. White-space remains in value-added warehousing for life-science cargo, digitally enabled cross-border brokerage, and green-fleet leasing. Operators that embed AI-driven demand planning and predictive analytics inside control-tower models are achieving cycle-time and cost advantages that widen competitive moats.
South Africa Third-Party Logistics (3PL) Industry Leaders
-
Bidvest International Logistics
-
Kuehne + Nagel
-
DSV
-
Barloworld Logistics
-
Onelogix
- *Disclaimer: Major Players sorted in no particular order
Market Opportunities and Future Outlook
Private-sector participation programs and long-dated concessions are creating more concrete whitespace for 3PLs to bundle port-adjacent handling, inland distribution, and compliance-led services into integrated contracts. In 2026, TNPA awarded 25-year concessions at Maydon Wharf in the Port of Durban, linked to over R1 billion of private investment for agricultural and perishable cargo handling. TNPA also finalized multiple terminal operator agreements at the Island View complex in Durban for fuel and chemical handlers. Together, these developments support opportunities in specialized warehousing (bonded, temperature-controlled, and dangerous goods), inventory postponement, and time-definite domestic distribution tied directly to port operating models.
Corridor decongestion and energy and industrial projects are also generating service niches around intermodal orchestration and reliability engineering. TNPA's 25-year agreement for Ukwanda LNG's onshore regasification facility at the Port of Ngqura (R22 billion project value) and Transnet's completion of a R4 billion investment at the Saldanha iron ore terminal highlight ongoing demand for project logistics, heavy-lift planning, and compliant hazardous and bulk cargo workflows. At the same time, Transnet's April 2026 application to reclaim 22.4 hectares for Durban container terminal expansion (targeting 1.8 million TEU per annum capacity) and the July 2026 tender to appoint a private partner for the Cape Town multipurpose terminal point to active port-capacity and operating-model change. This reinforces demand for 3PLs that can integrate terminal interfaces with inland control towers, strengthen cross-border documentation digitisation, and manage multimodal contingencies.
Recent Industry Developments
- February 2026: DSV completed a large-scale energy transition across three major distribution centres in Durban, Johannesburg, and Cape Town, implementing integrated solar photovoltaic and battery energy storage systems. The move improves operational continuity for contract logistics and cross-dock operations under grid instability constraints, and it supports customers that require measurable sustainability improvements in outsourced logistics.
- November 2025: Bidvest International Logistics launched a 40,000 m2 custom-built automotive container yard in Rosslyn, Gauteng, in partnership with BMW Group South Africa and Maersk. The dedicated facility increases container and vehicle-handling capability in an automotive hub and expands specialised 3PL offerings for export-linked and just-in-time supply chains.
- October 2024: DSV commissioned a centralized logistics facility in Durban (DSV Park | Durban), consolidating its Road, Air and Sea, and Solutions divisions. Consolidation improves end-to-end coordination from a major port gateway and supports integrated service contracts that combine forwarding, warehousing, and domestic distribution.
Research Methodology Framework and Report Scope
Market Definition and Coverage
This market covers third-party logistics (3PL) services delivered in South Africa, where a shipper outsources transport, warehousing, and related logistics execution to a specialized provider, and revenues are counted on a service fee basis.
Scope exclusions: We exclude in-house logistics run by shippers, pure consulting without execution, and standalone asset sales or leases that are not tied to 3PL service delivery.
Segmentation Overview
- By Service
- Domestic Transportation Management (DTM)
- Roadways
- Railways
- Airways
- Waterways
- International Transportation Management (ITM)
- Roadways
- Railways
- Airways
- Waterways
- Value-Added Warehousing & Distribution (VAWD)
- Domestic Transportation Management (DTM)
- By End User
- Automotive
- Energy & Utilities
- Manufacturing
- Life Sciences & Healthcare
- Technology & Electronics
- E-commerce
- Consumer Goods & FMCG
- Food & Beverages
- Others
- By Logistics Model
- Asset-Light (Management-Based)
- Asset-Heavy (Own Fleet & Warehouses)
- Hybrid
Data Sources, Market Sizing, and Validation
Desk Research
Desk research starts with public data that describes how much freight moves through South Africa and what cost pressures shape logistics pricing. We refer to sources such as Statistics South Africa for transport and trade context, the South African Reserve Bank for macro and currency signals, SARS customs and trade releases for import and export trends, and Transnet Port Terminals updates for throughput and capacity cues that influence outsourcing demand.
We also review industry-facing materials, such as annual reports and investor presentations of listed logistics groups, and association and regulator publications like the International Air Transport Association and the World Trade Organization for trade and air cargo indicators that help set realistic growth bounds. For cross-checking company revenues and corporate structure changes, we use a paid company financials and intelligence subscription, and we also use an import and export shipment-level database selectively for directional validation of corridor activity. The sources cited here are illustrative, and we used other public documents and datasets to collect, validate, and clarify inputs.
Primary Interviews and Surveys
Primary work was used to confirm what share of logistics spend is typically outsourced in South Africa and how pricing behaves across transport, warehousing, and value-added services. We spoke with 3PL operators, asset owners, freight forwarders, large shippers, and channel partners, and we checked views across the main trade and industrial nodes in the country. These conversations helped close data gaps on utilization, contract length, and pass-through of fuel and labor costs before we finalized the model.
Distribution of primary research fieldwork respondents
| Company type | Respondent position |
|---|---|
| Top tier: 35% | CXOs: 12% |
| Mid tier: 46% | Functional/Unit leaders: 34% |
| Smaller Players: 19% | Managers: 54% |
Market-Sizing & Forecasting
Sizing is built from a top-down demand pool that reconstructs outsourced logistics revenue from South Africa freight activity, warehousing needs, and service pricing behavior. We begin with macro and trade indicators, then apply outsourcing intensity and service mix assumptions that were stress-tested through interviews.
To keep totals realistic, the outputs are corroborated using selective bottom-up approximations, such as rolling up sample provider revenues, using corridor-level checks from shipment signals, and applying sampled average selling price ranges to estimated volumes of handled freight and storage space. When company disclosures are incomplete, we fill gaps through peer benchmarking by service focus and asset intensity (asset-light, asset-heavy, hybrid), then adjust to match known demand conditions.
For forecasting, we primarily use scenario analysis, since the market is sensitive to trade cycles, diesel and wage inflation, and infrastructure performance. Key inputs tracked in the model include merchandise trade growth, port and rail operating conditions (as a proxy for modal shifts), road freight activity trends, warehouse occupancy and new space additions, and FX movement that affects cost pass-through and reporting currency. Expert feedback was used to keep the forward path aligned with contract renewal behavior and the typical lag in price resets.
Data Validation & Update Cycle
Results are validated through step-by-step checks so the final number stays aligned with real market signals. We compare the modeled revenues against independent indicators, including trade directionality, logistics cost inflation signals, and disclosed revenue bands from relevant operators, and then investigate unusual jumps before sign-off.
A second analyst review is completed to test assumptions, math logic, and consistency across time series. If a large variance is found, respondents are re-contacted to confirm whether the change reflects a real shift (for example, a fuel surcharge reset or a modal disruption) or a modeling artifact. Reports are refreshed annually, with interim updates when material events occur, and a final pre-release pass is done so clients receive the latest updated view.
Mordor Intelligence's South Africa 3pl Market Size Versus Other Published Estimates
Published market sizes for South Africa 3PL can vary because each estimate draws a different line around what counts as outsourced logistics, and because pricing and currency handling are not always consistent across sources. Differences also show up when one publisher uses a shorter history, or when assumptions are not re-checked with operators after changes in fuel, labor, or infrastructure constraints.
Key gap drivers are usually scope and revenue recognition, where some estimates fold in broader freight and logistics spending or include adjacent activities that are not priced as 3PL service fees. Timing matters too, since the base year and exchange-rate window can move the USD value even if local activity is steady, and more aggressive scenarios can push the forecast path above what contract renewals typically support.
Benchmark comparison
| Source | Market Size | Gaps in Research Methodology |
|---|---|---|
| Mordor Intelligence | USD 5.42 B (2025) | |
| Industry Operator Briefing A | USD 6.39 B (2025) | Often presented as a broad 3PL figure that can bundle wider logistics outsourcing spend, and the pricing uplift can be applied more aggressively without separating transport-only from integrated 3PL fees. |
| Global Consultancy B | USD 8.03 B (2026) | Uses a different base year and can assume faster expansion of outsourced logistics penetration, with limited public clarity on exchange-rate timing and whether forwarding and contract logistics revenues are counted on a consistent net basis. |
The table shows a clear spread that mainly comes from what is counted as 3PL revenue and how the year and currency window are set, and in Mordor Intelligence's model the value reflects only outsourced 3PL service revenues in South Africa with checks against trade activity and provider disclosures before the final USD conversion. By keeping assumptions tied to observable demand signals and repeatable adjustments, the outcome is easier to track over time and simpler to explain on a planning call.
Key Questions Answered in the Report
What is the projected value of the South Africa third-party logistics market by 2031?
The market is forecast to reach USD 7.37 billion by 2031, expanding at a 5.25% CAGR.
Which service segment is growing fastest?
Value-Added Warehousing & Distribution is expected to post the highest growth at 7.29% CAGR to 2031.
How large is the e-commerce segment within logistics?
E-commerce accounted for 23.30% of market revenue in 2025, supported by more than 1 billion online transactions that year.
Why are hybrid logistics models gaining favor?
Hybrid models balance owned assets with flexible partner capacity, enabling 6.61% CAGR growth while preserving capital flexibility.