| Study Period | 2017 - 2030 |
| Base Year For Estimation | 2024 |
| Forecast Data Period | 2025 - 2030 |
| Market Size (2025) | USD 9.03 Billion |
| Market Size (2030) | USD 11.62 Billion |
| CAGR (2025 - 2030) | 5.19 % |
| Market Concentration | Low |
Major Players*Disclaimer: Major Players sorted in no particular order |

Sour Milk Drinks Market Analysis
The Sour Milk Drinks Market size is estimated at 9.03 billion USD in 2025, and is expected to reach 11.62 billion USD by 2030, growing at a CAGR of 5.19% during the forecast period (2025-2030).
The sour milk drinks industry is experiencing significant transformation driven by evolving consumer preferences and changing retail dynamics. Modern consumers are increasingly gravitating towards functional beverages that offer both nutritional benefits and traditional appeal. This shift is particularly evident in the retail sector, where supermarkets and hypermarkets have emerged as dominant distribution channels, accounting for 36.95% of volume sales in 2022. The industry has witnessed substantial product innovation, with manufacturers focusing on clean-label certifications, fermented milk beverages, probiotic dairy drinks enrichment, and diverse flavor profiles to meet consumer demands.
The retail landscape continues to evolve with the integration of multiple distribution channels and strategic partnerships. Major retailers are expanding their product offerings through both physical and digital platforms, creating an omnichannel experience for consumers. For instance, in September 2022, Graham's The Family Dairy strategically launched its new Goodness of Kefir product through Aldi stores, demonstrating the crucial role of established retail partnerships in product distribution. Traditional retail chains are also modernizing their approaches by implementing loyalty programs and digital integration to enhance customer engagement and retention.
Product innovation and premiumization have become key focus areas for manufacturers, driven by increasing consumer willingness to pay for innovative and health-focused products. In the United Kingdom, a significant 32% of consumers expressed willingness to pay premium prices for innovative sour milk drinks in 2022, highlighting the market's potential for value-added products. Manufacturers are responding by introducing new flavors, functional variants, and convenient packaging formats to cater to diverse consumer preferences and usage occasions, including cultured milk drinks and yogurt drinks.
The digital transformation of retail channels is reshaping the industry's distribution landscape, with online retail emerging as a rapidly growing channel. The shift towards e-commerce has been particularly pronounced in developed markets, with approximately 22% of Canadian consumers regularly planning online grocery purchases. This digital evolution has prompted traditional retailers to enhance their online presence and develop sophisticated e-commerce platforms, offering features such as subscription services, personalized recommendations, and convenient delivery options to meet changing consumer shopping preferences. The growth of fermented milk products in online sales further underscores the industry's digital shift.
Global Sour Milk Drinks Market Trends
The growing consumption of sour milk drinks is primarily driven by the associated health benefits, including their richness in vitamins, promotion of gut health, and alleviation of digestive issues.
- Kefir, laban, and buttermilk are considered sour milk drinks. Health benefits associated with these drinks promote the growing consumption of sour milk drinks worldwide. For example, these drinks are rich in water-soluble vitamins such as folate, riboflavin, and vitamin B12. They have good bacteria, which promote gut health. Consumption of these drinks also reduces the risk of diarrhea, constipation, and other digestive issues. The per capita consumption of sour milk drinks at the global level is expected to grow by 1.35% from 2023 to 2024.
- Kefir is more popular in the North American and European regions due to the increasing awareness regarding its health benefits as it carries various medicinal properties. The growing interest in prebiotics and gut health is further fueling the growth of the kefir market.
- Middle Eastern countries mainly consume laban, which is an essential part of the Arab diet. It is majorly produced in Lebanon and some Arab countries. With the growing consumption of laban, companies are differentiating their offerings in terms of flavor, ingredient, health benefit claims, and packaging format and size. Buttermilk is highly consumed in India and Middle Eastern countries like the United Arab Emirates and Saudi Arabia. It is also gaining popularity in American and European countries due to the growing ex-pat population, especially Indians. Approximately 370,000 Indian nationals were residing in the United Kingdom in 2021, compared to 346,000 in 2017.

Understand The Key Trends Shaping This Market
Download PDF
OTHER KEY INDUSTRY TRENDS COVERED IN THE REPORT
- Milk production has been increasing globally due to factors such as improved weather conditions, rising volume of milk per cow, and changing consumer dietary habits.
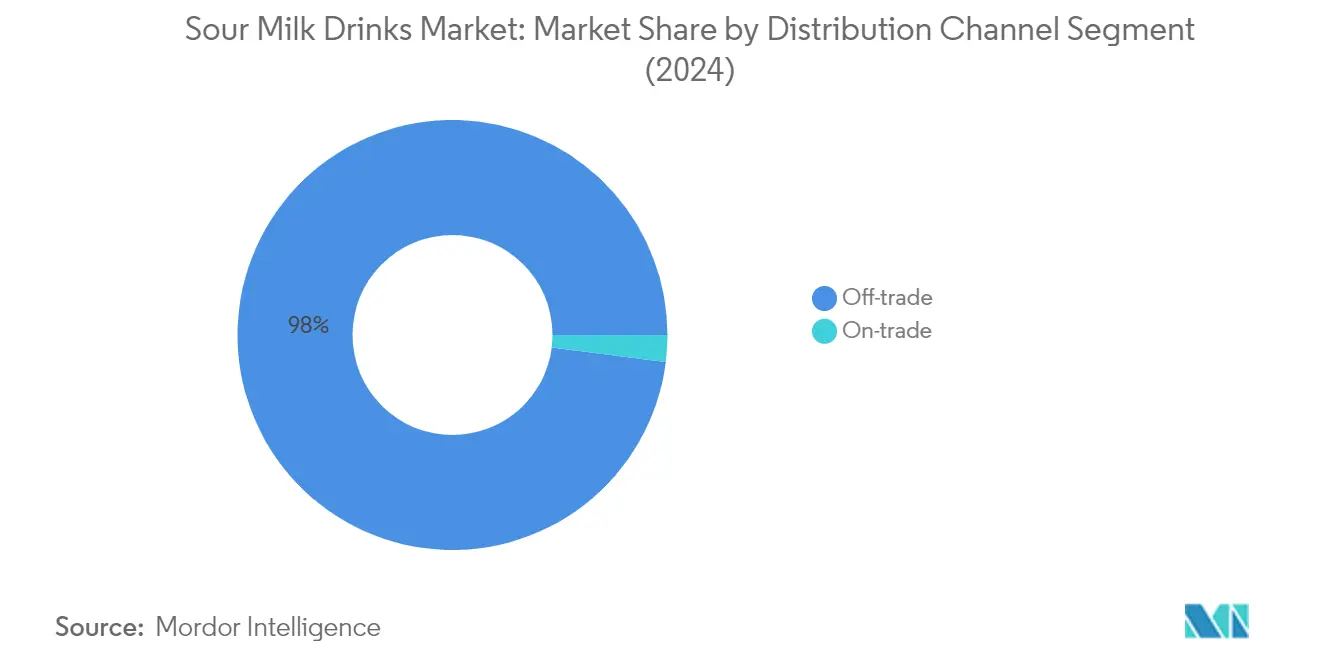
Segment Analysis: Distribution Channel
Off-trade Segment in Sour Milk Drinks Market
The off-trade distribution channel continues to dominate the global sour milk products market, commanding approximately 98% of the total market share in 2024. This overwhelming market dominance is attributed to the segment's ability to provide greater convenience and variety to consumers purchasing cultured dairy drinks. Supermarkets and hypermarkets are the primary sales channels within the off-trade segment, accounting for over 50% of value sales, offering widespread networks that allow easy access to consumers across different locations. Large supermarket chains, including Schwarz, Aldi, Carrefour, and Tesco, provide diverse options for sour milk drinks at various price points, ranging from USD 0.67 to USD 2.65. The segment's growth is further propelled by retailers' focus on providing comprehensive product information, including ingredients and allergen details, while also offering promotional discounts and loyalty benefits to retain customers. The off-trade segment is projected to maintain its market leadership position while growing at approximately 6% during 2024-2029, driven by the increasing adoption of online retail channels and the expansion of modern retail formats.
On-trade Segment in Sour Milk Drinks Market
The on-trade segment represents a smaller but significant channel in the sour milk drinks market, particularly in regions where eating out is a popular cultural practice. This segment serves fermented milk beverages through restaurants, cafes, food service establishments, and other hospitality venues, offering unique flavors and combinations that cater to diverse consumer preferences. The channel's growth is supported by the increasing trend of consuming food away from home, with restaurants incorporating sour milk drinks into their menus as both beverages and ingredients in various dishes. The segment's development is also driven by the growing recognition of sour milk's health benefits, including its probiotic properties and digestive health advantages, which has led to its increased inclusion in food service menus and institutional catering services. Additionally, the rising popularity of dairy kefir as a health-conscious choice further enhances the appeal of sour milk drinks in this segment.
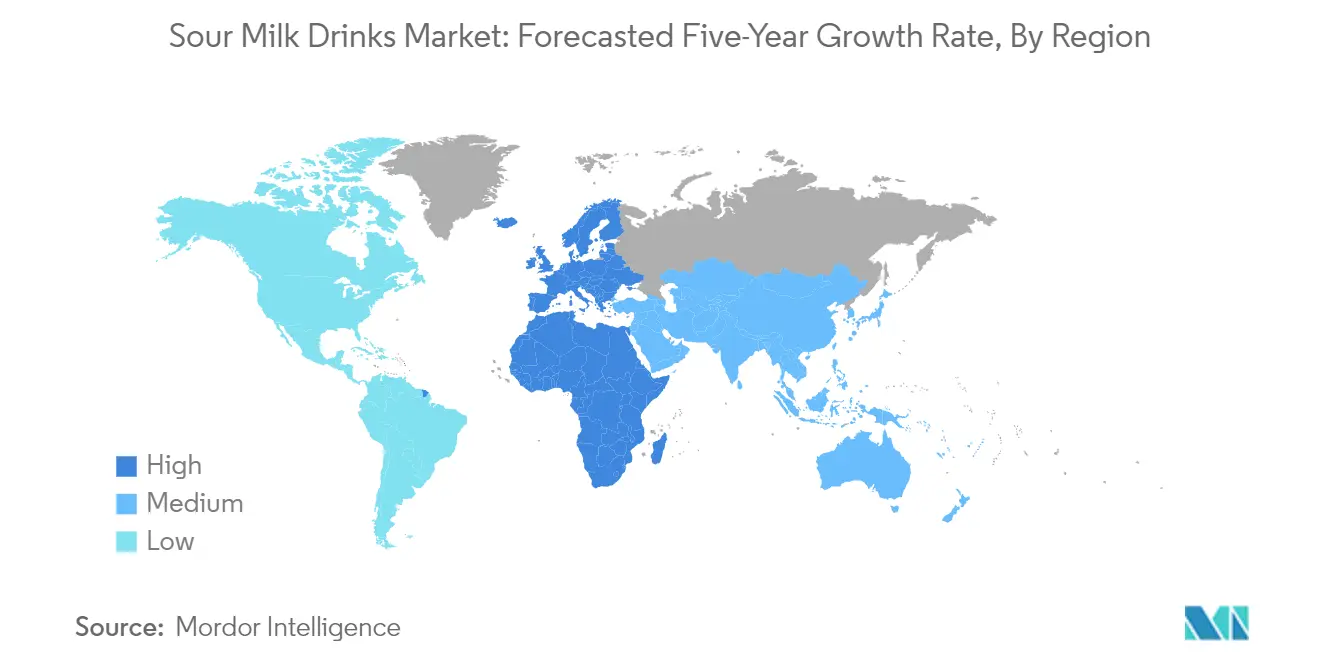
Sour Milk Drinks Market Geography Segment Analysis
Sour Milk Drinks Market in Africa
The African sour milk drinks market demonstrates a strong cultural connection to fermented dairy products, with varying consumption patterns across different regions. Egypt, South Africa, and other African nations showcase distinct preferences in sour milk consumption, with products being integrated into traditional cuisines and daily dietary habits. The market is characterized by increasing health consciousness among consumers and growing awareness of the digestive benefits associated with fermented dairy products. Distribution channels in Africa are predominantly off-trade, with specialty stores and modern retail formats playing crucial roles in product accessibility. The fermented milk products market in Africa is poised for growth, driven by these cultural and health trends.
Sour Milk Drinks Market in South Africa
South Africa emerges as the dominant force in the African sour milk drinks market, with traditional products like Amasi or Mass deeply embedded in local food culture. The country's market position is strengthened by approximately 42% market share in 2024. The robust market presence is supported by favorable government regulations through the South African Department of Health (DOH), which provides comprehensive recommendations on manufacturing, storage, packaging, and distribution processes. The country's supermarket and hypermarket chains, including Shoprite, Woolworths, Pick n Pay, and Walmart, have established extensive distribution networks that facilitate widespread product availability and consumer access. Additionally, the growing popularity of ayran and lassi contributes to the diversity of offerings in the market.
Sour Milk Drinks Market in Egypt
Egypt represents the fastest-growing market in the African region, with an expected growth rate of approximately 6% during 2024-2029. The market's expansion is driven by deep-rooted cultural traditions and increasing consumer awareness of health benefits. Egyptian consumers utilize sour milk in various ways, from direct consumption to incorporation in traditional cuisines like Feteer and Molokhia. The market is supported by both international and local brands, including Juhayna Zabady, Beyti, Arab Dairy, Elmarai Zabady, and Alfa Zabaday, offering diverse product options to meet consumer preferences. The introduction of drinkable yogurt products is also gaining traction among health-conscious consumers.
Get Analysis on Important Geographic Markets
Download PDF
Sour Milk Drinks Industry Overview
Top Companies in Sour Milk Drinks Market
The leading companies in the sour milk drinks market are focusing on continuous product innovation and development to maintain their competitive edge. Companies are investing heavily in research and development activities, establishing partnerships with research institutes and technology providers to create innovative formulations and flavors. Operational agility is demonstrated through the establishment of efficient distribution networks and manufacturing facilities across multiple regions. Strategic moves include expanding production capacities, particularly in emerging markets, and strengthening presence through retail partnerships. Companies are also emphasizing sustainability initiatives, including environmentally friendly packaging solutions and responsible sourcing practices. Geographic expansion remains a key focus, with firms establishing new facilities and distribution networks in untapped markets while strengthening their presence in existing ones. The sour milk brands are also leveraging their market position to introduce new cultured milk products to cater to health-conscious consumers.
Market Structure Shows Regional Leadership Patterns
The sour milk drinks market exhibits a mix of global conglomerates and regional specialists, with different players dominating various geographical segments. Global dairy giants maintain strong positions through their established brands and extensive distribution networks, while regional players leverage their local market knowledge and cultural understanding to maintain significant market shares in their respective territories. The market structure varies by region, with some areas showing high consolidation among a few major players, while others remain fragmented with numerous local manufacturers competing for market share.
The market is characterized by ongoing consolidation through mergers and acquisitions, as larger companies seek to expand their geographical presence and product portfolios. Companies are actively pursuing strategic partnerships and joint ventures to strengthen their market position and access new distribution channels. Local players with strong regional presence are becoming attractive acquisition targets for global companies looking to expand their footprint in specific markets. The industry also sees vertical integration strategies, with companies investing in their supply chain capabilities and raw material sourcing to ensure better control over product quality and costs. The fermented milk products industry is witnessing similar trends, with a focus on expanding product lines and enhancing distribution networks.
Innovation and Distribution Drive Future Success
For incumbent companies to maintain and increase their market share, focus needs to be placed on continuous product innovation, particularly in developing health-focused formulations and new flavor profiles that appeal to changing consumer preferences. Establishing strong relationships with retailers and investing in efficient distribution networks will be crucial for maintaining market dominance. Companies must also invest in digital transformation and e-commerce capabilities to adapt to evolving purchasing patterns and maintain competitive advantage. Building sustainable and transparent supply chains while maintaining product quality and safety standards will be essential for long-term success.
Contenders looking to gain ground in the market should focus on identifying and serving niche market segments with specialized products and formulations. Developing strong regional presence before expanding to broader markets, and establishing partnerships with local distributors and retailers will be crucial for success. Companies must also consider potential regulatory changes, particularly regarding health claims and labeling requirements, and adapt their strategies accordingly. Investment in research and development capabilities, along with building strong brand identity and consumer trust through transparent practices and quality assurance, will be essential for gaining market share. The ability to quickly adapt to changing consumer preferences and maintain competitive pricing while ensuring product quality will be critical for success. Additionally, the rise of fermented beverage options presents new opportunities for companies to diversify their offerings and capture emerging consumer trends.
Sour Milk Drinks Market Leaders
-
Almarai Company
-
Dairy Farmers of America Inc.
-
Gujarat Co-operative Milk Marketing Federation Ltd
-
Lifeway Foods Inc.
-
Nestlé SA
- *Disclaimer: Major Players sorted in no particular order

Need More Details on Market Players and Competiters?
Download PDF
Sour Milk Drinks Market News
- July 2022: Gujarat Co-operative Milk Marketing Federation Ltd. announced an investment of USD 60 Million for a new dairy plant in Rajkot to expand the milk, curd, and buttermilk products segment.
- August 2021: Lifeway Foods Inc., a manufacturer of kefir and fermented probiotic products, expanded its kefir distribution in the Irish market with a listing at Tesco.
- July 2021: Lifeway Foods Inc. expanded its distribution of kefir into the French market through the retailer Costco France.
Free With This Report
We provide a comprehensive and exhaustive set of data pointers for global, regional, and country-level metrics that illustrate the fundamentals of the dairy industry. With the help of 45+ free charts, clients can access in-depth market analysis based on per capita consumption numbers and production data of raw materials for dairy, through granular-level segmental information supported by a repository of market data, trends, and expert analysis. Data and analysis on dairy, categories of dairy products, product types, etc., are available in the form of comprehensive reports as well as excel based data worksheets.


Sour Milk Drinks Market Report - Table of Contents
1. EXECUTIVE SUMMARY & KEY FINDINGS
2. REPORT OFFERS
3. INTRODUCTION
- 3.1 Study Assumptions & Market Definition
- 3.2 Scope of the Study
- 3.3 Research Methodology
4. KEY INDUSTRY TRENDS
- 4.1 Per Capita Consumption
-
4.2 Raw Material/commodity Production
- 4.2.1 Milk
-
4.3 Regulatory Framework
- 4.3.1 Russia
- 4.3.2 Saudi Arabia
- 4.3.3 South Africa
- 4.3.4 United States
- 4.4 Value Chain & Distribution Channel Analysis
5. MARKET SEGMENTATION (includes market size in Value in USD and Volume, Forecasts up to 2030 and analysis of growth prospects)
-
5.1 Distribution Channel
- 5.1.1 Off-Trade
- 5.1.1.1 Convenience Stores
- 5.1.1.2 Online Retail
- 5.1.1.3 Specialist Retailers
- 5.1.1.4 Supermarkets and Hypermarkets
- 5.1.1.5 Others (Warehouse clubs, gas stations, etc.)
- 5.1.2 On-Trade
-
5.2 Region
- 5.2.1 Africa
- 5.2.1.1 By Distribution Channel
- 5.2.1.2 Egypt
- 5.2.1.3 South Africa
- 5.2.1.4 Rest of Africa
- 5.2.2 Asia-Pacific
- 5.2.2.1 By Distribution Channel
- 5.2.2.2 Australia
- 5.2.2.3 India
- 5.2.2.4 Indonesia
- 5.2.2.5 Pakistan
- 5.2.2.6 South Korea
- 5.2.3 Europe
- 5.2.3.1 By Distribution Channel
- 5.2.3.2 Belgium
- 5.2.3.3 France
- 5.2.3.4 Germany
- 5.2.3.5 Italy
- 5.2.3.6 Netherlands
- 5.2.3.7 Russia
- 5.2.3.8 Spain
- 5.2.3.9 Turkey
- 5.2.3.10 United Kingdom
- 5.2.3.11 Rest of Europe
- 5.2.4 Middle East
- 5.2.4.1 By Distribution Channel
- 5.2.4.2 Bahrain
- 5.2.4.3 Iran
- 5.2.4.4 Kuwait
- 5.2.4.5 Oman
- 5.2.4.6 Qatar
- 5.2.4.7 Saudi Arabia
- 5.2.4.8 United Arab Emirates
- 5.2.4.9 Rest of Middle East
- 5.2.5 North America
- 5.2.5.1 By Distribution Channel
- 5.2.5.2 Canada
- 5.2.5.3 Mexico
- 5.2.5.4 United States
- 5.2.6 South America
- 5.2.6.1 By Distribution Channel
- 5.2.6.2 Rest of South America
6. COMPETITIVE LANDSCAPE
- 6.1 Key Strategic Moves
- 6.2 Market Share Analysis
- 6.3 Company Landscape
-
6.4 Company Profiles (includes Global Level Overview, Market Level Overview, Core Business Segments, Financials, Headcount, Key Information, Market Rank, Market Share, Products and Services, and Analysis of Recent Developments).
- 6.4.1 Almarai Company
- 6.4.2 Dairy Farmers of America Inc.
- 6.4.3 Green Valley Farms Market and Creamery
- 6.4.4 Gujarat Co-operative Milk Marketing Federation Ltd
- 6.4.5 Hiland Dairy Foods Company LLC
- 6.4.6 Lifeway Foods Inc.
- 6.4.7 Nestlé SA
- 6.4.8 Producers Dairy Foods Inc. (Umpqua Dairy)
7. KEY STRATEGIC QUESTIONS FOR DAIRY AND DAIRY ALTERNATIVE CEOS
8. APPENDIX
-
8.1 Global Overview
- 8.1.1 Overview
- 8.1.2 Porter’s Five Forces Framework
- 8.1.3 Global Value Chain Analysis
- 8.1.4 Market Dynamics (DROs)
- 8.2 Sources & References
- 8.3 List of Tables & Figures
- 8.4 Primary Insights
- 8.5 Data Pack
- 8.6 Glossary of Terms
You Can Purchase Parts Of This Report. Check Out Prices For Specific Sections
Get Price Break-up Now
List of Tables & Figures
- Figure 1:
- PER CAPITA CONSUMPTION OF SOUR MILK DRINKS, KG, GLOBAL, 2017 - 2029
- Figure 2:
- PRODUCTION OF MILK, METRIC TONNES, GLOBAL, 2017 - 2021
- Figure 3:
- VOLUME OF SOUR MILK DRINKS, METRIC TONNES, BY GLOBAL, 2017 - 2029
- Figure 4:
- VALUE OF SOUR MILK DRINKS, USD MN, BY GLOBAL, 2017 - 2029
- Figure 5:
- VOLUME OF SOUR MILK DRINKS MARKET BY DISTRIBUTION CHANNEL, METRIC TONNES, GLOBAL, 2017 - 2029
- Figure 6:
- VALUE OF SOUR MILK DRINKS MARKET BY DISTRIBUTION CHANNEL, USD MN, GLOBAL, 2017 - 2029
- Figure 7:
- VOLUME SHARE OF SOUR MILK DRINKS MARKET, BY DISTRIBUTION CHANNEL , %, GLOBAL, 2017 VS 2023 VS 2029
- Figure 8:
- VALUE SHARE OF SOUR MILK DRINKS MARKET, BY DISTRIBUTION CHANNEL , %, GLOBAL, 2017 VS 2023 VS 2029
- Figure 9:
- VOLUME OF SOUR MILK DRINKS MARKET BY SUB DISTRIBUTION CHANNELS, METRIC TONNES, GLOBAL, 2017 - 2029
- Figure 10:
- VALUE OF SOUR MILK DRINKS MARKET BY SUB DISTRIBUTION CHANNELS, USD MN, GLOBAL, 2017 - 2029
- Figure 11:
- VOLUME SHARE OF SOUR MILK DRINKS MARKET, BY SUB DISTRIBUTION CHANNELS , %, GLOBAL, 2017 VS 2023 VS 2029
- Figure 12:
- VALUE SHARE OF SOUR MILK DRINKS MARKET, BY SUB DISTRIBUTION CHANNELS , %, GLOBAL, 2017 VS 2023 VS 2029
- Figure 13:
- VOLUME OF SOUR MILK DRINKS MARKET SOLD VIA CONVENIENCE STORES, METRIC TONNES, GLOBAL, 2017 - 2029
- Figure 14:
- VALUE OF SOUR MILK DRINKS MARKET SOLD VIA CONVENIENCE STORES, USD MN, GLOBAL, 2017 - 2029
- Figure 15:
- VOLUME OF SOUR MILK DRINKS MARKET SOLD VIA ONLINE RETAIL, METRIC TONNES, GLOBAL, 2017 - 2029
- Figure 16:
- VALUE OF SOUR MILK DRINKS MARKET SOLD VIA ONLINE RETAIL, USD MN, GLOBAL, 2017 - 2029
- Figure 17:
- VOLUME OF SOUR MILK DRINKS MARKET SOLD VIA SPECIALIST RETAILERS, METRIC TONNES, GLOBAL, 2017 - 2029
- Figure 18:
- VALUE OF SOUR MILK DRINKS MARKET SOLD VIA SPECIALIST RETAILERS, USD MN, GLOBAL, 2017 - 2029
- Figure 19:
- VOLUME OF SOUR MILK DRINKS MARKET SOLD VIA SUPERMARKETS AND HYPERMARKETS, METRIC TONNES, GLOBAL, 2017 - 2029
- Figure 20:
- VALUE OF SOUR MILK DRINKS MARKET SOLD VIA SUPERMARKETS AND HYPERMARKETS, USD MN, GLOBAL, 2017 - 2029
- Figure 21:
- VOLUME OF SOUR MILK DRINKS MARKET SOLD VIA OTHERS (WAREHOUSE CLUBS, GAS STATIONS, ETC.), METRIC TONNES, GLOBAL, 2017 - 2029
- Figure 22:
- VALUE OF SOUR MILK DRINKS MARKET SOLD VIA OTHERS (WAREHOUSE CLUBS, GAS STATIONS, ETC.), USD MN, GLOBAL, 2017 - 2029
- Figure 23:
- VOLUME OF SOUR MILK DRINKS MARKET SOLD VIA ON-TRADE, METRIC TONNES, GLOBAL, 2017 - 2029
- Figure 24:
- VALUE OF SOUR MILK DRINKS MARKET SOLD VIA ON-TRADE, USD MN, GLOBAL, 2017 - 2029
- Figure 25:
- VOLUME OF SOUR MILK DRINKS MARKET BY REGION, METRIC TONNES, GLOBAL, 2017 - 2029
- Figure 26:
- VALUE OF SOUR MILK DRINKS MARKET BY REGION, USD MN, GLOBAL, 2017 - 2029
- Figure 27:
- VOLUME SHARE OF SOUR MILK DRINKS MARKET, BY REGION , %, GLOBAL, 2017 VS 2023 VS 2029
- Figure 28:
- VALUE SHARE OF SOUR MILK DRINKS MARKET, BY REGION , %, GLOBAL, 2017 VS 2023 VS 2029
- Figure 29:
- VOLUME OF SOUR MILK DRINKS MARKET BY DISTRIBUTION CHANNEL, METRIC TONNES, AFRICA, 2017 - 2029
- Figure 30:
- VALUE OF SOUR MILK DRINKS MARKET BY DISTRIBUTION CHANNEL, USD MN, AFRICA, 2017 - 2029
- Figure 31:
- VOLUME SHARE OF SOUR MILK DRINKS MARKET, BY DISTRIBUTION CHANNEL , %, AFRICA, 2017 VS 2023 VS 2029
- Figure 32:
- VALUE SHARE OF SOUR MILK DRINKS MARKET, BY DISTRIBUTION CHANNEL , %, AFRICA, 2017 VS 2023 VS 2029
- Figure 33:
- VOLUME OF SOUR MILK DRINKS MARKET BY COUNTRY, METRIC TONNES, AFRICA, 2017 - 2029
- Figure 34:
- VALUE OF SOUR MILK DRINKS MARKET BY COUNTRY, USD MN, AFRICA, 2017 - 2029
- Figure 35:
- VOLUME SHARE OF SOUR MILK DRINKS MARKET, BY COUNTRY , %, AFRICA, 2017 VS 2023 VS 2029
- Figure 36:
- VALUE SHARE OF SOUR MILK DRINKS MARKET, BY COUNTRY , %, AFRICA, 2017 VS 2023 VS 2029
- Figure 37:
- VOLUME OF SOUR MILK DRINKS MARKET, METRIC TONNES, EGYPT, 2017 - 2029
- Figure 38:
- VALUE OF SOUR MILK DRINKS MARKET, USD MN, EGYPT, 2017 - 2029
- Figure 39:
- VOLUME OF SOUR MILK DRINKS MARKET, METRIC TONNES, SOUTH AFRICA, 2017 - 2029
- Figure 40:
- VALUE OF SOUR MILK DRINKS MARKET, USD MN, SOUTH AFRICA, 2017 - 2029
- Figure 41:
- VOLUME OF SOUR MILK DRINKS MARKET, METRIC TONNES, REST OF AFRICA, 2017 - 2029
- Figure 42:
- VALUE OF SOUR MILK DRINKS MARKET, USD MN, REST OF AFRICA, 2017 - 2029
- Figure 43:
- VOLUME OF SOUR MILK DRINKS MARKET BY DISTRIBUTION CHANNEL, METRIC TONNES, ASIA-PACIFIC, 2017 - 2029
- Figure 44:
- VALUE OF SOUR MILK DRINKS MARKET BY DISTRIBUTION CHANNEL, USD MN, ASIA-PACIFIC, 2017 - 2029
- Figure 45:
- VOLUME SHARE OF SOUR MILK DRINKS MARKET, BY DISTRIBUTION CHANNEL , %, ASIA-PACIFIC, 2017 VS 2023 VS 2029
- Figure 46:
- VALUE SHARE OF SOUR MILK DRINKS MARKET, BY DISTRIBUTION CHANNEL , %, ASIA-PACIFIC, 2017 VS 2023 VS 2029
- Figure 47:
- VOLUME OF SOUR MILK DRINKS MARKET BY COUNTRY, METRIC TONNES, ASIA-PACIFIC, 2017 - 2029
- Figure 48:
- VALUE OF SOUR MILK DRINKS MARKET BY COUNTRY, USD MN, ASIA-PACIFIC, 2017 - 2029
- Figure 49:
- VOLUME SHARE OF SOUR MILK DRINKS MARKET, BY COUNTRY , %, ASIA-PACIFIC, 2017 VS 2023 VS 2029
- Figure 50:
- VALUE SHARE OF SOUR MILK DRINKS MARKET, BY COUNTRY , %, ASIA-PACIFIC, 2017 VS 2023 VS 2029
- Figure 51:
- VOLUME OF SOUR MILK DRINKS MARKET, METRIC TONNES, AUSTRALIA, 2017 - 2029
- Figure 52:
- VALUE OF SOUR MILK DRINKS MARKET, USD MN, AUSTRALIA, 2017 - 2029
- Figure 53:
- VOLUME OF SOUR MILK DRINKS MARKET, METRIC TONNES, INDIA, 2017 - 2029
- Figure 54:
- VALUE OF SOUR MILK DRINKS MARKET, USD MN, INDIA, 2017 - 2029
- Figure 55:
- VOLUME OF SOUR MILK DRINKS MARKET, METRIC TONNES, INDONESIA, 2017 - 2029
- Figure 56:
- VALUE OF SOUR MILK DRINKS MARKET, USD MN, INDONESIA, 2017 - 2029
- Figure 57:
- VOLUME OF SOUR MILK DRINKS MARKET, METRIC TONNES, PAKISTAN, 2017 - 2029
- Figure 58:
- VALUE OF SOUR MILK DRINKS MARKET, USD MN, PAKISTAN, 2017 - 2029
- Figure 59:
- VOLUME OF SOUR MILK DRINKS MARKET, METRIC TONNES, SOUTH KOREA, 2017 - 2029
- Figure 60:
- VALUE OF SOUR MILK DRINKS MARKET, USD MN, SOUTH KOREA, 2017 - 2029
- Figure 61:
- VOLUME OF SOUR MILK DRINKS MARKET BY DISTRIBUTION CHANNEL, METRIC TONNES, EUROPE, 2017 - 2029
- Figure 62:
- VALUE OF SOUR MILK DRINKS MARKET BY DISTRIBUTION CHANNEL, USD MN, EUROPE, 2017 - 2029
- Figure 63:
- VOLUME SHARE OF SOUR MILK DRINKS MARKET, BY DISTRIBUTION CHANNEL , %, EUROPE, 2017 VS 2023 VS 2029
- Figure 64:
- VALUE SHARE OF SOUR MILK DRINKS MARKET, BY DISTRIBUTION CHANNEL , %, EUROPE, 2017 VS 2023 VS 2029
- Figure 65:
- VOLUME OF SOUR MILK DRINKS MARKET BY COUNTRY, METRIC TONNES, EUROPE, 2017 - 2029
- Figure 66:
- VALUE OF SOUR MILK DRINKS MARKET BY COUNTRY, USD MN, EUROPE, 2017 - 2029
- Figure 67:
- VOLUME SHARE OF SOUR MILK DRINKS MARKET, BY COUNTRY , %, EUROPE, 2017 VS 2023 VS 2029
- Figure 68:
- VALUE SHARE OF SOUR MILK DRINKS MARKET, BY COUNTRY , %, EUROPE, 2017 VS 2023 VS 2029
- Figure 69:
- VOLUME OF SOUR MILK DRINKS MARKET, METRIC TONNES, BELGIUM, 2017 - 2029
- Figure 70:
- VALUE OF SOUR MILK DRINKS MARKET, USD MN, BELGIUM, 2017 - 2029
- Figure 71:
- VOLUME OF SOUR MILK DRINKS MARKET, METRIC TONNES, FRANCE, 2017 - 2029
- Figure 72:
- VALUE OF SOUR MILK DRINKS MARKET, USD MN, FRANCE, 2017 - 2029
- Figure 73:
- VOLUME OF SOUR MILK DRINKS MARKET, METRIC TONNES, GERMANY, 2017 - 2029
- Figure 74:
- VALUE OF SOUR MILK DRINKS MARKET, USD MN, GERMANY, 2017 - 2029
- Figure 75:
- VOLUME OF SOUR MILK DRINKS MARKET, METRIC TONNES, ITALY, 2017 - 2029
- Figure 76:
- VALUE OF SOUR MILK DRINKS MARKET, USD MN, ITALY, 2017 - 2029
- Figure 77:
- VOLUME OF SOUR MILK DRINKS MARKET, METRIC TONNES, NETHERLANDS, 2017 - 2029
- Figure 78:
- VALUE OF SOUR MILK DRINKS MARKET, USD MN, NETHERLANDS, 2017 - 2029
- Figure 79:
- VOLUME OF SOUR MILK DRINKS MARKET, METRIC TONNES, RUSSIA, 2017 - 2029
- Figure 80:
- VALUE OF SOUR MILK DRINKS MARKET, USD MN, RUSSIA, 2017 - 2029
- Figure 81:
- VOLUME OF SOUR MILK DRINKS MARKET, METRIC TONNES, SPAIN, 2017 - 2029
- Figure 82:
- VALUE OF SOUR MILK DRINKS MARKET, USD MN, SPAIN, 2017 - 2029
- Figure 83:
- VOLUME OF SOUR MILK DRINKS MARKET, METRIC TONNES, TURKEY, 2017 - 2029
- Figure 84:
- VALUE OF SOUR MILK DRINKS MARKET, USD MN, TURKEY, 2017 - 2029
- Figure 85:
- VOLUME OF SOUR MILK DRINKS MARKET, METRIC TONNES, UNITED KINGDOM, 2017 - 2029
- Figure 86:
- VALUE OF SOUR MILK DRINKS MARKET, USD MN, UNITED KINGDOM, 2017 - 2029
- Figure 87:
- VOLUME OF SOUR MILK DRINKS MARKET, METRIC TONNES, REST OF EUROPE, 2017 - 2029
- Figure 88:
- VALUE OF SOUR MILK DRINKS MARKET, USD MN, REST OF EUROPE, 2017 - 2029
- Figure 89:
- VOLUME OF SOUR MILK DRINKS MARKET BY DISTRIBUTION CHANNEL, METRIC TONNES, MIDDLE EAST, 2017 - 2029
- Figure 90:
- VALUE OF SOUR MILK DRINKS MARKET BY DISTRIBUTION CHANNEL, USD MN, MIDDLE EAST, 2017 - 2029
- Figure 91:
- VOLUME SHARE OF SOUR MILK DRINKS MARKET, BY DISTRIBUTION CHANNEL , %, MIDDLE EAST, 2017 VS 2023 VS 2029
- Figure 92:
- VALUE SHARE OF SOUR MILK DRINKS MARKET, BY DISTRIBUTION CHANNEL , %, MIDDLE EAST, 2017 VS 2023 VS 2029
- Figure 93:
- VOLUME OF SOUR MILK DRINKS MARKET BY COUNTRY, METRIC TONNES, MIDDLE EAST, 2017 - 2029
- Figure 94:
- VALUE OF SOUR MILK DRINKS MARKET BY COUNTRY, USD MN, MIDDLE EAST, 2017 - 2029
- Figure 95:
- VOLUME SHARE OF SOUR MILK DRINKS MARKET, BY COUNTRY , %, MIDDLE EAST, 2017 VS 2023 VS 2029
- Figure 96:
- VALUE SHARE OF SOUR MILK DRINKS MARKET, BY COUNTRY , %, MIDDLE EAST, 2017 VS 2023 VS 2029
- Figure 97:
- VOLUME OF SOUR MILK DRINKS MARKET, METRIC TONNES, BAHRAIN, 2017 - 2029
- Figure 98:
- VALUE OF SOUR MILK DRINKS MARKET, USD MN, BAHRAIN, 2017 - 2029
- Figure 99:
- VOLUME OF SOUR MILK DRINKS MARKET, METRIC TONNES, IRAN, 2017 - 2029
- Figure 100:
- VALUE OF SOUR MILK DRINKS MARKET, USD MN, IRAN, 2017 - 2029
- Figure 101:
- VOLUME OF SOUR MILK DRINKS MARKET, METRIC TONNES, KUWAIT, 2017 - 2029
- Figure 102:
- VALUE OF SOUR MILK DRINKS MARKET, USD MN, KUWAIT, 2017 - 2029
- Figure 103:
- VOLUME OF SOUR MILK DRINKS MARKET, METRIC TONNES, OMAN, 2017 - 2029
- Figure 104:
- VALUE OF SOUR MILK DRINKS MARKET, USD MN, OMAN, 2017 - 2029
- Figure 105:
- VOLUME OF SOUR MILK DRINKS MARKET, METRIC TONNES, QATAR, 2017 - 2029
- Figure 106:
- VALUE OF SOUR MILK DRINKS MARKET, USD MN, QATAR, 2017 - 2029
- Figure 107:
- VOLUME OF SOUR MILK DRINKS MARKET, METRIC TONNES, SAUDI ARABIA, 2017 - 2029
- Figure 108:
- VALUE OF SOUR MILK DRINKS MARKET, USD MN, SAUDI ARABIA, 2017 - 2029
- Figure 109:
- VOLUME OF SOUR MILK DRINKS MARKET, METRIC TONNES, UNITED ARAB EMIRATES, 2017 - 2029
- Figure 110:
- VALUE OF SOUR MILK DRINKS MARKET, USD MN, UNITED ARAB EMIRATES, 2017 - 2029
- Figure 111:
- VOLUME OF SOUR MILK DRINKS MARKET, METRIC TONNES, REST OF MIDDLE EAST, 2017 - 2029
- Figure 112:
- VALUE OF SOUR MILK DRINKS MARKET, USD MN, REST OF MIDDLE EAST, 2017 - 2029
- Figure 113:
- VOLUME OF SOUR MILK DRINKS MARKET BY DISTRIBUTION CHANNEL, METRIC TONNES, NORTH AMERICA, 2017 - 2029
- Figure 114:
- VALUE OF SOUR MILK DRINKS MARKET BY DISTRIBUTION CHANNEL, USD MN, NORTH AMERICA, 2017 - 2029
- Figure 115:
- VOLUME SHARE OF SOUR MILK DRINKS MARKET, BY DISTRIBUTION CHANNEL , %, NORTH AMERICA, 2017 VS 2023 VS 2029
- Figure 116:
- VALUE SHARE OF SOUR MILK DRINKS MARKET, BY DISTRIBUTION CHANNEL , %, NORTH AMERICA, 2017 VS 2023 VS 2029
- Figure 117:
- VOLUME OF SOUR MILK DRINKS MARKET BY COUNTRY, METRIC TONNES, NORTH AMERICA, 2017 - 2029
- Figure 118:
- VALUE OF SOUR MILK DRINKS MARKET BY COUNTRY, USD MN, NORTH AMERICA, 2017 - 2029
- Figure 119:
- VOLUME SHARE OF SOUR MILK DRINKS MARKET, BY COUNTRY , %, NORTH AMERICA, 2017 VS 2023 VS 2029
- Figure 120:
- VALUE SHARE OF SOUR MILK DRINKS MARKET, BY COUNTRY , %, NORTH AMERICA, 2017 VS 2023 VS 2029
- Figure 121:
- VOLUME OF SOUR MILK DRINKS MARKET, METRIC TONNES, CANADA, 2017 - 2029
- Figure 122:
- VALUE OF SOUR MILK DRINKS MARKET, USD MN, CANADA, 2017 - 2029
- Figure 123:
- VOLUME OF SOUR MILK DRINKS MARKET, METRIC TONNES, MEXICO, 2017 - 2029
- Figure 124:
- VALUE OF SOUR MILK DRINKS MARKET, USD MN, MEXICO, 2017 - 2029
- Figure 125:
- VOLUME OF SOUR MILK DRINKS MARKET, METRIC TONNES, UNITED STATES, 2017 - 2029
- Figure 126:
- VALUE OF SOUR MILK DRINKS MARKET, USD MN, UNITED STATES, 2017 - 2029
- Figure 127:
- VOLUME OF SOUR MILK DRINKS MARKET BY DISTRIBUTION CHANNEL, METRIC TONNES, SOUTH AMERICA, 2017 - 2029
- Figure 128:
- VALUE OF SOUR MILK DRINKS MARKET BY DISTRIBUTION CHANNEL, USD MN, SOUTH AMERICA, 2017 - 2029
- Figure 129:
- VOLUME SHARE OF SOUR MILK DRINKS MARKET, BY DISTRIBUTION CHANNEL , %, SOUTH AMERICA, 2017 VS 2023 VS 2029
- Figure 130:
- VALUE SHARE OF SOUR MILK DRINKS MARKET, BY DISTRIBUTION CHANNEL , %, SOUTH AMERICA, 2017 VS 2023 VS 2029
- Figure 131:
- VOLUME OF SOUR MILK DRINKS MARKET BY COUNTRY, METRIC TONNES, SOUTH AMERICA, 2017 - 2029
- Figure 132:
- VALUE OF SOUR MILK DRINKS MARKET BY COUNTRY, USD MN, SOUTH AMERICA, 2017 - 2029
- Figure 133:
- VOLUME SHARE OF SOUR MILK DRINKS MARKET, BY COUNTRY , %, SOUTH AMERICA, 2017 VS 2023 VS 2029
- Figure 134:
- VALUE SHARE OF SOUR MILK DRINKS MARKET, BY COUNTRY , %, SOUTH AMERICA, 2017 VS 2023 VS 2029
- Figure 135:
- VOLUME OF SOUR MILK DRINKS MARKET, METRIC TONNES, REST OF SOUTH AMERICA, 2017 - 2029
- Figure 136:
- VALUE OF SOUR MILK DRINKS MARKET, USD MN, REST OF SOUTH AMERICA, 2017 - 2029
- Figure 137:
- MOST ACTIVE COMPANIES BY NUMBER OF STRATEGIC MOVES, COUNT, GLOBAL, 2017 - 2029
- Figure 138:
- MOST ADOPTED STRATEGIES, COUNT, GLOBAL, 2017 - 2029
- Figure 139:
- VALUE SHARE OF MAJOR PLAYERS, %, GLOBAL
Sour Milk Drinks Industry Segmentation
Off-Trade, On-Trade are covered as segments by Distribution Channel. Africa, Asia-Pacific, Europe, Middle East, North America, South America are covered as segments by Region.| Distribution Channel | Off-Trade | Convenience Stores | |
| Online Retail | |||
| Specialist Retailers | |||
| Supermarkets and Hypermarkets | |||
| Others (Warehouse clubs, gas stations, etc.) | |||
| On-Trade | |||
| Region | Africa | By Distribution Channel | |
| Egypt | |||
| South Africa | |||
| Rest of Africa | |||
| Asia-Pacific | By Distribution Channel | ||
| Australia | |||
| India | |||
| Indonesia | |||
| Pakistan | |||
| South Korea | |||
| Europe | By Distribution Channel | ||
| Belgium | |||
| France | |||
| Germany | |||
| Italy | |||
| Netherlands | |||
| Russia | |||
| Spain | |||
| Turkey | |||
| United Kingdom | |||
| Rest of Europe | |||
| Middle East | By Distribution Channel | ||
| Bahrain | |||
| Iran | |||
| Kuwait | |||
| Oman | |||
| Qatar | |||
| Saudi Arabia | |||
| United Arab Emirates | |||
| Rest of Middle East | |||
| North America | By Distribution Channel | ||
| Canada | |||
| Mexico | |||
| United States | |||
| South America | By Distribution Channel | ||
| Rest of South America | |||
Need A Different Region or Segment?
Customize Now
Market Definition
- Butter - Butter is a yellow-to-white solid emulsion of fat globules, water, and inorganic salts produced by churning the cream from cows’ milk
- Dairy - Dairy product include milk and any of the foods made from milk, including butter, cheese, ice cream, yogurt, and condensed and dried milk.
- Frozen Desserts - Frozen dairy dessert means and includes products containing milk or cream and other ingredients which are frozen or semi-frozen prior to consumption, such as ice milk or sherbet, including frozen dairy desserts for special dietary purposes, and sorbet
- Sour Milk Drinks - Sour milk is thick, curdled milk, with a sour taste, obtained from the fermentation of milk. Sour milk drinks such as kefir, laban, buttermilk have been considered in the study
| Keyword | Definition |
|---|---|
| Cultured Butter | Cultured butter is prepared by having the raw butter go through chemical processing and has been added with certain emulsifiers and foreign ingredients. |
| Uncultured Butter | This type of butter is one which has not been processed in any way |
| Natural Cheese | The type of cheese in its most natural form. It is made from natural and simple products and ingredients, including fresh and natural salts, natural colors, enzymes, and high-quality milk. |
| Processed Cheese | Processed cheese undergoes the same processes as natural cheese; however, it requires more steps and many different forms of ingredients. Making processed cheese involves melting natural cheese, emulsifying it, and adding preservatives and other artificial ingredients or colorings. |
| Single Cream | Single cream contains around 18% fat. It’s a single layer of cream that appears over boiled milk. |
| Double Cream | Double cream contains 48% fat, more than double the amount of fat of single cream. It’s heavier and thicker than single cream |
| Whipping Cream | This has a much higher fat percentage than single cream (36%). Used to top cakes, pies, and puddings and as a thickener for sauces, soups, and fillings. |
| Frozen Desserts | Desserts that are meant to be eaten in frozen condition. E.g., sherbets, sorbets, frozen yogurts |
| UHT Milk (Ultra-high temperature milk) | Milk heated at a very high temperature. Ultra-high-temperature processing (UHT) of milk involves heating for 1–8 sec at 135–154°C. which kills the spore-forming pathogenic microorganism, resulting in a product with a shelf-life of several months. |
| Non-dairy butter/Plant-based butter | Butter made from plant-derived oil such as coconut, palm, etc. |
| Non-dairy Yogurt | Yogurt made from typically made from nuts, like almonds, cashews, coconuts, and even other foods like soybeans, plantains, oats, and peas |
| On-trade | It refers to restaurants, QSRs, and bars. |
| Off-trade | It refers to supermarkets, hypermarkets, on-line channels, etc. |
| Neufchatel cheese | One of the oldest kinds of cheese in France. It is a soft, slightly crumbly, mold-ripened, bloomy-rind cheese made in the Neufchâtel-en-Bray region of Normandy. |
| Flexitarian | It refers to a consumer preferring a semi-vegetarian diet, that is centered on plant foods with limited or occasional inclusion of meat. |
| Lactose Intolerance | Lactose intolerance is a reaction in digestive system to lactose, the sugar in milk. It causes uncomfortable symptoms in response to the consumption of dairy products. |
| Cream Cheese | Cream cheese is a soft and creamy fresh cheese with a tangy taste made from milk and cream. |
| Sorbets | Sorbet is a frozen dessert made using ice combined with fruit juice, fruit purée, or other ingredients, such as wine, liqueur, or honey. |
| Sherbet | Sherbet is a sweetened frozen dessert made with fruit and some sort of dairy product such as milk or cream. |
| Shelf stable | Foods that can be safely stored at room temperature, or "on the shelf," for at least one year and do not have to be cooked or refrigerated to eat safely. |
| DSD | Direct Store Delivery is the process in supply chain management wherein the product is delivered from manufacturing plant directly to the retailer. |
| OU Kosher | Orthodox Union Kosher is a kosher certification agency based in New York City. |
| Gelato | Gelato is a frozen creamy dessert made with milk, heavy cream and sugar. |
| Grass-fed Cows | Grass-fed cows are allowed to graze in pastures, where they eat a variety of grasses and clover. |
Need More Details on Market Definition?
Ask a Question
Research Methodology
Mordor Intelligence follows a four-step methodology in all our reports.
- Step-1: Identify Key Variables: In order to build a robust forecasting methodology, the variables and factors identified in Step 1 are tested against available historical market numbers. Through an iterative process, the variables required for market forecast are set, and the model is built on the basis of these variables.
- Step-2: Build a Market Model: Market-size estimations for the forecast years are in nominal terms. Inflation is not a part of the pricing, and the average selling price (ASP) is kept constant throughout the forecast period for each country.
- Step-3: Validate and Finalize: In this important step, all market numbers, variables, and analyst calls are validated through an extensive network of primary research experts from the market studied. The respondents are selected across levels and functions to generate a holistic picture of the market studied.
- Step-4: Research Outputs: Syndicated Reports, Custom Consulting Assignments, Databases & Subscription Platforms

Get More Details On Research Methodology
Download PDF


