| Study Period | 2017 - 2030 |
| Base Year For Estimation | 2024 |
| Forecast Data Period | 2025 - 2030 |
| Market Size (2025) | USD 741.2 Million |
| Market Size (2030) | USD 993.8 Million |
| CAGR (2025 - 2030) | 6.04 % |
| Market Concentration | Medium |
Major Players*Disclaimer: Major Players sorted in no particular order |

Sorghum Seed Market Analysis
The Sorghum Seed Market size is estimated at 741.2 million USD in 2025, and is expected to reach 993.8 million USD by 2030, growing at a CAGR of 6.04% during the forecast period (2025-2030).
The sorghum seed industry is experiencing a significant transformation driven by technological advancements in seed development and changing agricultural practices. A notable shift has been observed in the adoption of hybrid sorghum varieties, which accounted for 70.2% of the global market in 2022, demonstrating farmers' increasing preference for higher-yielding sorghum varieties. This transition reflects the industry's focus on developing seeds with enhanced genetic traits and improved performance characteristics. The advancement in breeding technologies has led to remarkable improvements in crop productivity, with Asia witnessing a 40% increase in grain productivity through the adoption of hybrid varieties.
The industry is witnessing a strong emphasis on sustainable and non-transgenic seed development, with non-transgenic seeds dominating approximately 70% of the global market. This trend aligns with growing consumer preferences for non-GMO products and stricter regulatory requirements in many regions. Seed companies are increasingly investing in research and development to create varieties that offer improved yield potential while maintaining non-transgenic status. These developments are particularly significant in major agricultural markets where regulations around transgenic crops remain stringent.
The market is characterized by increasing mechanization and modernization of farming practices, particularly in developed regions. North American farmers have shown strong adoption of hybrid varieties, with over 80% of sorghum cultivation utilizing hybrid seeds, demonstrating the region's advanced agricultural practices. This trend is accompanied by increasing automation in hybrid seed production technology in sorghum and processing, leading to improved seed quality and consistency. The industry is also witnessing significant investments in seed treatment technologies and coating processes to enhance seed performance and protection.
International trade dynamics and changing agricultural policies are reshaping the global sorghum seed market landscape. Countries are implementing supportive policies to boost domestic sorghum production, as evidenced by France's significant expansion in cultivation area, which increased by 50% between 2017 and 2022. The industry is also seeing increased collaboration between seed companies and research institutions to develop varieties adapted to specific regional conditions. These partnerships are crucial in addressing challenges related to climate variability and evolving pest resistance while meeting the growing demand for high-quality sorghum seed.
Global Sorghum Seed Market Trends
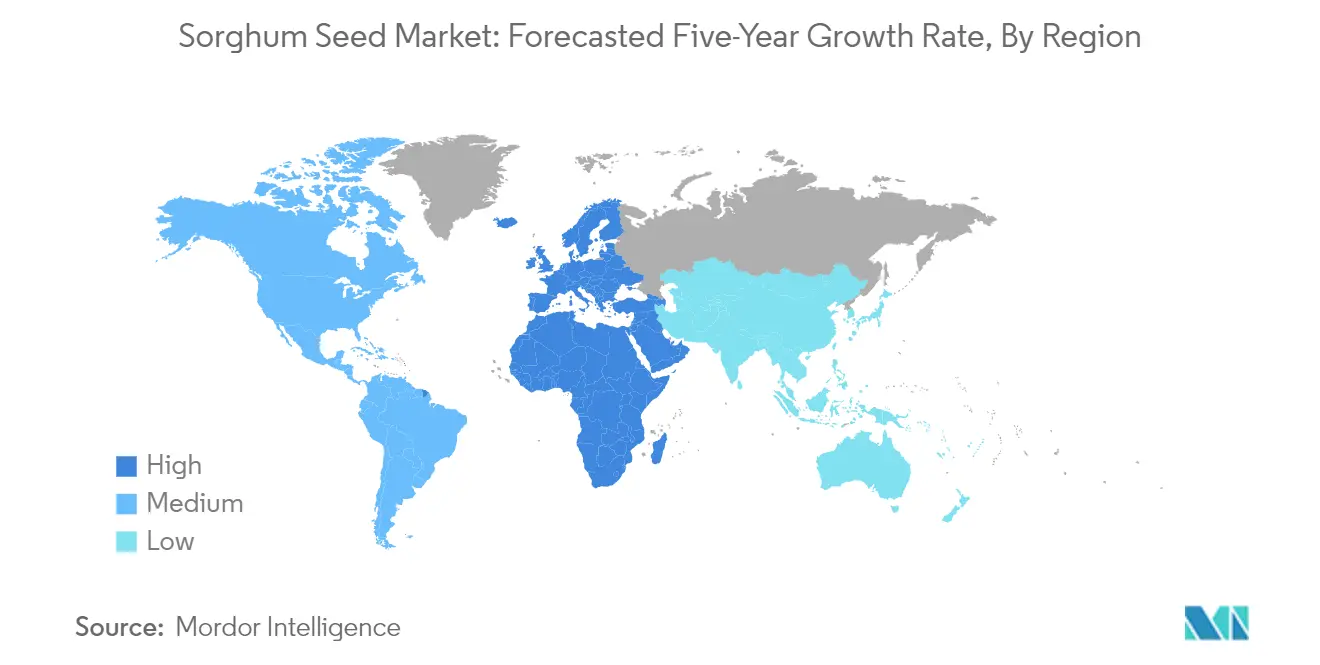
Africa dominated the area under cultivation for sorghum due to its climatic conditions and water scarcity
- Sorghum is an important cereal crop grown globally for food and feed. It is most widely grown in the semi-arid tropics, where water availability is limited and frequently subjected to drought. The global sorghum cultivation area decreased by 8.2% from 2016 to 2022. Farmers prefer rice, wheat, and other cash crops over sorghum due to the high return on investment, leading to a decline in the acreage for sorghum.
- Africa has the largest area under cultivation for sorghum, which accounted for 69.5% of the global sorghum cultivation area in 2022. The acreage showed a decline of 6.2% between 2016 and 2022 due to the farmer's shift toward other crops, including corn, due to higher demand.
- In Asia-Pacific, the acreage under sorghum cultivation was 5.4 million hectares in 2022, representing 13.3 % of the global sorghum cultivation area. A factor driving the acreage under sorghum is its ability to yield and grow in dry and marginal land more than other crops. Its distinct genetics and composition allow it to grow in various climatic conditions where other crops cannot.
- In North America, the area under cultivation of sorghum increased by 13% between 2017 and 2022, which reached 4.1 million hectares in 2022. The United States alone accounted for 64.6% of North America's sorghum acreage in 2022. The rising export demand for sorghum, especially from the massive Chinese feed industry, is boosting seed sales from the commercially operated sorghum farms in the country. Thus, the acreage is expected to increase during the forecast period. South America and Europe have moderate markets for sorghum, and the cultivation area is low in these regions.

Understand The Key Trends Shaping This Market
Download PDF
Sorghum seeds with traits such as wider adaptability, disease resistance, and early maturity are witnessing high growth to meet the demand of processing industries
- Sorghum is mainly cultivated in Africa and North America as a grain and forage for cattle feed. It is one of the staple foods in Africa, where water scarcity is high. It is also one of the grain crops that can withstand low water conditions. With the increase in the cattle population and changes in weather conditions over the past five years in the region (such as droughts in Africa), varieties tolerant to drought are becoming popular. Furthermore, with the changing weather and soil conditions, there has been an increase in biotic and abiotic stress, which has led to the growth of broader adaptability varieties being adopted by the growers to earn high profits by producing high-quality crops in adverse conditions. Companies such as Advanta Seeds, KWS Saat & Co., and Land O' Lakes are providing wider adaptability traits to meet this high demand.
- Disease-resistant traits, as well as resistance to downy mildew, root rots, downy mosaic virus, and other diseases, are other major traits that are very popular and widely cultivated. These diseases cause significant yield losses during field conditions. Therefore, these varieties resist these diseases and increase the productivity of the crops. Additionally, other traits such as resistance to pests (stem borers, shoot-fly, and midge fly), low and high tannin content, early-medium matured varieties, and the color of the grains (red, white, pearl white, etc.) are primarily used globally. KWS Fenixus and BRS 310 - Graniferous by KWS are the products that help in the early maturity of the crop.
- The demand for advanced traits is expected to increase in the future due to increased demand from consumers, the processing industry, and dairy farmers.

OTHER KEY INDUSTRY TRENDS COVERED IN THE REPORT
- Hybrid breeding technology dominates the global sorghum seed market due to its ability to offer higher yield and disease resistance
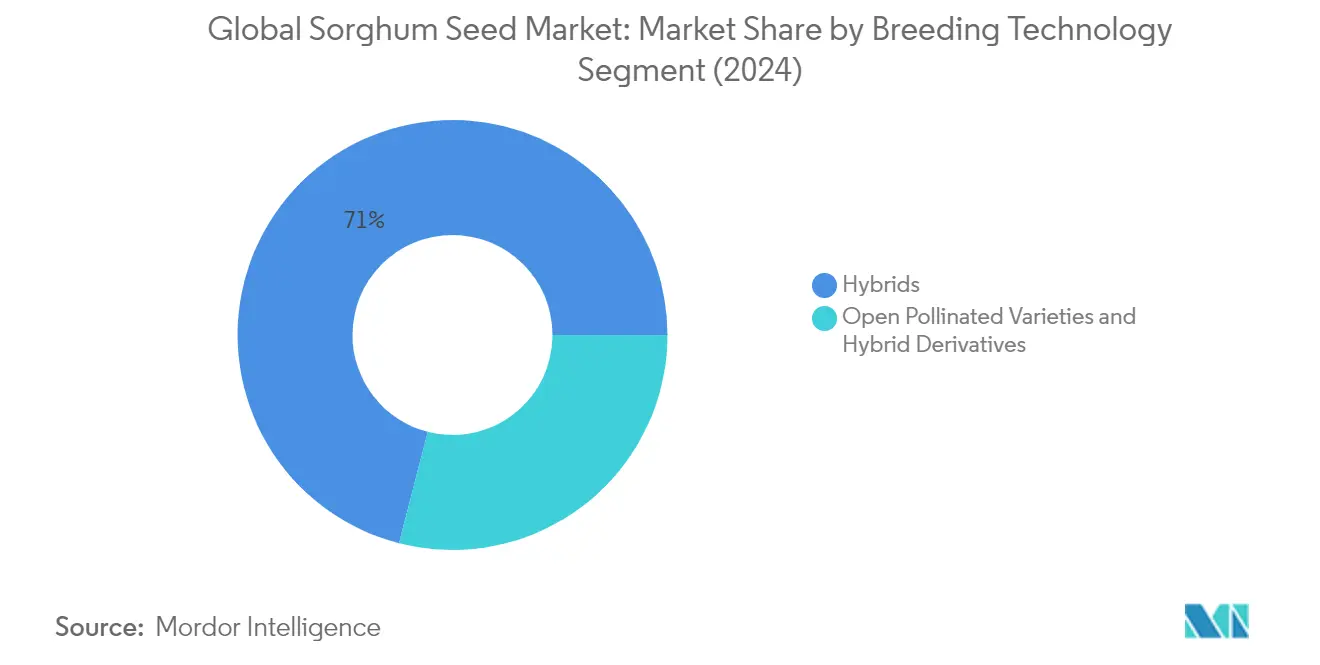
Segment Analysis: Breeding Technology
Hybrids Segment in Global Sorghum Seed Market
The hybrids segment dominates the global sorghum seed market, accounting for approximately 71% of the total market value in 2024. This significant market share is attributed to the increased adoption of hybrid seed production technology in sorghum due to its superior characteristics, including higher yield potential, disease resistance, and wider adaptability to different climatic conditions. The segment is also experiencing the fastest growth trajectory, projected to expand at around 7% CAGR from 2024 to 2029, driven by the continuous development of improved sorghum varieties by major seed companies. Farmers increasingly prefer hybrid sorghum seeds despite their higher costs due to benefits like better drought tolerance, enhanced disease resistance, and significantly higher productivity per hectare compared to conventional varieties. The adoption of hybrid seeds has contributed substantially to increased grain yields, particularly in Asia, where grain productivity has improved by about 40%. The segment's growth is further supported by extensive research and development activities focused on developing hybrids with traits such as better stress tolerance and improved nutritional profiles.
Open Pollinated Varieties & Hybrid Derivatives in Sorghum Seed Market
The open pollinated varieties (OPV) and hybrid derivatives segment represents the traditional approach to sorghum seed cultivation, particularly prevalent among small-scale farmers and in regions with limited access to advanced seed technologies. This segment maintains its relevance in the market due to several key advantages, including lower seed costs compared to hybrids, better adaptability to local environmental conditions, and the ability of farmers to save seeds for subsequent planting seasons. Small-scale farmers, particularly in developing regions, continue to prefer OPVs due to their intrinsic quality attributes, minimal production input requirements, and natural adaptation to local growing conditions. The segment also plays a crucial role in maintaining sorghum genetics diversity and providing options for organic and sustainable farming practices, especially in regions where traditional farming methods are still predominant.
Sorghum Seed Market Geography Segment Analysis
Sorghum Seed Market in Africa
The African sorghum seed market demonstrates significant diversity across its key markets, including Egypt, Ethiopia, Ghana, Kenya, Nigeria, South Africa, and Tanzania. The region's agricultural landscape is characterized by varying climatic conditions that influence sorghum cultivation patterns. Sorghum plays a crucial role as a staple food crop across these nations, with production concentrated in areas where its drought-resistant properties are particularly valuable. The market is driven by the increasing adoption of improved varieties and growing demand from both the food and feed industries.
Sorghum Seed Market in Nigeria
Nigeria emerges as the dominant force in Africa's sorghum seed market, holding approximately 32% market share in 2024. The country's leadership position is attributed to its extensive agricultural infrastructure and favorable growing conditions. Major sorghum-producing regions include Dodoma, Singida, and Simiyu, which collectively contribute to the country's substantial output. The Nigerian government's supportive policies and initiatives have helped establish a robust sorghum cultivation ecosystem, encouraging farmers to adopt improved seed varieties and modern farming practices.
Sorghum Seed Market in Romania
Romania demonstrates remarkable growth potential in the African sorghum seed market, with a projected growth rate of approximately 12% during 2024-2029. The country's impressive growth trajectory is driven by the increasing adoption of technology-oriented sorghum hybrids specifically designed to address climate change challenges. Romanian farmers are increasingly recognizing sorghum's potential as a drought-resistant crop, particularly in regions affected by water scarcity. The country's agricultural sector has shown significant advancement in terms of mechanization and the adoption of modern farming techniques.
Sorghum Seed Market in Asia-Pacific
The Asia-Pacific sorghum seed market encompasses diverse agricultural landscapes across Australia, Bangladesh, China, India, Myanmar, Pakistan, the Philippines, and Thailand. Each country presents unique market dynamics influenced by local farming practices, climatic conditions, and governmental policies. The region's market is characterized by the increasing adoption of hybrid seeds and growing awareness about sorghum's potential as both a food and feed crop. Agricultural modernization initiatives and technological advancements in seed development have significantly influenced market growth across these nations.
Sorghum Seed Market in China
China dominates the Asia-Pacific sorghum seed market, commanding approximately 25% market share in 2024. The country's market leadership is supported by its extensive agricultural infrastructure and strong domestic demand from both the food and feed sectors. Key sorghum cultivation provinces include Inner Mongolia, Liaoning, Jilin, Heilongjiang, Sichuan, Shanxi, and Guizhou, which together form the backbone of China's sorghum production. The country's focus on agricultural modernization and sustainable farming practices has contributed to its market dominance.
Sorghum Seed Market in Myanmar
Myanmar exhibits the highest growth potential in the Asia-Pacific region, with an expected growth rate of approximately 6% during 2024-2029. The country's agricultural sector is undergoing significant transformation, particularly in sorghum cultivation practices. Myanmar's farmers are increasingly adopting improved seed varieties and modern farming techniques, supported by government initiatives to enhance agricultural productivity. The country's favorable climatic conditions and increasing awareness about sorghum's benefits among farmers contribute to its rapid market growth.
Sorghum Seed Market in Europe
The European sorghum seed market encompasses several key countries, including France, Germany, Italy, Romania, Russia, Spain, and Ukraine. The market demonstrates sophisticated agricultural practices and strong research and development capabilities in seed technology. European farmers increasingly recognize sorghum's potential as a sustainable crop choice, particularly in regions facing water scarcity and climate change challenges. The region's market is characterized by high adoption rates of hybrid varieties and advanced farming techniques.
Sorghum Seed Market in France
France maintains its position as the largest sorghum seed market in Europe, driven by its advanced agricultural infrastructure and strong research capabilities. The country's leadership in sorghum seed production is supported by well-established seed companies and research institutions. French farmers demonstrate high adoption rates of improved varieties and modern cultivation techniques, making the country a benchmark for sorghum cultivation in Europe.
Sorghum Seed Market in Romania
Romania emerges as the fastest-growing market in Europe's sorghum seed sector. The country's agricultural sector is experiencing rapid transformation in sorghum cultivation practices, supported by the increasing adoption of modern farming techniques. Romanian farmers are increasingly recognizing sorghum's potential as a climate-resilient crop, particularly in regions affected by changing weather patterns. The country's growth is further supported by strong governmental policies promoting sustainable agriculture.
Sorghum Seed Market in Middle East
The Middle Eastern sorghum seed market, primarily represented by Iran and Saudi Arabia, demonstrates unique characteristics influenced by the region's arid climate and water scarcity challenges. The market is characterized by the increasing adoption of drought-resistant varieties and modern irrigation techniques. Saudi Arabia emerges as the largest market in the region, benefiting from substantial agricultural investments and government support for sustainable farming practices. Meanwhile, Iran shows the fastest growth potential, driven by the increasing adoption of improved seed varieties and modern farming techniques.
Sorghum Seed Market in North America
The North American sorghum seed market, comprising the United States and Mexico, represents a mature and technologically advanced agricultural sector. The region benefits from extensive research and development capabilities, strong infrastructure, and high adoption rates of improved varieties. The United States maintains its position as the largest market, supported by extensive agricultural infrastructure and strong export capabilities. Mexico demonstrates the fastest growth potential, driven by increasing domestic demand and the adoption of improved cultivation practices.
Sorghum Seed Market in South America
The South American sorghum seed market, primarily represented by Argentina and Brazil, shows strong growth potential driven by increasing export opportunities and domestic demand. The region benefits from favorable climatic conditions and extensive agricultural lands suitable for sorghum cultivation. Brazil emerges as the largest market, supported by its extensive agricultural infrastructure and strong domestic demand. Argentina shows the fastest growth potential, driven by increasing export opportunities and the adoption of improved cultivation practices.
Get Analysis on Important Geographic Markets
Download PDF
Sorghum Seed Industry Overview
Top Companies in Sorghum Seed Market
The global sorghum seed market features prominent players like Land O'Lakes Inc., Advanta Seeds - UPL, KWS SAAT SE & Co., RAGT Group, and Corteva Agriscience, leading the industry through continuous innovation and strategic initiatives. Companies are heavily investing in research and development to introduce improved hybrid sorghum varieties with enhanced traits such as disease resistance, drought tolerance, and higher yield potential. Strategic partnerships and licensing agreements have become crucial for expanding product portfolios and accessing new markets, particularly in developing regions. Market leaders are focusing on strengthening their distribution networks and providing comprehensive agronomic support to farmers. The industry has witnessed significant product launches targeting specific regional requirements and climatic conditions, while companies are also investing in seed treatment technologies to improve seed performance and shelf life.
Consolidated Market with Strong Regional Players
The sorghum seed market exhibits a consolidated structure with major multinational corporations dominating the global landscape while maintaining a strong regional presence through subsidiaries and partnerships. These companies leverage their extensive research capabilities, established distribution networks, and brand reputation to maintain market leadership. The industry has witnessed strategic acquisitions and mergers aimed at expanding geographical presence and strengthening technological capabilities, particularly in developing markets where sorghum cultivation is prominent. Local seed companies play a crucial role in serving specific regional markets through their understanding of local farming practices and environmental conditions.
The market is characterized by a mix of diversified agricultural conglomerates and specialized seed companies, each bringing unique strengths to the competitive landscape. Large conglomerates benefit from integrated operations across the agricultural value chain, while specialized players focus on developing innovative sorghum varieties for specific market segments. The industry has seen increased collaboration between private companies and research institutions to develop improved varieties, particularly in addressing regional challenges such as climate change and water scarcity. Market participants are also expanding their presence in emerging markets through joint ventures and strategic alliances with local players.
Innovation and Market Access Drive Growth
Success in the sorghum seed market increasingly depends on companies' ability to develop innovative products that address specific regional challenges while maintaining consistent quality. Incumbent players must focus on strengthening their research and development capabilities, particularly in developing hybrid varieties with improved traits for stress tolerance and disease resistance. Companies need to invest in building strong relationships with farmers through comprehensive support services and education programs. Establishing efficient supply chain networks and maintaining strong quality control measures are crucial for maintaining market position. Market leaders must also focus on sustainable practices and environmental stewardship to meet evolving regulatory requirements and consumer preferences.
New entrants and emerging players can gain market share by focusing on niche markets and developing specialized varieties for specific applications or regions. Success factors include building strong partnerships with local distributors and agricultural institutions to understand regional requirements and establish market presence. Companies must invest in developing cost-effective production methods while maintaining high-quality standards to compete effectively. Regulatory compliance and certification requirements pose significant barriers to entry, making it essential for new players to develop robust quality management systems. The ability to provide comprehensive technical support and after-sales service will be crucial for building long-term relationships with farmers and gaining market share.
Sorghum Seed Market Leaders
-
Advanta Seeds - UPL
-
Corteva Agriscience
-
KWS SAAT SE & Co. KGaA
-
Land O’Lakes Inc.
-
RAGT Group
- *Disclaimer: Major Players sorted in no particular order

Need More Details on Market Players and Competitors?
Download PDF
Sorghum Seed Market News
- March 2022: Corteva introduced the Inzent trait sorghum variety under the Pioneer brand. The variety controls yield-depleting annual grasses such as foxtail, barnyard grass, and panicum.
- November 2020: S&W Seed acquired Chromatin Sorghum, a US-based sorghum operator, for USD 26.5 million. With this acquisition, all the assets and assigned contracts of Chromatin, including its sorghum hybrids developed to date, will be taken over by S&W.
- June 2020: S&W collaborated with ADAMA to introduce the DoubleTeam grassy weed management system to the US sorghum market, which consists of ADAMA's proprietary herbicides and non-GMO, herbicide-tolerant sorghum hybrids.
Free With This Report
We provide a complimentary and exhaustive set of data points on regional and country-level metrics that present the fundamental structure of the industry. Presented in the form of 90+ free charts, the section covers difficult-to-find data from various regions regarding the area under cultivation for different crops within the scope


Sorghum Seed Market Report - Table of Contents
1. EXECUTIVE SUMMARY & KEY FINDINGS
2. REPORT OFFERS
3. INTRODUCTION
- 3.1 Study Assumptions & Market Definition
- 3.2 Scope of the Study
- 3.3 Research Methodology
4. KEY INDUSTRY TRENDS
- 4.1 Area Under Cultivation
- 4.2 Most Popular Traits
- 4.3 Breeding Techniques
- 4.4 Regulatory Framework
- 4.5 Value Chain & Distribution Channel Analysis
5. MARKET SEGMENTATION (includes market size in Value in USD, Forecasts up to 2030 and analysis of growth prospects)
-
5.1 Breeding Technology
- 5.1.1 Hybrids
- 5.1.1.1 Non-Transgenic Hybrids
- 5.1.2 Open Pollinated Varieties & Hybrid Derivatives
-
5.2 Region
- 5.2.1 Africa
- 5.2.1.1 By Breeding Technology
- 5.2.1.2 By Country
- 5.2.1.2.1 Egypt
- 5.2.1.2.2 Ethiopia
- 5.2.1.2.3 Ghana
- 5.2.1.2.4 Kenya
- 5.2.1.2.5 Nigeria
- 5.2.1.2.6 South Africa
- 5.2.1.2.7 Tanzania
- 5.2.1.2.8 Rest of Africa
- 5.2.2 Asia-Pacific
- 5.2.2.1 By Breeding Technology
- 5.2.2.2 By Country
- 5.2.2.2.1 Australia
- 5.2.2.2.2 Bangladesh
- 5.2.2.2.3 China
- 5.2.2.2.4 India
- 5.2.2.2.5 Myanmar
- 5.2.2.2.6 Pakistan
- 5.2.2.2.7 Philippines
- 5.2.2.2.8 Thailand
- 5.2.2.2.9 Rest of Asia-Pacific
- 5.2.3 Europe
- 5.2.3.1 By Breeding Technology
- 5.2.3.2 By Country
- 5.2.3.2.1 France
- 5.2.3.2.2 Germany
- 5.2.3.2.3 Italy
- 5.2.3.2.4 Romania
- 5.2.3.2.5 Russia
- 5.2.3.2.6 Spain
- 5.2.3.2.7 Ukraine
- 5.2.3.2.8 Rest of Europe
- 5.2.4 Middle East
- 5.2.4.1 By Breeding Technology
- 5.2.4.2 By Country
- 5.2.4.2.1 Iran
- 5.2.4.2.2 Saudi Arabia
- 5.2.4.2.3 Rest of Middle East
- 5.2.5 North America
- 5.2.5.1 By Breeding Technology
- 5.2.5.2 By Country
- 5.2.5.2.1 Mexico
- 5.2.5.2.2 United States
- 5.2.5.2.3 Rest of North America
- 5.2.6 South America
- 5.2.6.1 By Breeding Technology
- 5.2.6.2 By Country
- 5.2.6.2.1 Argentina
- 5.2.6.2.2 Brazil
- 5.2.6.2.3 Rest of South America
6. COMPETITIVE LANDSCAPE
- 6.1 Key Strategic Moves
- 6.2 Market Share Analysis
- 6.3 Company Landscape
-
6.4 Company Profiles
- 6.4.1 Advanta Seeds - UPL
- 6.4.2 Capstone Seeds
- 6.4.3 Corteva Agriscience
- 6.4.4 Kaveri Seeds
- 6.4.5 KWS SAAT SE & Co. KGaA
- 6.4.6 Land O’Lakes Inc.
- 6.4.7 RAGT Group
- 6.4.8 Royal Barenbrug Group
- 6.4.9 S&W Seed Co.
- 6.4.10 Seed Co. Limited
- *List Not Exhaustive
7. KEY STRATEGIC QUESTIONS FOR SEEDS CEOS
8. APPENDIX
-
8.1 Global Overview
- 8.1.1 Overview
- 8.1.2 Porter’s Five Forces Framework
- 8.1.3 Global Value Chain Analysis
- 8.1.4 Global Market Size and DROs
- 8.2 Sources & References
- 8.3 List of Tables & Figures
- 8.4 Primary Insights
- 8.5 Data Pack
- 8.6 Glossary of Terms
You Can Purchase Parts Of This Report. Check Out Prices For Specific Sections
Get Price Break-up Now
List of Tables & Figures
- Figure 1:
- AREA UNDER CULTIVATION OF SORGHUM, HECTARE, GLOBAL, 2017-2022
- Figure 2:
- VALUE SHARE OF MAJOR SORGHUM TRAITS, %, GLOBAL, 2022
- Figure 3:
- VALUE SHARE OF SORGHUM BREEDING TECHNIQUES, %, GLOBAL, 2022
- Figure 4:
- VOLUME OF SORGHUM SEED, METRIC TON, GLOBAL, 2017 - 2030
- Figure 5:
- VALUE OF SORGHUM SEED, USD, GLOBAL, 2017 - 2030
- Figure 6:
- VOLUME OF SORGHUM SEED BY BREEDING TECHNOLOGY CATEGORIES, METRIC TON, GLOBAL, 2017 - 2030
- Figure 7:
- VALUE OF SORGHUM SEED BY BREEDING TECHNOLOGY CATEGORIES, USD, GLOBAL, 2017 - 2030
- Figure 8:
- VOLUME SHARE OF SORGHUM SEED BY BREEDING TECHNOLOGY CATEGORIES, %, GLOBAL, 2017 VS 2023 VS 2030
- Figure 9:
- VALUE SHARE OF SORGHUM SEED BY BREEDING TECHNOLOGY CATEGORIES, %, GLOBAL, 2017 VS 2023 VS 2030
- Figure 10:
- VOLUME OF SORGHUM SEED BY HYBRIDS CATEGORIES, METRIC TON, GLOBAL, 2017 - 2030
- Figure 11:
- VALUE OF SORGHUM SEED BY HYBRIDS CATEGORIES, USD, GLOBAL, 2017 - 2030
- Figure 12:
- VOLUME SHARE OF SORGHUM SEED BY HYBRIDS CATEGORIES, %, GLOBAL, 2017 VS 2023 VS 2030
- Figure 13:
- VALUE SHARE OF SORGHUM SEED BY HYBRIDS CATEGORIES, %, GLOBAL, 2017 VS 2023 VS 2030
- Figure 14:
- VOLUME OF NON-TRANSGENIC HYBRIDS SORGHUM SEED, METRIC TON, GLOBAL, 2017 - 2030
- Figure 15:
- VALUE OF NON-TRANSGENIC HYBRIDS SORGHUM SEED, USD, GLOBAL, 2017 - 2030
- Figure 16:
- VALUE SHARE OF NON-TRANSGENIC HYBRIDS SORGHUM SEED BY COUNTRY, %, GLOBAL, 2023 AND 2030
- Figure 17:
- VOLUME OF OPEN POLLINATED VARIETIES & HYBRID DERIVATIVES SORGHUM SEED, METRIC TON, GLOBAL, 2017 - 2030
- Figure 18:
- VALUE OF OPEN POLLINATED VARIETIES & HYBRID DERIVATIVES SORGHUM SEED, USD, GLOBAL, 2017 - 2030
- Figure 19:
- VALUE SHARE OF OPEN POLLINATED VARIETIES & HYBRID DERIVATIVES SORGHUM SEED BY COUNTRY, %, GLOBAL, 2023 AND 2030
- Figure 20:
- VOLUME OF SORGHUM SEED BY REGION, METRIC TON, GLOBAL, 2017 - 2030
- Figure 21:
- VALUE OF SORGHUM SEED BY REGION, USD, GLOBAL, 2017 - 2030
- Figure 22:
- VOLUME SHARE OF SORGHUM SEED BY REGION, %, GLOBAL, 2017 VS 2023 VS 2030
- Figure 23:
- VALUE SHARE OF SORGHUM SEED BY REGION, %, GLOBAL, 2017 VS 2023 VS 2030
- Figure 24:
- VOLUME OF SORGHUM SEED BY BREEDING TECHNOLOGY CATEGORIES, METRIC TON, AFRICA, 2017 - 2030
- Figure 25:
- VALUE OF SORGHUM SEED BY BREEDING TECHNOLOGY CATEGORIES, USD, AFRICA, 2017 - 2030
- Figure 26:
- VOLUME SHARE OF SORGHUM SEED BY BREEDING TECHNOLOGY CATEGORIES, %, AFRICA, 2017 VS 2023 VS 2030
- Figure 27:
- VALUE SHARE OF SORGHUM SEED BY BREEDING TECHNOLOGY CATEGORIES, %, AFRICA, 2017 VS 2023 VS 2030
- Figure 28:
- VOLUME OF SORGHUM SEED BY COUNTRY, METRIC TON, AFRICA, 2017 - 2030
- Figure 29:
- VALUE OF SORGHUM SEED BY COUNTRY, USD, AFRICA, 2017 - 2030
- Figure 30:
- VOLUME SHARE OF SORGHUM SEED BY COUNTRY, %, AFRICA, 2017 VS 2023 VS 2030
- Figure 31:
- VALUE SHARE OF SORGHUM SEED BY COUNTRY, %, AFRICA, 2017 VS 2023 VS 2030
- Figure 32:
- VOLUME OF EGYPT SORGHUM SEED, METRIC TON, AFRICA, 2017 - 2030
- Figure 33:
- VALUE OF EGYPT SORGHUM SEED, USD, AFRICA, 2017 - 2030
- Figure 34:
- VALUE SHARE OF EGYPT SORGHUM SEED BY BREEDING TECHNOLOGY, %, AFRICA, 2023 AND 2030
- Figure 35:
- VOLUME OF ETHIOPIA SORGHUM SEED, METRIC TON, AFRICA, 2017 - 2030
- Figure 36:
- VALUE OF ETHIOPIA SORGHUM SEED, USD, AFRICA, 2017 - 2030
- Figure 37:
- VALUE SHARE OF ETHIOPIA SORGHUM SEED BY BREEDING TECHNOLOGY, %, AFRICA, 2023 AND 2030
- Figure 38:
- VOLUME OF GHANA SORGHUM SEED, METRIC TON, AFRICA, 2017 - 2030
- Figure 39:
- VALUE OF GHANA SORGHUM SEED, USD, AFRICA, 2017 - 2030
- Figure 40:
- VALUE SHARE OF GHANA SORGHUM SEED BY BREEDING TECHNOLOGY, %, AFRICA, 2023 AND 2030
- Figure 41:
- VOLUME OF KENYA SORGHUM SEED, METRIC TON, AFRICA, 2017 - 2030
- Figure 42:
- VALUE OF KENYA SORGHUM SEED, USD, AFRICA, 2017 - 2030
- Figure 43:
- VALUE SHARE OF KENYA SORGHUM SEED BY BREEDING TECHNOLOGY, %, AFRICA, 2023 AND 2030
- Figure 44:
- VOLUME OF NIGERIA SORGHUM SEED, METRIC TON, AFRICA, 2017 - 2030
- Figure 45:
- VALUE OF NIGERIA SORGHUM SEED, USD, AFRICA, 2017 - 2030
- Figure 46:
- VALUE SHARE OF NIGERIA SORGHUM SEED BY BREEDING TECHNOLOGY, %, AFRICA, 2023 AND 2030
- Figure 47:
- VOLUME OF SOUTH AFRICA SORGHUM SEED, METRIC TON, AFRICA, 2017 - 2030
- Figure 48:
- VALUE OF SOUTH AFRICA SORGHUM SEED, USD, AFRICA, 2017 - 2030
- Figure 49:
- VALUE SHARE OF SOUTH AFRICA SORGHUM SEED BY BREEDING TECHNOLOGY, %, AFRICA, 2023 AND 2030
- Figure 50:
- VOLUME OF TANZANIA SORGHUM SEED, METRIC TON, AFRICA, 2017 - 2030
- Figure 51:
- VALUE OF TANZANIA SORGHUM SEED, USD, AFRICA, 2017 - 2030
- Figure 52:
- VALUE SHARE OF TANZANIA SORGHUM SEED BY BREEDING TECHNOLOGY, %, AFRICA, 2023 AND 2030
- Figure 53:
- VOLUME OF REST OF AFRICA SORGHUM SEED, METRIC TON, AFRICA, 2017 - 2030
- Figure 54:
- VALUE OF REST OF AFRICA SORGHUM SEED, USD, AFRICA, 2017 - 2030
- Figure 55:
- VALUE SHARE OF REST OF AFRICA SORGHUM SEED BY BREEDING TECHNOLOGY, %, AFRICA, 2023 AND 2030
- Figure 56:
- VOLUME OF SORGHUM SEED BY BREEDING TECHNOLOGY CATEGORIES, METRIC TON, ASIA-PACIFIC, 2017 - 2030
- Figure 57:
- VALUE OF SORGHUM SEED BY BREEDING TECHNOLOGY CATEGORIES, USD, ASIA-PACIFIC, 2017 - 2030
- Figure 58:
- VOLUME SHARE OF SORGHUM SEED BY BREEDING TECHNOLOGY CATEGORIES, %, ASIA-PACIFIC, 2017 VS 2023 VS 2030
- Figure 59:
- VALUE SHARE OF SORGHUM SEED BY BREEDING TECHNOLOGY CATEGORIES, %, ASIA-PACIFIC, 2017 VS 2023 VS 2030
- Figure 60:
- VOLUME OF SORGHUM SEED BY COUNTRY, METRIC TON, ASIA-PACIFIC, 2017 - 2030
- Figure 61:
- VALUE OF SORGHUM SEED BY COUNTRY, USD, ASIA-PACIFIC, 2017 - 2030
- Figure 62:
- VOLUME SHARE OF SORGHUM SEED BY COUNTRY, %, ASIA-PACIFIC, 2017 VS 2023 VS 2030
- Figure 63:
- VALUE SHARE OF SORGHUM SEED BY COUNTRY, %, ASIA-PACIFIC, 2017 VS 2023 VS 2030
- Figure 64:
- VOLUME OF AUSTRALIA SORGHUM SEED, METRIC TON, ASIA-PACIFIC, 2017 - 2030
- Figure 65:
- VALUE OF AUSTRALIA SORGHUM SEED, USD, ASIA-PACIFIC, 2017 - 2030
- Figure 66:
- VALUE SHARE OF AUSTRALIA SORGHUM SEED BY BREEDING TECHNOLOGY, %, ASIA-PACIFIC, 2023 AND 2030
- Figure 67:
- VOLUME OF BANGLADESH SORGHUM SEED, METRIC TON, ASIA-PACIFIC, 2017 - 2030
- Figure 68:
- VALUE OF BANGLADESH SORGHUM SEED, USD, ASIA-PACIFIC, 2017 - 2030
- Figure 69:
- VALUE SHARE OF BANGLADESH SORGHUM SEED BY BREEDING TECHNOLOGY, %, ASIA-PACIFIC, 2023 AND 2030
- Figure 70:
- VOLUME OF CHINA SORGHUM SEED, METRIC TON, ASIA-PACIFIC, 2017 - 2030
- Figure 71:
- VALUE OF CHINA SORGHUM SEED, USD, ASIA-PACIFIC, 2017 - 2030
- Figure 72:
- VALUE SHARE OF CHINA SORGHUM SEED BY BREEDING TECHNOLOGY, %, ASIA-PACIFIC, 2023 AND 2030
- Figure 73:
- VOLUME OF INDIA SORGHUM SEED, METRIC TON, ASIA-PACIFIC, 2017 - 2030
- Figure 74:
- VALUE OF INDIA SORGHUM SEED, USD, ASIA-PACIFIC, 2017 - 2030
- Figure 75:
- VALUE SHARE OF INDIA SORGHUM SEED BY BREEDING TECHNOLOGY, %, ASIA-PACIFIC, 2023 AND 2030
- Figure 76:
- VOLUME OF MYANMAR SORGHUM SEED, METRIC TON, ASIA-PACIFIC, 2017 - 2030
- Figure 77:
- VALUE OF MYANMAR SORGHUM SEED, USD, ASIA-PACIFIC, 2017 - 2030
- Figure 78:
- VALUE SHARE OF MYANMAR SORGHUM SEED BY BREEDING TECHNOLOGY, %, ASIA-PACIFIC, 2023 AND 2030
- Figure 79:
- VOLUME OF PAKISTAN SORGHUM SEED, METRIC TON, ASIA-PACIFIC, 2017 - 2030
- Figure 80:
- VALUE OF PAKISTAN SORGHUM SEED, USD, ASIA-PACIFIC, 2017 - 2030
- Figure 81:
- VALUE SHARE OF PAKISTAN SORGHUM SEED BY BREEDING TECHNOLOGY, %, ASIA-PACIFIC, 2023 AND 2030
- Figure 82:
- VOLUME OF PHILIPPINES SORGHUM SEED, METRIC TON, ASIA-PACIFIC, 2017 - 2030
- Figure 83:
- VALUE OF PHILIPPINES SORGHUM SEED, USD, ASIA-PACIFIC, 2017 - 2030
- Figure 84:
- VALUE SHARE OF PHILIPPINES SORGHUM SEED BY BREEDING TECHNOLOGY, %, ASIA-PACIFIC, 2023 AND 2030
- Figure 85:
- VOLUME OF THAILAND SORGHUM SEED, METRIC TON, ASIA-PACIFIC, 2017 - 2030
- Figure 86:
- VALUE OF THAILAND SORGHUM SEED, USD, ASIA-PACIFIC, 2017 - 2030
- Figure 87:
- VALUE SHARE OF THAILAND SORGHUM SEED BY BREEDING TECHNOLOGY, %, ASIA-PACIFIC, 2023 AND 2030
- Figure 88:
- VOLUME OF REST OF ASIA-PACIFIC SORGHUM SEED, METRIC TON, ASIA-PACIFIC, 2017 - 2030
- Figure 89:
- VALUE OF REST OF ASIA-PACIFIC SORGHUM SEED, USD, ASIA-PACIFIC, 2017 - 2030
- Figure 90:
- VALUE SHARE OF REST OF ASIA-PACIFIC SORGHUM SEED BY BREEDING TECHNOLOGY, %, ASIA-PACIFIC, 2023 AND 2030
- Figure 91:
- VOLUME OF SORGHUM SEED BY BREEDING TECHNOLOGY CATEGORIES, METRIC TON, EUROPE, 2017 - 2030
- Figure 92:
- VALUE OF SORGHUM SEED BY BREEDING TECHNOLOGY CATEGORIES, USD, EUROPE, 2017 - 2030
- Figure 93:
- VOLUME SHARE OF SORGHUM SEED BY BREEDING TECHNOLOGY CATEGORIES, %, EUROPE, 2017 VS 2023 VS 2030
- Figure 94:
- VALUE SHARE OF SORGHUM SEED BY BREEDING TECHNOLOGY CATEGORIES, %, EUROPE, 2017 VS 2023 VS 2030
- Figure 95:
- VOLUME OF SORGHUM SEED BY COUNTRY, METRIC TON, EUROPE, 2017 - 2030
- Figure 96:
- VALUE OF SORGHUM SEED BY COUNTRY, USD, EUROPE, 2017 - 2030
- Figure 97:
- VOLUME SHARE OF SORGHUM SEED BY COUNTRY, %, EUROPE, 2017 VS 2023 VS 2030
- Figure 98:
- VALUE SHARE OF SORGHUM SEED BY COUNTRY, %, EUROPE, 2017 VS 2023 VS 2030
- Figure 99:
- VOLUME OF FRANCE SORGHUM SEED, METRIC TON, EUROPE, 2017 - 2030
- Figure 100:
- VALUE OF FRANCE SORGHUM SEED, USD, EUROPE, 2017 - 2030
- Figure 101:
- VALUE SHARE OF FRANCE SORGHUM SEED BY BREEDING TECHNOLOGY, %, EUROPE, 2023 AND 2030
- Figure 102:
- VOLUME OF GERMANY SORGHUM SEED, METRIC TON, EUROPE, 2017 - 2030
- Figure 103:
- VALUE OF GERMANY SORGHUM SEED, USD, EUROPE, 2017 - 2030
- Figure 104:
- VALUE SHARE OF GERMANY SORGHUM SEED BY BREEDING TECHNOLOGY, %, EUROPE, 2023 AND 2030
- Figure 105:
- VOLUME OF ITALY SORGHUM SEED, METRIC TON, EUROPE, 2017 - 2030
- Figure 106:
- VALUE OF ITALY SORGHUM SEED, USD, EUROPE, 2017 - 2030
- Figure 107:
- VALUE SHARE OF ITALY SORGHUM SEED BY BREEDING TECHNOLOGY, %, EUROPE, 2023 AND 2030
- Figure 108:
- VOLUME OF ROMANIA SORGHUM SEED, METRIC TON, EUROPE, 2017 - 2030
- Figure 109:
- VALUE OF ROMANIA SORGHUM SEED, USD, EUROPE, 2017 - 2030
- Figure 110:
- VALUE SHARE OF ROMANIA SORGHUM SEED BY BREEDING TECHNOLOGY, %, EUROPE, 2023 AND 2030
- Figure 111:
- VOLUME OF RUSSIA SORGHUM SEED, METRIC TON, EUROPE, 2017 - 2030
- Figure 112:
- VALUE OF RUSSIA SORGHUM SEED, USD, EUROPE, 2017 - 2030
- Figure 113:
- VALUE SHARE OF RUSSIA SORGHUM SEED BY BREEDING TECHNOLOGY, %, EUROPE, 2023 AND 2030
- Figure 114:
- VOLUME OF SPAIN SORGHUM SEED, METRIC TON, EUROPE, 2017 - 2030
- Figure 115:
- VALUE OF SPAIN SORGHUM SEED, USD, EUROPE, 2017 - 2030
- Figure 116:
- VALUE SHARE OF SPAIN SORGHUM SEED BY BREEDING TECHNOLOGY, %, EUROPE, 2023 AND 2030
- Figure 117:
- VOLUME OF UKRAINE SORGHUM SEED, METRIC TON, EUROPE, 2017 - 2030
- Figure 118:
- VALUE OF UKRAINE SORGHUM SEED, USD, EUROPE, 2017 - 2030
- Figure 119:
- VALUE SHARE OF UKRAINE SORGHUM SEED BY BREEDING TECHNOLOGY, %, EUROPE, 2023 AND 2030
- Figure 120:
- VOLUME OF REST OF EUROPE SORGHUM SEED, METRIC TON, EUROPE, 2017 - 2030
- Figure 121:
- VALUE OF REST OF EUROPE SORGHUM SEED, USD, EUROPE, 2017 - 2030
- Figure 122:
- VALUE SHARE OF REST OF EUROPE SORGHUM SEED BY BREEDING TECHNOLOGY, %, EUROPE, 2023 AND 2030
- Figure 123:
- VOLUME OF SORGHUM SEED BY BREEDING TECHNOLOGY CATEGORIES, METRIC TON, MIDDLE EAST, 2017 - 2030
- Figure 124:
- VALUE OF SORGHUM SEED BY BREEDING TECHNOLOGY CATEGORIES, USD, MIDDLE EAST, 2017 - 2030
- Figure 125:
- VOLUME SHARE OF SORGHUM SEED BY BREEDING TECHNOLOGY CATEGORIES, %, MIDDLE EAST, 2017 VS 2023 VS 2030
- Figure 126:
- VALUE SHARE OF SORGHUM SEED BY BREEDING TECHNOLOGY CATEGORIES, %, MIDDLE EAST, 2017 VS 2023 VS 2030
- Figure 127:
- VOLUME OF SORGHUM SEED BY COUNTRY, METRIC TON, MIDDLE EAST, 2017 - 2030
- Figure 128:
- VALUE OF SORGHUM SEED BY COUNTRY, USD, MIDDLE EAST, 2017 - 2030
- Figure 129:
- VOLUME SHARE OF SORGHUM SEED BY COUNTRY, %, MIDDLE EAST, 2017 VS 2023 VS 2030
- Figure 130:
- VALUE SHARE OF SORGHUM SEED BY COUNTRY, %, MIDDLE EAST, 2017 VS 2023 VS 2030
- Figure 131:
- VOLUME OF IRAN SORGHUM SEED, METRIC TON, MIDDLE EAST, 2017 - 2030
- Figure 132:
- VALUE OF IRAN SORGHUM SEED, USD, MIDDLE EAST, 2017 - 2030
- Figure 133:
- VALUE SHARE OF IRAN SORGHUM SEED BY BREEDING TECHNOLOGY, %, MIDDLE EAST, 2023 AND 2030
- Figure 134:
- VOLUME OF SAUDI ARABIA SORGHUM SEED, METRIC TON, MIDDLE EAST, 2017 - 2030
- Figure 135:
- VALUE OF SAUDI ARABIA SORGHUM SEED, USD, MIDDLE EAST, 2017 - 2030
- Figure 136:
- VALUE SHARE OF SAUDI ARABIA SORGHUM SEED BY BREEDING TECHNOLOGY, %, MIDDLE EAST, 2023 AND 2030
- Figure 137:
- VOLUME OF REST OF MIDDLE EAST SORGHUM SEED, METRIC TON, MIDDLE EAST, 2017 - 2030
- Figure 138:
- VALUE OF REST OF MIDDLE EAST SORGHUM SEED, USD, MIDDLE EAST, 2017 - 2030
- Figure 139:
- VALUE SHARE OF REST OF MIDDLE EAST SORGHUM SEED BY BREEDING TECHNOLOGY, %, MIDDLE EAST, 2023 AND 2030
- Figure 140:
- VOLUME OF SORGHUM SEED BY BREEDING TECHNOLOGY CATEGORIES, METRIC TON, NORTH AMERICA, 2017 - 2030
- Figure 141:
- VALUE OF SORGHUM SEED BY BREEDING TECHNOLOGY CATEGORIES, USD, NORTH AMERICA, 2017 - 2030
- Figure 142:
- VOLUME SHARE OF SORGHUM SEED BY BREEDING TECHNOLOGY CATEGORIES, %, NORTH AMERICA, 2017 VS 2023 VS 2030
- Figure 143:
- VALUE SHARE OF SORGHUM SEED BY BREEDING TECHNOLOGY CATEGORIES, %, NORTH AMERICA, 2017 VS 2023 VS 2030
- Figure 144:
- VOLUME OF SORGHUM SEED BY COUNTRY, METRIC TON, NORTH AMERICA, 2017 - 2030
- Figure 145:
- VALUE OF SORGHUM SEED BY COUNTRY, USD, NORTH AMERICA, 2017 - 2030
- Figure 146:
- VOLUME SHARE OF SORGHUM SEED BY COUNTRY, %, NORTH AMERICA, 2017 VS 2023 VS 2030
- Figure 147:
- VALUE SHARE OF SORGHUM SEED BY COUNTRY, %, NORTH AMERICA, 2017 VS 2023 VS 2030
- Figure 148:
- VOLUME OF MEXICO SORGHUM SEED, METRIC TON, NORTH AMERICA, 2017 - 2030
- Figure 149:
- VALUE OF MEXICO SORGHUM SEED, USD, NORTH AMERICA, 2017 - 2030
- Figure 150:
- VALUE SHARE OF MEXICO SORGHUM SEED BY BREEDING TECHNOLOGY, %, NORTH AMERICA, 2023 AND 2030
- Figure 151:
- VOLUME OF UNITED STATES SORGHUM SEED, METRIC TON, NORTH AMERICA, 2017 - 2030
- Figure 152:
- VALUE OF UNITED STATES SORGHUM SEED, USD, NORTH AMERICA, 2017 - 2030
- Figure 153:
- VALUE SHARE OF UNITED STATES SORGHUM SEED BY BREEDING TECHNOLOGY, %, NORTH AMERICA, 2023 AND 2030
- Figure 154:
- VOLUME OF REST OF NORTH AMERICA SORGHUM SEED, METRIC TON, NORTH AMERICA, 2017 - 2030
- Figure 155:
- VALUE OF REST OF NORTH AMERICA SORGHUM SEED, USD, NORTH AMERICA, 2017 - 2030
- Figure 156:
- VALUE SHARE OF REST OF NORTH AMERICA SORGHUM SEED BY BREEDING TECHNOLOGY, %, NORTH AMERICA, 2023 AND 2030
- Figure 157:
- VOLUME OF SORGHUM SEED BY BREEDING TECHNOLOGY CATEGORIES, METRIC TON, SOUTH AMERICA, 2017 - 2030
- Figure 158:
- VALUE OF SORGHUM SEED BY BREEDING TECHNOLOGY CATEGORIES, USD, SOUTH AMERICA, 2017 - 2030
- Figure 159:
- VOLUME SHARE OF SORGHUM SEED BY BREEDING TECHNOLOGY CATEGORIES, %, SOUTH AMERICA, 2017 VS 2023 VS 2030
- Figure 160:
- VALUE SHARE OF SORGHUM SEED BY BREEDING TECHNOLOGY CATEGORIES, %, SOUTH AMERICA, 2017 VS 2023 VS 2030
- Figure 161:
- VOLUME OF SORGHUM SEED BY COUNTRY, METRIC TON, SOUTH AMERICA, 2017 - 2030
- Figure 162:
- VALUE OF SORGHUM SEED BY COUNTRY, USD, SOUTH AMERICA, 2017 - 2030
- Figure 163:
- VOLUME SHARE OF SORGHUM SEED BY COUNTRY, %, SOUTH AMERICA, 2017 VS 2023 VS 2030
- Figure 164:
- VALUE SHARE OF SORGHUM SEED BY COUNTRY, %, SOUTH AMERICA, 2017 VS 2023 VS 2030
- Figure 165:
- VOLUME OF ARGENTINA SORGHUM SEED, METRIC TON, SOUTH AMERICA, 2017 - 2030
- Figure 166:
- VALUE OF ARGENTINA SORGHUM SEED, USD, SOUTH AMERICA, 2017 - 2030
- Figure 167:
- VALUE SHARE OF ARGENTINA SORGHUM SEED BY BREEDING TECHNOLOGY, %, SOUTH AMERICA, 2023 AND 2030
- Figure 168:
- VOLUME OF BRAZIL SORGHUM SEED, METRIC TON, SOUTH AMERICA, 2017 - 2030
- Figure 169:
- VALUE OF BRAZIL SORGHUM SEED, USD, SOUTH AMERICA, 2017 - 2030
- Figure 170:
- VALUE SHARE OF BRAZIL SORGHUM SEED BY BREEDING TECHNOLOGY, %, SOUTH AMERICA, 2023 AND 2030
- Figure 171:
- VOLUME OF REST OF SOUTH AMERICA SORGHUM SEED, METRIC TON, SOUTH AMERICA, 2017 - 2030
- Figure 172:
- VALUE OF REST OF SOUTH AMERICA SORGHUM SEED, USD, SOUTH AMERICA, 2017 - 2030
- Figure 173:
- VALUE SHARE OF REST OF SOUTH AMERICA SORGHUM SEED BY BREEDING TECHNOLOGY, %, SOUTH AMERICA, 2023 AND 2030
- Figure 174:
- MOST ACTIVE COMPANIES BY NUMBER OF STRATEGIC MOVES, COUNT, GLOBAL, 2017-2023
- Figure 175:
- MOST ADOPTED STRATEGIES, COUNT, GLOBAL, 2017-2023
- Figure 176:
- VALUE SHARE OF MAJOR PLAYERS, %, GLOBAL
Sorghum Seed Industry Segmentation
Hybrids, Open Pollinated Varieties & Hybrid Derivatives are covered as segments by Breeding Technology. Africa, Asia-Pacific, Europe, Middle East, North America, South America are covered as segments by Region.| Breeding Technology | Hybrids | Non-Transgenic Hybrids | ||
| Open Pollinated Varieties & Hybrid Derivatives | ||||
| Region | Africa | By Breeding Technology | ||
| By Country | Egypt | |||
| Ethiopia | ||||
| Ghana | ||||
| Kenya | ||||
| Nigeria | ||||
| South Africa | ||||
| Tanzania | ||||
| Rest of Africa | ||||
| Asia-Pacific | By Breeding Technology | |||
| Australia | ||||
| Bangladesh | ||||
| China | ||||
| India | ||||
| Myanmar | ||||
| Pakistan | ||||
| Philippines | ||||
| Thailand | ||||
| Rest of Asia-Pacific | ||||
| Europe | By Breeding Technology | |||
| France | ||||
| Germany | ||||
| Italy | ||||
| Romania | ||||
| Russia | ||||
| Spain | ||||
| Ukraine | ||||
| Rest of Europe | ||||
| Middle East | By Breeding Technology | |||
| Iran | ||||
| Saudi Arabia | ||||
| Rest of Middle East | ||||
| North America | By Breeding Technology | |||
| Mexico | ||||
| United States | ||||
| Rest of North America | ||||
| South America | By Breeding Technology | |||
| Argentina | ||||
| Brazil | ||||
| Rest of South America | ||||
Need A Different Region or Segment?
Customize Now
Market Definition
- Commercial Seed - For the purpose of this study, only commercial seeds have been included as part of the scope. Farm-saved Seeds, which are not commercially labeled are excluded from scope, even though a minor percentage of farm-saved seeds are exchanged commercially among farmers. The scope also excludes vegetatively reproduced crops and plant parts, which may be commercially sold in the market.
- Crop Acreage - While calculating the acreage under different crops, the Gross Cropped Area has been considered. Also known as Area Harvested, according to the Food & Agricultural Organization (FAO), this includes the total area cultivated under a particular crop across seasons.
- Seed Replacement Rate - Seed Replacement Rate is the percentage of area sown out of the total area of crop planted in the season by using certified/quality seeds other than the farm-saved seed.
- Protected Cultivation - The report defines protected cultivation as the process of growing crops in a controlled environment. This includes greenhouses, glasshouses, hydroponics, aeroponics, or any other cultivation system that protects the crop against any abiotic stress. However, cultivation in an open field using plastic mulch is excluded from this definition and is included under open field.
| Keyword | Definition |
|---|---|
| Row Crops | These are usually the field crops which include the different crop categories like grains & cereals, oilseeds, fiber crops like cotton, pulses, and forage crops. |
| Solanaceae | These are the family of flowering plants which includes tomato, chili, eggplants, and other crops. |
| Cucurbits | It represents a gourd family consisting of about 965 species in around 95 genera. The major crops considered for this study include Cucumber & Gherkin, Pumpkin and squash, and other crops. |
| Brassicas | It is a genus of plants in the cabbage and mustard family. It includes crops such as carrots, cabbage, cauliflower & broccoli. |
| Roots & Bulbs | The roots and bulbs segment includes onion, garlic, potato, and other crops. |
| Unclassified Vegetables | This segment in the report includes the crops which don’t belong to any of the above-mentioned categories. These include crops such as okra, asparagus, lettuce, peas, spinach, and others. |
| Hybrid Seed | It is the first generation of the seed produced by controlling cross-pollination and by combining two or more varieties, or species. |
| Transgenic Seed | It is a seed that is genetically modified to contain certain desirable input and/or output traits. |
| Non-Transgenic Seed | The seed produced through cross-pollination without any genetic modification. |
| Open-Pollinated Varieties & Hybrid Derivatives | Open-pollinated varieties produce seeds true to type as they cross-pollinate only with other plants of the same variety. |
| Other Solanaceae | The crops considered under other Solanaceae include bell peppers and other different peppers based on the locality of the respective countries. |
| Other Brassicaceae | The crops considered under other brassicas include radishes, turnips, Brussels sprouts, and kale. |
| Other Roots & Bulbs | The crops considered under other roots & bulbs include Sweet Potatoes and cassava. |
| Other Cucurbits | The crops considered under other cucurbits include gourds (bottle gourd, bitter gourd, ridge gourd, Snake gourd, and others). |
| Other Grains & Cereals | The crops considered under other grains & cereals include Barley, Buck Wheat, Canary Seed, Triticale, Oats, Millets, and Rye. |
| Other Fibre Crops | The crops considered under other fibers include Hemp, Jute, Agave fibers, Flax, Kenaf, Ramie, Abaca, Sisal, and Kapok. |
| Other Oilseeds | The crops considered under other oilseeds include Ground nut, Hempseed, Mustard seed, Castor seeds, safflower seeds, Sesame seeds, and Linseeds. |
| Other Forage Crops | The crops considered under other forages include Napier grass, Oat grass, White clover, Ryegrass, and Timothy. Other forage crops were considered based on the locality of the respective countries. |
| Pulses | Pigeon peas, Lentils, Broad and horse beans, Vetches, Chickpeas, Cowpeas, Lupins, and Bambara beans are the crops considered under pulses. |
| Other Unclassified Vegetables | The crops considered under other unclassified vegetables include Artichokes, Cassava Leaves, Leeks, Chicory, and String beans. |
Need More Details on Market Definition?
Ask a Question
Research Methodology
Mordor Intelligence follows a four-step methodology in all our reports.
- Step-1: IDENTIFY KEY VARIABLES: In order to build a robust forecasting methodology, the variables and factors identified in Step-1 are tested against available historical market numbers. Through an iterative process, the variables required for market forecast are set and the model is built on the basis of these variables.
- Step-2: Build a Market Model: Market-size estimations for the forecast years are in nominal terms. Inflation is not a part of the pricing, and the average selling price (ASP) is kept constant throughout the forecast period.
- Step-3: Validate and Finalize: In this important step, all market numbers, variables and analyst calls are validated through an extensive network of primary research experts from the market studied. The respondents are selected across levels and functions to generate a holistic picture of the market studied.
- Step-4: Research Outputs: Syndicated Reports, Custom Consulting Assignments, Databases, and Subscription Platforms

Get More Details On Research Methodology
Download PDF


