
Sonobuoy Market Size and Share
Market Overview
| Study Period | 2020 - 2031 |
|---|---|
| Market Size (2026) | USD 512.23 Million |
| Market Size (2031) | USD 690.34 Million |
| Growth Rate (2026 - 2031) | 6.15 % |
| Fastest Growing Market | Asia-Pacific |
| Largest Market | North America |
| Market Concentration | High |
Major Players *Disclaimer: Major Players sorted in no particular order Image © Mordor Intelligence. Reuse requires attribution under CC BY 4.0. | |
Sonobuoy Market Analysis by Mordor Intelligence
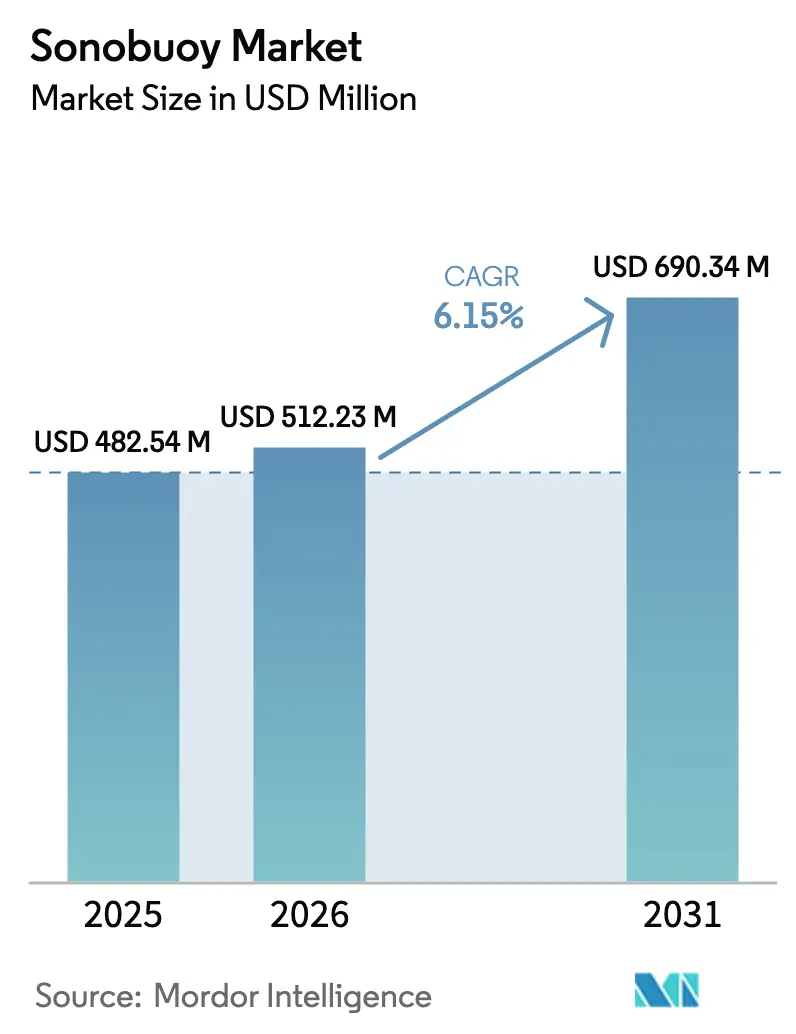
Sonobuoy market size in 2026 is estimated at USD 512.23 million, growing from 2025 value of USD 482.54 million with 2031 projections showing USD 690.34 million, growing at 6.15% CAGR over 2026-2031. Rising outlays on anti-submarine warfare, quiet diesel-electric fleets, and autonomous surveillance platforms keep demand resilient, ensuring the sonobuoy market remains a strategic priority for navies and offshore operators. North America retained procurement leadership, yet Asia-Pacific posts the quickest gains as regional submarine counts grow. Advances in digital signal processing, multistatic low-frequency architectures, and platform miniaturization are lowering the cost-per-detection, expanding coverage, and opening civil energy exploration use cases. At the same time, tighter environmental rules and export controls temper growth by adding compliance costs and supply-chain friction. Competitive intensity is high because a narrow supplier pool still dominates volume contracts, although upcoming joint-production deals and unmanned-platform integration could gradually rebalance market power.
Key Report Takeaways
- By type, passive systems held 54.62% of the sonobuoy market share in 2025, while active variants are projected to grow at a 12.00% CAGR to 2031.
- By size class, Size A accounted for 64.55% of the sonobuoy market size in 2025; Size B units are slated to expand at 13.02% CAGR through 2031.
- By deployment method, free-fall solutions led with 47.85% revenue share in 2025, whereas cartridge/pneumatic formats register a 10.31% CAGR outlook.
- By application, defense captured 85.20% of the sonobuoy market size in 2025; commercial energy exploration is advancing at a 14.35% CAGR to 2031.
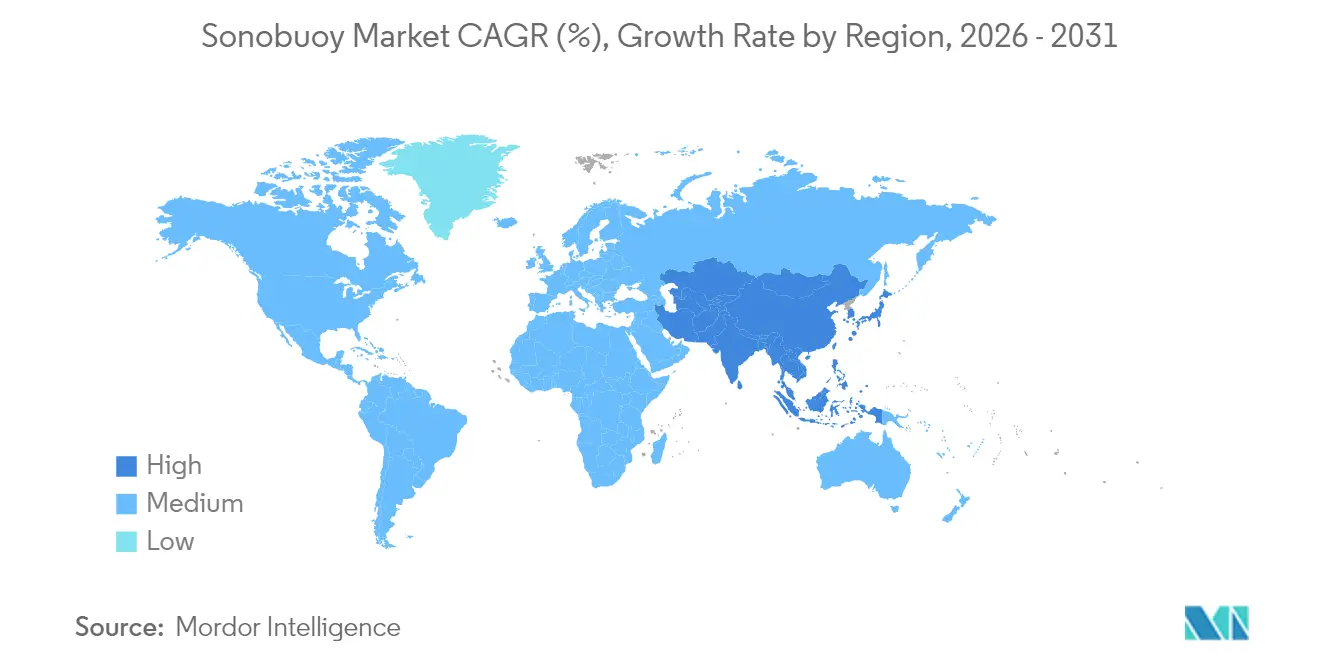
- By geography, North America commanded a 41.85% share in 2025; Asia-Pacific is forecast to add the fastest 11.47% CAGR up to 2031.
Note: Market size and forecast figures in this report are generated using Mordor Intelligence’s proprietary estimation framework, updated with the latest available data and insights as of 2026.
Market Trends and Insights
Drivers Impact Analysis of Sonobuoy Market*
| Driver | (~) % Impact on CAGR Forecast | Geographic Relevance | Impact Timeline |
|---|---|---|---|
| Worldwide proliferation of quiet diesel-electric and AIP submarines elevating expendable ASW demand | +1.8% | Global, Indo-Pacific and North Atlantic | Medium term (2-4 years) |
| Shift from analog to digital sonobuoy architectures enabling multichannel data fusion and longer RF links | +1.2% | North America, EU, expanding Asia-Pacific | Short term (≤ 2 years) |
| Adoption of multistatic low-frequency active concepts lowering cost-per-detection and extending range | +0.9% | Global, led by NATO fleets | Medium term (2-4 years) |
| Rapid uptake of unmanned aerial and surface launch platforms boosting annual buoy deployment rates | +1.1% | North America, Europe, Asia-Pacific | Short term (≤ 2 years) |
| Global standardization via NATO STANAG 4748 and MIL-STD 2525E enhancing interoperability across fleets | +0.7% | NATO and allied nations | Long term (≥ 4 years) |
| Expansion of deep-water energy exploration requiring expendable acoustics for seabed characterisation | +0.5% | Gulf of Mexico, North Sea and global offshore | Medium term (2-4 years) |
| Source: Mordor Intelligence | |||
Worldwide proliferation of quite diesel-electric and AIP submarines elevating expendable ASW demand
Modern diesel-electric and air-independent-propulsion boats now patrol longer in near-silence, narrowing passive detection windows and compelling navies to seed larger listening fields. Procurement plans signal this urgency: the US Navy budgets for roughly 204,000 buoys yearly to sustain inventory, while Indo-Pacific forces accelerate orders for distributed surveillance grids.[1] Higher exercise tempos and real-world tracking missions translate into sustained consumption, anchoring volume growth across the sonobuoy market.
Shift from analog to digital sonobuoy architectures enabling multichannel data fusion and longer RF links
Digital signal chains compress, encrypt, and forward richer acoustic packets over extended radio links, letting operators merge feeds from dozens of nodes in near real time. Automated classification cuts operator workload and improves first-pass confidence, which is key in high-tempo patrols. These architectures also future-proof fleets against congested electromagnetic environments, making them a core upgrade catalyst within the sonobuoy market.
Adoption of multistatic low-frequency active concepts lowering cost-per-detection and extending range
Distributed source-receiver geometries exploit low-frequency propagation to cover wider ocean swaths with fewer expendables, slashing per-hour costs and bolstering standoff safety. Coherent processing dampens reverberation, increasing target-signal clarity and enabling new tactics, particularly for coalition patrols that need interoperable, plug-and-play kits. Adoption momentum feeds an innovation loop that keeps the sonobuoy market technologically dynamic.
Rapid uptake of unmanned aerial and surface launch platforms boosting annual buoy deployment rates
Unmanned aerial vehicles (UAVs) such as the MQ-9B SeaGuardian carry up to 80 small-form-factor buoys and loiter 18 hours, blanketing open-ocean gaps at lower flight-hour costs. Surface drones extend reach into contested littorals. Their arrival drives fresh procurement cycles, broadening the sonobuoy market customer base beyond traditional maritime-patrol squadrons.
Restraints Impact Analysis of Sonobuoy Market*
| Restraint | (~) % Impact on CAGR Forecast | Geographic Relevance | Impact Timeline |
|---|---|---|---|
| High supplier concentration and export-control regimes creating procurement bottlenecks | -0.8% | Global, especially non-NATO allies | Short term (≤ 2 years) |
| Stricter environmental regulations on underwater acoustic emissions constraining operational usage | -0.6% | North America, Europe, spreading Asia-Pacific | Medium term (2-4 years) |
| Competition from non-expendable alternatives such as LF towed arrays and autonomous UUV sonars | -0.4% | Global, led by technologically mature navies | Long term (≥ 4 years) |
| Volatile rare-earth and piezo-ceramic feedstock prices driving up unit production costs | -0.3% | Global, with sensitivity in Asia-Pacific supply chains | Short term (≤ 2 years) |
| Source: Mordor Intelligence | |||
High supplier concentration and export-control regimes creating procurement bottlenecks
ERAPSCO’s long-standing dominance meant a single joint venture fed most US orders; its dissolution forces navies to identify alternate lines while navigating International Traffic in Arms Regulations. New entrants require heavy capital and long qualification cycles, so supply remains tight even as demand climbs. The Defense Production Act funding round seeks to widen capacity, yet export license hurdles still delay deliveries to partner nations, dampening near-term momentum in the sonobuoy market.
Stricter environmental regulations on underwater acoustic emissions constraining operational usage
NOAA’s updated marine-mammal acoustic thresholds impose seasonal or geographic restrictions on sonobuoy use, prompting planners to redesign exercise patterns.[2] Compliance adds cost, limits dwell time, and calls for quieter designs, trimming some growth until new eco-friendly models mature within the sonobuoy market.
*Our forecasts treat driver/restraint impacts as directional, not additive. The impact forecasts reflect baseline growth, mix effects, and variable interactions.
Sonobuoy Market Segment Analysis
By Type:
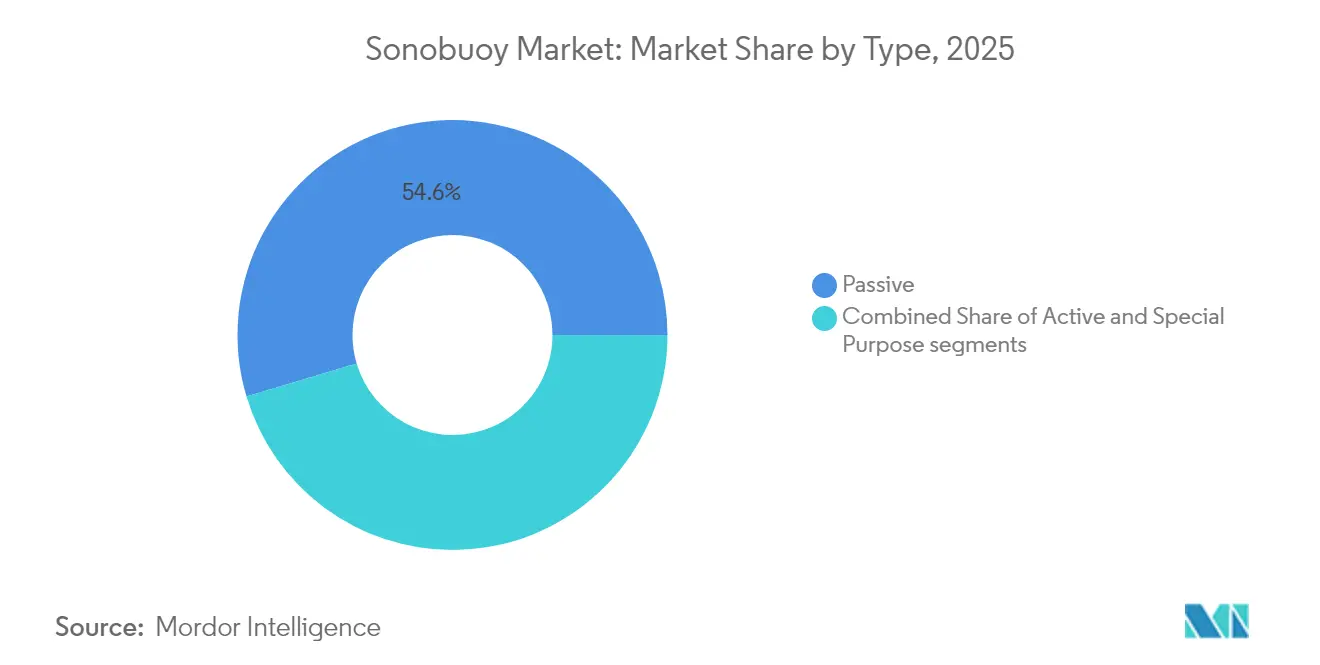
Active Sonobuoys Gain Momentum Amid Passive StrengthPassive devices held 54.62% of the sonobuoy market in 2025, underscoring their value for covert, low-power listening over long distances. Active variants, however, will outpace the aggregate sonobuoy market with a 12.00% CAGR through 2031. They are powered by multistatic low-frequency innovations that push detection horizons while controlling battery drain. Special-purpose models for bathymetry and range monitoring fill a niche but play a crucial role in battle-group readiness.
Digital processing lifts active effectiveness, as algorithms suppress reverberation and highlight transient contacts. The resulting performance leap keeps navies investing, making this slice a pivotal revenue accelerator across the wider sonobuoy market. Parallel civil use for seismic surveys enlarges addressable demand, reflecting growing cross-sector technology spillover within the sonobuoy industry.

By Size Class:
Shift Toward Compact Size B UnitsSize A forms remained dominant, accounting for 64.55% of the sonobuoy market in 2025, because legacy aircraft racks favor that diameter. Yet, Size B sales rose 13.02% CAGR as unmanned and light patrol planes seek lighter loads without acoustic compromise. Miniaturization advances preserve sensitivity while halving weight, aligning with broader defense trends toward distributed sensing.
SeaGuardian’s capacity to double the carriage count when switching to Size B makes a compelling case for inventory diversification. Manufacturers betting on small-form-factor lines now unlock new platform integration fees, reinforcing growth vectors in the sonobuoy market.
By Deployment Method:
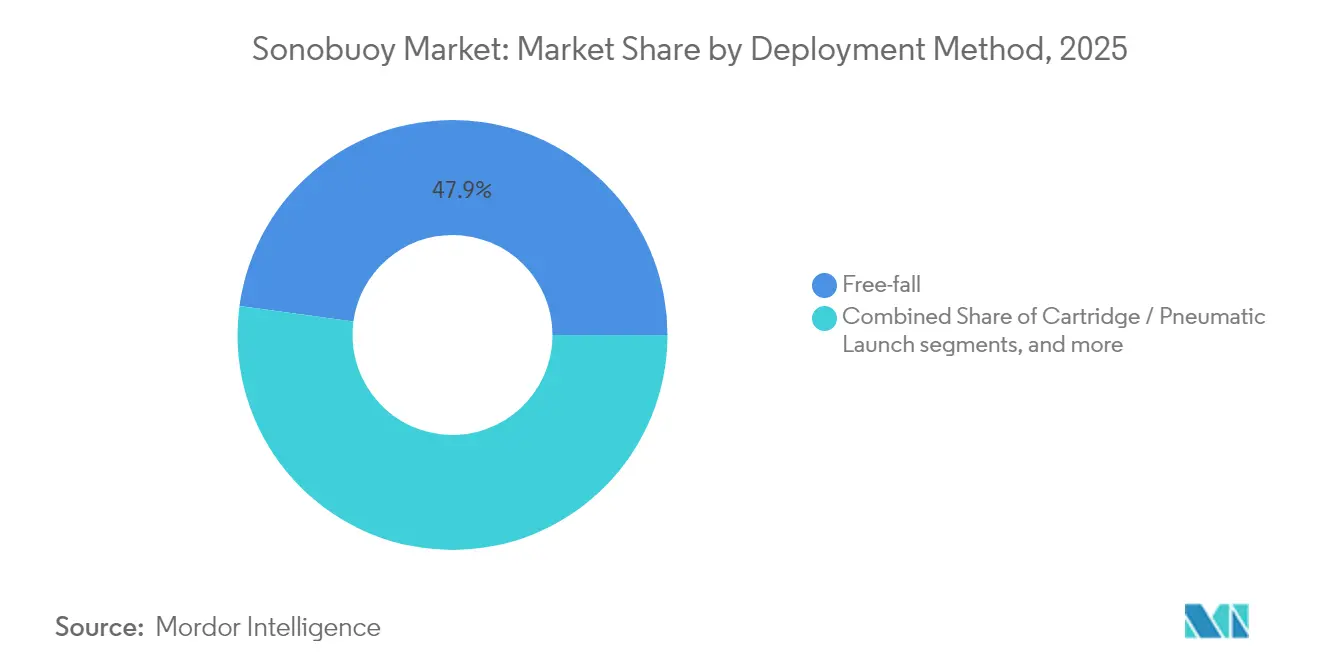
Pneumatic Launchers Broaden Tactical FlexibilityFree-fall delivery captured a 47.85% share in 2025 due to simple gravity racks requiring minimal aircraft plumbing. Cartridge or pneumatic launchers, however, draw a 10.31% CAGR outlook as they allow precision patterns and quieter drops, which are advantageous against submarine forces alert to splash signatures. Spring systems cater to niche covert drops where sound discipline trumps loading rates.
Pneumatic tubes also ease retrofit onto rotary drones and corvette decks, removing structural modifications that once limited host options. This engineering agility multiplies addressable airframes and hulls, stimulating fresh procurement across the sonobuoy market.
By Application:
Civil Energy Exploration Emerges as a High-Growth AdjunctDefense still accounts for 85.20% of the sonobuoy market size in 2025. Still, commercial users in oil, gas, wind, and marine research now post the fastest 14.35% CAGR as developers probe deeper fields and stricter environmental rules demand high-resolution acoustic baselines. Training and exercise allocations remain steady since realistic live-fire scenarios hinge on expendable acoustics.
Dual-use trajectories entice suppliers to tweak models for civil regulations, diversifying revenue streams, and shielding them from cyclic defense budgets. This structural broadening undergirds the sonobuoy market's long-term resilience.
Geography Analysis
North America Sonobuoy Market
North America commanded 41.85% of the sonobuoy market in 2025 due to sizable US Navy budgets, integrated manufacturing clusters, and a long history of experimentation with anti-submarine warfare. Annual buys of roughly 204,000 units set a volume floor that sustains local lines and accelerates R&D into digital and multistatic features. Canada’s NATO patrol commitments and Mexico’s offshore energy surveys add incremental pull, reinforcing the region’s leadership role. After ERAPSCO’s breakup, supply-risk worries pushed authorities to channel Defense Production Act funds toward redundancy. This measure should stabilize the North American share, leaving room for foreign advances.
APAC Sonobuoy Market
Asia-Pacific posts the fastest 11.47% CAGR through 2031 as submarine fleets expand and maritime boundary disputes intensify. India’s co-production pact with Ultra Maritime and Bharat Dynamics Limited illustrates policy support for localized build lines and allied interoperability. Japan embeds sonobuoy upgrades into its Medium-Term Defense Plan, while Australia studies sovereign manufacturing to cut shipping risk. The regional thirst for unmanned platforms also accelerates the adoption of compact buoys, widening the sonobuoy market pipeline.
Europe and APAC Sonobuoy Market
Europe grows steadily due to NATO standardization, higher Baltic patrol hours, and emerging Indo-Pacific deployments by France, Germany, and Italy. Paris awarded Thales a domestic SonoFlash contract to secure supply and hedge geopolitical uncertainty. Environmental compliance shapes procurement language, pressing suppliers to innovate quieter or shorter-duration devices. Cross-border exercises, such as Dynamic Manta, fuel routine replenishment orders, ensuring Europe remains an essential demand pillar within the sonobuoy market framework.
Regulatory Landscape
Regulation in the sonobuoy market is shaped by interoperability standards and constraints on underwater acoustic use. On the defense side, NATO standardization (including STANAG 1152 and related allied ASW doctrine) influences technical requirements, tactics, and coalition compatibility, which in turn affects how suppliers design waveforms, channels, and data links for multinational operations. In procurement-heavy geographies such as North America and Europe, this standardization push reinforces demand for digital and multistatic-capable buoys that can interface with fleet mission systems without bespoke integration.
Environmental compliance also affects training and operational use, particularly for active acoustics. In the United States, activities that may incidentally affect marine mammals are governed under the Marine Mammal Protection Act framework, with NOAA/Fisheries processes and Letters of Authorization (LOAs) linked to mitigation measures such as monitoring, shutdown zones, and geographic or seasonal restrictions near biologically important areas, which increases planning and compliance overhead for sonar-adjacent activities. Export-control regimes, notably ITAR for US-origin defense items, further add licensing and data-handling requirements that can delay deliveries to partner nations and strengthen the role of domestic-production clauses in recent contracts.
Value Chain Analysis
The sonobuoy value chain starts with specialized upstream materials and components (piezo-ceramics and acoustic transducers, batteries, RF links and antennas, digital signal-processing electronics, and mechanical housings), then moves into midstream manufacturing, calibration, and environmental qualification. Final assembly and test are typically handled by a small set of established defense suppliers and undersea-sensing specialists (including Ultra Maritime, Sparton, Thales, and partners such as BAE Systems in specific technology insertions). This is followed by packaging, logistics, and lifecycle support for storage, handling, and training consumption.
Downstream, demand is dominated by government customers and prime integrators that connect buoys to aircraft, helicopters, surface ships, and unmanned platforms through receivers, mission systems, and data-fusion software. Lockheed Martin operates as a combat-systems integrator across naval programs, coordinating partners and open-architecture integration. For procurement itself, frameworks such as the US Navy Production Sonobuoy Multiple Award Delivery Order Contract (MADOC) structure competition among multiple suppliers for delivery orders. Recent procurement patterns also point to a “build where you buy” approach: the UK and France have emphasized domestic manufacturing for Royal Navy and French Navy supply security, while India has moved toward local co-production with Ultra Maritime and Bharat Dynamics Limited, shifting parts of the value chain into in-country industrial bases and widening qualifying supplier footprints beyond traditional hubs.
Competitive Landscape
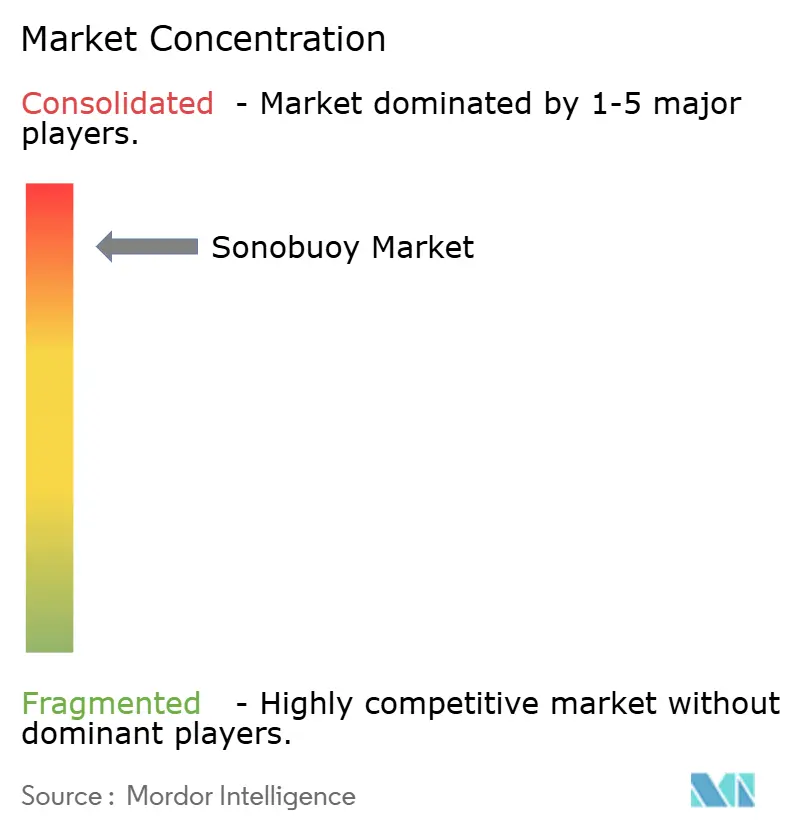
The sonobuoy market is highly concentrated: a handful of US and UK entities capture most defense volumes. The sunset triggers a strategic reshuffle. Ultra Maritime secured a USD 99 million AN/SSQ-53H award to affirm continuity, while Sparton outlines autonomous production plans to retain relevance. New entrants must hurdle tough qualification gates, yet government interest in diversified supply could ease timelines.
Technology differentiation becomes the main lever. Ultra and General Atomics align on small-form buoys tuned for SeaGuardian, chasing the edge in unmanned operations. Thales positions SonoFlash as a sovereign, dual-mode product for European navies and export customers. Suppliers eye civil exploration to smooth order cycles, positioning acoustic payloads as marine-survey tools that comply with eco-standards. These moves suggest the sonobuoy market will gradually migrate from a near-monopoly toward an oligopoly with distinct regional champions.
International joint ventures add a geopolitical layer. The India-US line links the Make-in-India policy with US technology safeguards, potentially inspiring similar tie-ups in Southeast Asia. Chinese and Russian efforts remain opaque but hint at indigenous development paths, indicating that strategic autonomy considerations may further fragment demand patterns across the global sonobuoy market.
Sonobuoy Industry Leaders
-
Thales Group
-
Lockheed Martin Corporation
-
General Dynamics Mission Systems (General Dynamics Corporation)
-
L3Harris Technologies, Inc.
-
Ultra Electronics Holdings Limited
- *Disclaimer: Major Players sorted in no particular order
Sonobuoy Market Companies Covered in this Report
- Sparton Corporation
- Ultra Electronics Holdings Limited
- L3Harris Technologies, Inc.
- Thales Group
- Lockheed Martin Corporation
- General Dynamics Mission Systems (General Dynamics Corporation)
- ASELSAN A.S.
- Kongsberg Gruppen ASA
- Leonardo S.p.A.
- SAAB AB
- Indra Sistemas, S.A.
- Bharat Electronics Limited
- Hanwha Systems (Hanwha Group)
Market Opportunities and Future Outlook
A clear opportunity area is faster configuration and refresh cycles through modular, open-architecture approaches. Industry discussion around “Open Buoy” style standards and modular sensor insertion reduces redesign burden and shortens the pathway for updating processing, encryption, and communications features. This aligns with the market shift from analog to digital architectures and the need for rapid software-driven updates, creating whitespace for suppliers that can deliver certifiable modular payloads, multi-channel processing, and interoperable receivers that integrate cleanly into existing mission systems and coalition workflows.
Uncrewed integration also supports new demand pockets and product differentiation, especially for compact buoy form factors and networking. General Atomics Aeronautical Systems and Ultra Maritime publicly aligned MQ-9B SeaGuardian operations with miniaturized sonobuoys and receivers, which reflects how persistent UAS patrol concepts are moving from platform availability toward payload integration. That transition pulls through requirements for lighter, smaller buoys and robust datalinks. At the same time, localized production and allied sourcing initiatives create partnership and industrialization opportunities: France has pursued sovereign SonoFlash supply for the French Navy, the UK Ministry of Defence has placed a major sonobuoy order for the Royal Navy, and India has advanced planning for US-specification sonobuoy co-production with Bharat Dynamics Limited and Ultra Maritime. These programs create room for qualified second-source manufacturing, local test and calibration capability, and in-country sustainment services, while environmental constraints under NOAA/MMPA frameworks encourage quieter designs, better monitoring tools, and mission planning aids that reduce operational friction for training and exercises.
Recent Industry Developments in Sonobuoy Market
- May 2026: Ultra Maritime was awarded a $12.6 million contract by the Office of Naval Research to develop an advanced sonar system for the UnderSea Advantage Block Upgrade (USABU) program, to be integrated into Sparton sonobuoy components. The award demonstrates direct engagement in the defense market for advanced sonobuoy components. The contract strengthens US Navy unmanned and undersea sensing capabilities and reinforces collaboration with Sparton and the US supply chain.
- April 2026: Ultra Maritime announced a U.S. Navy contract for Low Rate Initial Production of AN/SSQ-125B sonobuoys. The production award advances next-gen payloads for sovereign use. The arrangement tightens links to the US Navy procurement framework MADOC and strengthens domestic production cadence.
- February 2026: Ultra Maritime secured a 40 million GBP contract from the UK Ministry of Defence to deliver sonobuoys for the Royal Navy Merlin helicopter fleet. The procurement boosts UK sovereign supply and regional deployment for maritime patrols. The deal expands UK undersea surveillance capacity across allied platforms and signals ongoing collaboration with UK defense partners.
Sonobuoy Market Report Scope and Research Methodology
Market Definition and Coverage
The sonobuoy market covers revenue generated from sonobuoys used to detect, classify, and track underwater activity, along with related demand across defense and select commercial missions. We size the market in value terms (USD) across major producing and consuming regions.
Scope exclusions: We exclude aircraft, unmanned platforms, shipboard mission systems, and standalone sonar processors that are purchased separately from sonobuoy units.
Segments Covered in This Report
- By Type
- Active
- Passive
- Special Purpose
- By Size Class
- Size A
- Size B
- By Deployment Method
- Free-fall
- Cartridge/Pneumatic Launch
- Spring Launch Systems
- By Application
- Defense
- Anti-Submarine Warfare
- Training and Exercise
- Acoustic Range Monitoring
- Commercial
- Off-shore Energy Exploration
- Oceanographic Research
- Search and Rescue
- Defense
- By Geography
- North America
- United States
- Canada
- Mexico
- Europe
- United Kingdom
- France
- Germany
- Russia
- Rest of Europe
- Asia-Pacific
- China
- India
- Japan
- South Korea
- Rest of Asia-Pacific
- South America
- Brazil
- Argentina
- Rest of South America
- Middle East and Africa
- Middle East
- Saudi Arabia
- United Arab Emirates
- Rest of Middle East
- Africa
- South Africa
- Rest of Africa
- Middle East
- North America
Data Sources, Market Sizing, and Validation
Desk Research
Desk research was used to set the base demand context and to anchor assumptions that can be checked again later. We mainly relied on public defense budget documents and procurement releases (for example, from the US Department of Defense and allied defense ministries), plus US Navy and NAVAIR program updates that indicate ordering patterns and use cases.
We also referred to sources such as Stockholm International Peace Research Institute (SIPRI) defense spending series, UN Comtrade for trade signals where applicable, and technical publications and conference papers that explain sonobuoy types and performance drivers. Supplier annual reports, investor decks, and reputable defense press were used to understand production ramp-ups and pricing ranges, and then paid subscriptions covering company financials and shipment-level trade and contracts helped cross-check a few company and program indicators. These desk sources are illustrative rather than exhaustive, and many other public documents and references were used for data collection, validation, and clarification.
Primary Interviews and Surveys
Primary work focused on validating how procurement cycles translate into annual consumption, and where pricing differs by buoy type, delivery format, and contract structure. We spoke with a mix of program-level stakeholders, engineering and operations leaders, and commercial users to confirm demand timing, typical refresh and replacement rates, and what changes when inventories are rebuilt after higher activity.
Because demand is global, we checked inputs across key operating regions so regional mixes did not get overgeneralized. We then re-tested the assumptions against desk signals before finalizing the model.
Distribution of primary research fieldwork respondents
| Company type | Respondent position | Region |
|---|---|---|
| Top tier: 34% | CXOs: 15% | APAC: 41% |
| Mid tier: 51% | Functional/Unit leaders: 34% | EMEA: 37% |
| Smaller Players: 15% | Managers: 51% | Americas: 22% |
Market-Sizing & Forecasting
The core build uses top-down and bottom-up logic, where procurement and operating needs are translated into annual sonobuoy consumption pools by region and then converted to value using type-level pricing and mix. To keep totals grounded, we corroborated the results with selective bottom-up checks, such as sampling supplier disclosures, mapping visible procurement awards to implied volumes, and stress-testing average selling prices against the ranges discussed in interviews.
Inputs that shaped the model included anti-submarine warfare budget signals, the share of missions relying on airborne deployment, the mix shift across active, passive, and special-purpose buoys, and replacement or training expenditure rates that create recurring demand. Where program visibility was limited, gaps were handled by applying conservative usage ranges and then narrowing them based on expert feedback and consistency with regional spending and known ordering cycles.
For forecasting, we used scenario analysis tied to a small set of drivers that stakeholders could validate, including planned procurement cycles, regional security posture, and expected unit price movement as digital features expand. The forecast was accepted only after the implied volumes appeared feasible against production capacity signals, and year-to-year changes did not conflict with the procurement cadence discussed in interviews.
Data Validation & Update Cycle
Validation is done through triangulation across independent checks so one weak data point does not steer the final value. We compare model outputs against procurement signals, reported contract values, and implied volume trends, and then investigate any sharp jumps before internal sign-off.
A second analyst review is used to re-check formulas, unit conversions, and currency timing so totals stay consistent across regions and years. Reports are refreshed annually, and interim updates are made when material events occur, such as major multi-year awards or sudden shifts in defense spending. Before delivery, a fresh final pass is performed so clients receive the latest updated view.
Mordor Intelligence's Sonobuoy Market Size Measured Against Other Published Estimates
Published sonobuoy market numbers can vary even when they look similar at first glance, because scope and pricing assumptions are not always handled the same way. Some figures lean more on contract headlines, others emphasize unit consumption assumptions, and the refresh timing matters when procurement volumes shift.
Aircraft mission systems and the full anti-submarine warfare suite spending sit outside Mordor Intelligence's scope here, so estimates that bundle platforms, launch hardware, and processing equipment can land at higher totals even with similar growth rates. Differences also come from how active versus passive mix is treated, whether training and exercise consumption is counted fully, and whether currency conversion uses annual averages or point-in-time rates.
Benchmark comparison
| Source | Market Size | Gaps in Research Methodology |
|---|---|---|
| Mordor Intelligence | USD 482.54 M (2025) | |
| Global Consultancy A | USD 409.30 M (2023) | Uses an earlier base year and appears to apply a narrower demand pool tied mainly to defense recapitalization, which can undercount recurring training and replenishment demand in steady years. |
| Trade Publisher B | USD 346.00 M (2025) | Often reflects a manufacturer-shipments style view with slower ASP progression, and it can miss higher-value special-purpose buoys and configuration-driven pricing differences across contracts. |
The spread in the table mainly ties back to what is included in the spend bucket and how the unit price and mix are updated over time. By keeping sizing tied to repeatable demand drivers and then checking it against procurement signals and interview feedback, the final number stays transparent and easier to reconcile across regions and years.
Key Questions Answered in the Report
What is the current value of the Sonobuoy market?
The Sonobuoy market size is USD 512.23 million in 2026, with a projected CAGR of 6.15% through 2031.
Which region leads global demand for sonobuoys?
North America holds 41.85% of global revenue, supported by large US Navy procurement volumes and established production infrastructure.
Why are active sonobuoys gaining traction?
Active units benefit from multistatic low-frequency concepts and improved digital processing, enabling longer-range detection of new quiet submarines and driving an 12.00% CAGR.
How are unmanned platforms influencing the Sonobuoy market?
Uncrewed aircraft and surface vessels carry more buoys for longer periods, expanding coverage at lower cost and widening the customer base beyond traditional patrol aircraft.
What challenges could slow market growth?
High supplier concentration, export-control limits, and stricter acoustic-emission regulations introduce procurement delays and compliance costs that offset some demand momentum.
Which civil sectors are adopting sonobuoy technology?
Deep-water oil, gas, and offshore wind projects deploy buoys for seabed mapping and environmental monitoring, propelling a 14.35% CAGR in commercial applications.