
Market Overview
| Study Period | 2021 - 2031 |
|---|---|
| Market Size (2026) | USD 2.68 Billion |
| Market Size (2031) | USD 3.85 Billion |
| Growth Rate (2026 - 2031) | 7.55 % |
| Fastest Growing Market | Middle East and Africa |
| Largest Market | Asia Pacific |
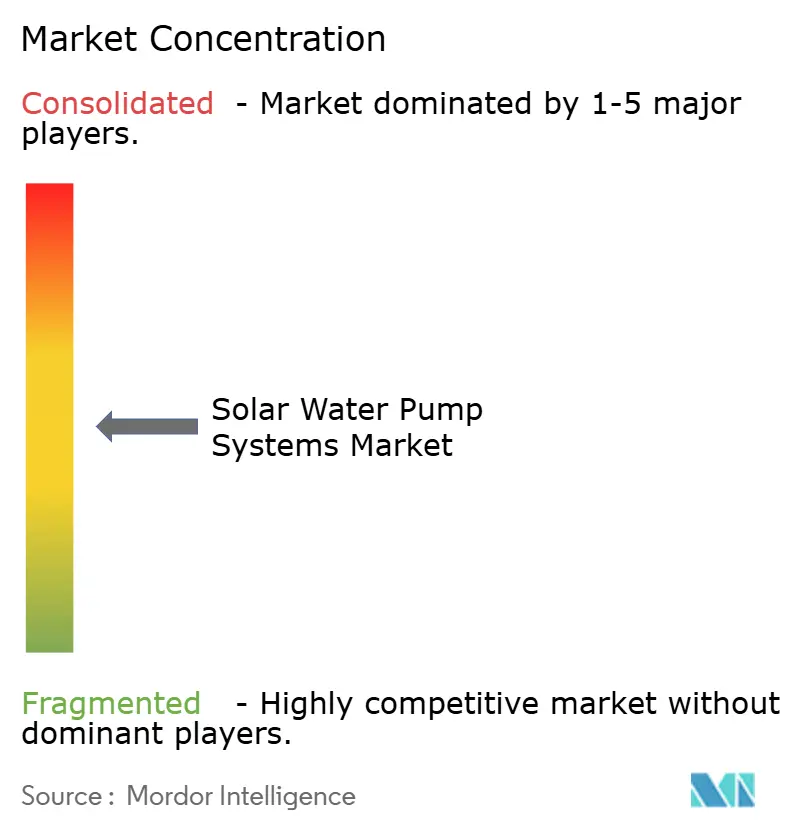
| Market Concentration | Medium |
Major Players *Disclaimer: Major Players sorted in no particular order Image © Mordor Intelligence. Reuse requires attribution under CC BY 4.0. | |
Solar Water Pump Systems Market Analysis by Mordor Intelligence
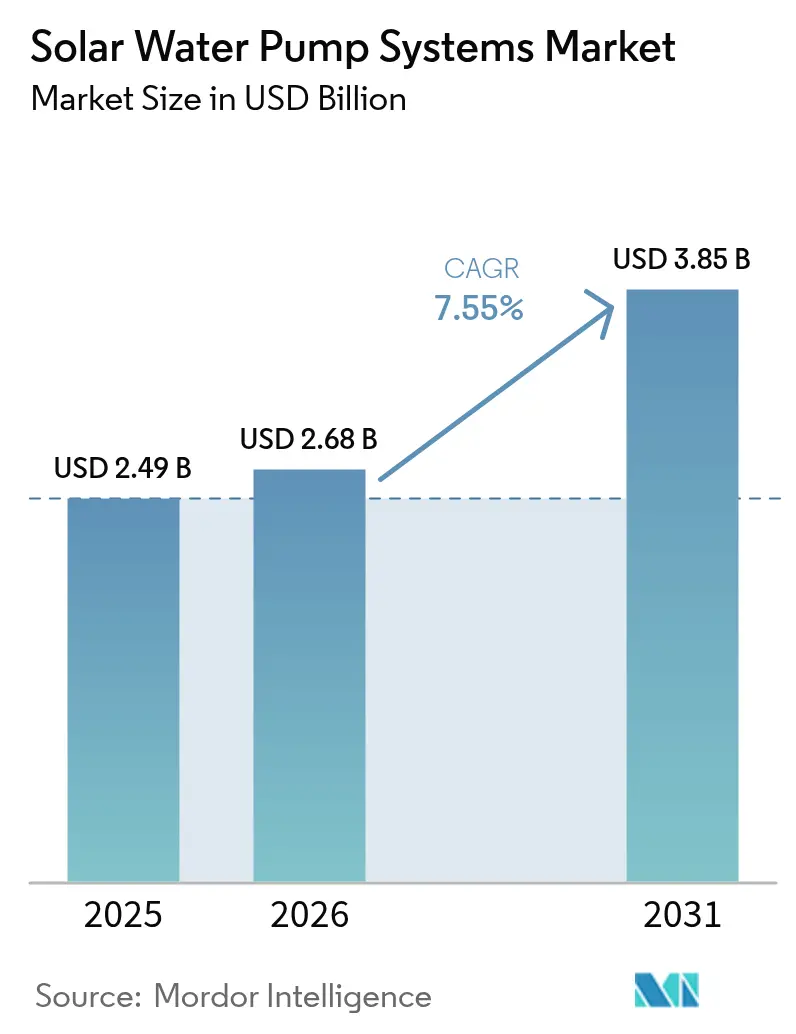
Solar Water Pump Systems market size in 2026 is estimated at USD 2.68 billion, growing from 2025 value of USD 2.49 billion with 2031 projections showing USD 3.85 billion, growing at 7.55% CAGR over 2026-2031.
Robust public-sector subsidies, an 85% fall in photovoltaic (PV) module prices since 2010, and widening irrigation deficits in water-stressed farming belts are lifting sales momentum. Surface pumps still dominate the installed base volumes, yet submersible variants are outpacing the overall solar water pump systems market, thanks to rising groundwater extraction needs and brushless DC motor upgrades that reduce maintenance downtime. Mid-range 3-10 kW units are scaling fast as commercial growers demand higher-capacity kits, while DC drives retain a cost edge in off-grid settings. Parallel digitization—encompassing satellite telemetry, IoT sensors, and predictive maintenance—now differentiates suppliers and enables utilities to monitor performance in remote communities. Investor confidence in pay-as-you-go (PAYG) leasing models is widening access for smallholders across Sub-Saharan Africa, easing the persistent up-front CAPEX hurdle.
Key Report Takeaways
- By pump type, surface pumps led with a 47.90% revenue share in 2025; submersible pumps are expected to expand at a 9.25% CAGR through 2031.
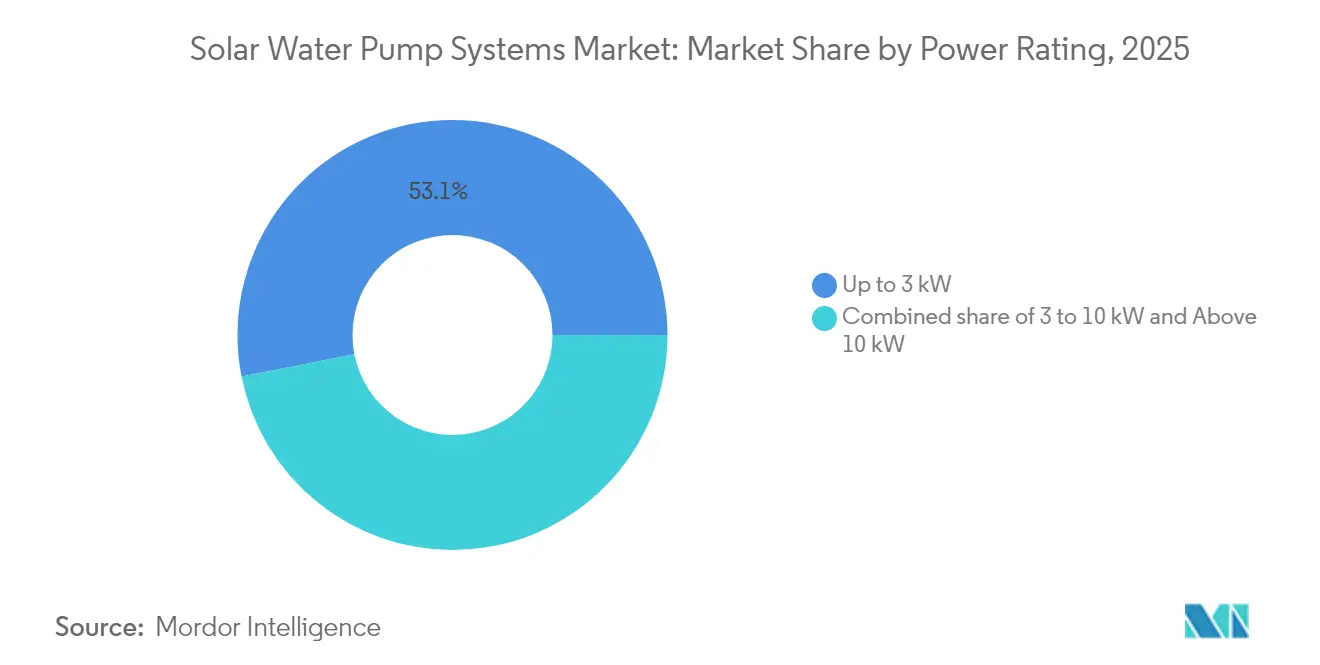
- By power rating, units with a capacity of up to 3 kW accounted for 53.10% of the solar water pump systems market share in 2025, while systems with a capacity of 3-10 kW posted the fastest 9.75% CAGR through 2031.
- By drive type, DC technology captured a 59.40% share of the solar water pump systems market size in 2025, and hybrid AC/DC drives are projected to rise at an 8.05% CAGR through 2031.
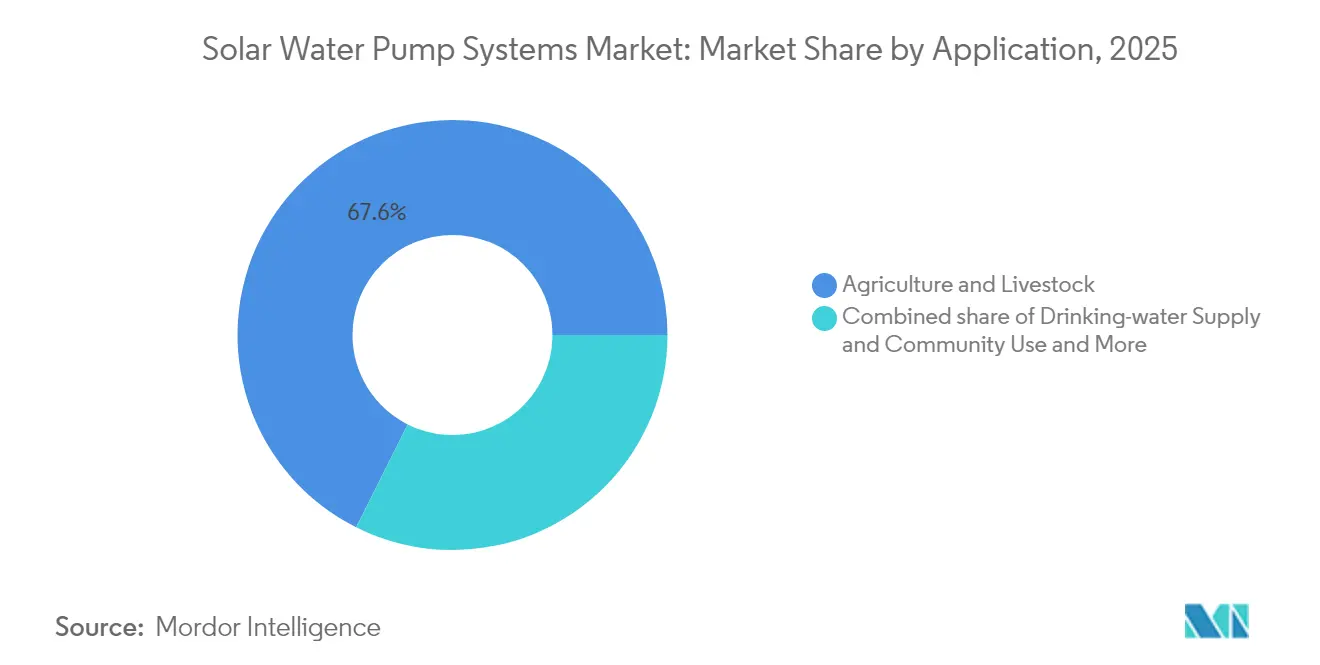
- By application, agriculture and livestock held a 67.60% share of the solar water pump systems market size in 2025; the drinking-water supply segment is projected to show an 8.55% CAGR between 2026 and 2031.
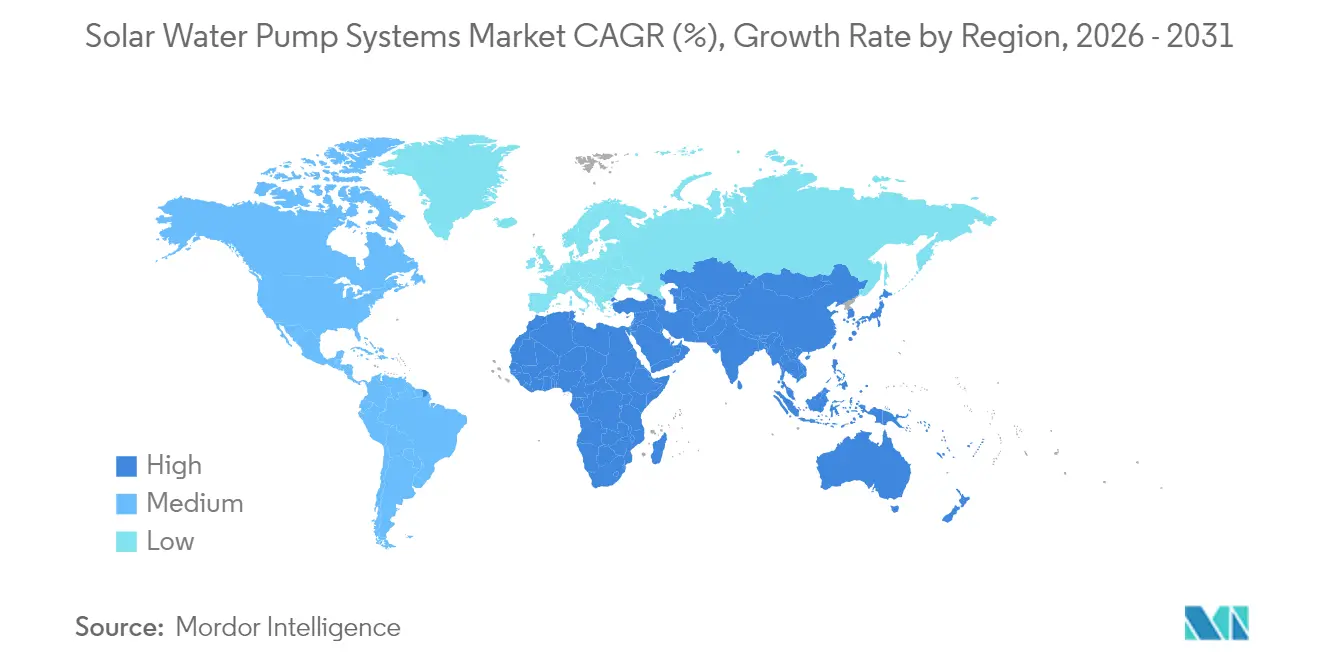
- By geography, the Asia-Pacific region commanded 63.10% of 2025 revenue, while the Middle East & Africa posted the fastest growth rate of 10.10% through 2031.
Note: Market size and forecast figures in this report are generated using Mordor Intelligence’s proprietary estimation framework, updated with the latest available data and insights as of 2026.
Market Trends and Insights
Drivers Impact Analysis of Solar Water Pump Systems Market*
| Driver | (~) % Impact on CAGR Forecast | Geographic Relevance | Impact Timeline |
|---|---|---|---|
| Declining PV module prices | 2.50% | APAC, MEA | Medium term (2-4 years) |
| Government subsidies & rural-electrification schemes | 1.80% | APAC, MEA, South America | Long term (≥ 4 years) |
| Agricultural water-demand surge & shift to micro-irrigation | 1.20% | Water-stressed regions | Long term (≥ 4 years) |
| IoT-enabled remote monitoring & predictive maintenance | 0.90% | North America, EU, APAC | Medium term (2-4 years) |
| PAYG micro-financing models in SSA | 0.70% | Sub-Saharan Africa | Short term (≤ 2 years) |
| Hybrid AC/DC controller retrofits for legacy pumps | 0.60% | Developed markets | Medium term (2-4 years) |
| Source: Mordor Intelligence | |||
Declining PV Module Prices
PV module costs fell a further 12% in 2024, extending an 85% decline since 2010, as Chinese overcapacity and TOPCon cell efficiencies reached 23.1%(1)Source: Taiyang News, “Saatvik Solar’s ‘Made-In-India’ Product Offerings at REI 2024,” taiyangnews.info . Payback periods have tightened below two years in high-irradiance belts, pushing diesel pump retirements. Bifacial modules capture reflected light from water bodies, trimming array footprints and freeing farm land. Suppliers now prioritise durability—such as dual-glass laminates and anti-soiling coatings—over raw cost cuts, supporting lifetime energy yield gains.
Government Subsidies & Rural-Electrification Schemes
India’s PM-KUSUM Component-B supports 2 million standalone pumps with a 90% subsidy, reducing farm outlays to just 10% of the list price. Morocco’s NOOR and Egypt’s 250 MW irrigation corridors replicate blended-finance templates, combining upfront capital grants with skills training to curb post-installation failure rates. Fiscal prudence is vital; schemes that bundle technical support with subsidies avoid market distortions and keep private distributors engaged.
Agricultural Water-Demand Surge and Shift to Micro-Irrigation
Global farm water use is projected to increase by 15% by 2030, with drip systems replacing flood irrigation in the Kandi Belt and other semi-arid regions. Jain Irrigation’s AgroVoltaic pilots reveal conveyance efficiencies above 90% when solar pumps feed sensor-based drip lines(2)Source: The Energy and Resources Institute, “Learnings from Integrating Solar in Agriculture,” teriin.org . Soil-moisture probes, coupled with weather data, cut water draw by 28% without yield loss, which is critical as water tables drop 0.3-4 m annually across the Indo-Gangetic plains.
IoT-Enabled Remote Monitoring & Predictive Maintenance
Satellite narrowband links transmit pump vibration, flow, and irradiance files every 15 minutes, flagging anomalies before failure(3)Source: Grundfos, “Remote Monitoring Solar Water Pumps,” grundfos.com . Predictive algorithms reduce unplanned downtime by 40% and enable distributors to stock spares strategically. Field data is integrated into controller firmware updates that fine-tune duty cycles for local solar curves, increasing daily water yield by 6-9% on legacy arrays.
Restraints Impact Analysis of Solar Water Pump Systems Market*
| Restraint | (~) % Impact on CAGR Forecast | Geographic Relevance | Impact Timeline |
|---|---|---|---|
| High upfront CAPEX despite falling PV costs | -1.1% | Global, particularly acute in low-income regions | Short term (≤ 2 years) |
| Intermittent solar irradiance leading to output variability | -0.8% | Global, with regional variations in impact severity | Medium term (2-4 years) |
| Limited end-user awareness & O&M skill gaps | -0.6% | APAC and MEA, concentrated in rural areas | Medium term (2-4 years) |
| Emerging groundwater-extraction caps in water-stressed regions | -0.4% | Global, with focus on India, California, Australia | Long term (≥ 4 years) |
| Source: Mordor Intelligence | |||
High Upfront CAPEX Despite Falling PV Costs
Complete systems span USD 2,100-5,000 per hectare, equivalent to two-plus years of smallholder cash income in the Philippines, even when the ROI exceeds 315%(4)Source: ResearchGate, “Promoting Sustainable Agriculture Using Solar Irrigation,” researchgate.net . Controllers, structures, and labour now account for 60-70% of the project cost, mitigating further PV price gains. PAYG leases and equipment-as-a-service lift adoption yet strain provider working capital and demand robust collection tech.
Intermittent Solar Irradiance Leading to Output Variability
Cloud cover can reduce daily pumping capacity by 30-50% during the monsoon or winter months. Battery buffers add 40-60% cost and maintenance. Hybrid AC/DC units automatically switch to the grid where available, but weak rural lines limit their scope. World Bank modelling cautions that cheap pumping may encourage expansion into thirstier crops, offsetting CO₂ gains if governance fails(5)Source: World Bank, “Navigating the Opportunities and Risks of Solar Irrigation,” worldbank.org .
*Our forecasts treat driver/restraint impacts as directional, not additive. The impact forecasts reflect baseline growth, mix effects, and variable interactions.
Solar Water Pump Systems Market Segment Analysis
By Pump Type:
Submersible Systems Expand ReachSales of submersible units increased to 41.60% of 2025 shipments, while surface pumps maintained a 47.90% revenue lead. The segment’s 9.25% CAGR stems from deeper borehole drilling as surface water variability rises. Brushless DC motors and corrosion-resistant alloys simplify maintenance, while variable-frequency drives modulate speed to accommodate fluctuating irradiance, enhancing efficiency in the solar water pump systems market. In community schemes, low-flow positive-displacement pumps deliver steady head pressure, ideal for elevated storage tanks and day-night dispensing.
Embedded telemetry enables utilities to stagger pump starts, thereby flattening village load peaks. Suppliers bundle training so operators swap down-hole cartridges with basic tools, trimming service calls. Consistent flow also supports small aquaculture ponds, which diversify farmer income without requiring extra diesel consumption. With groundwater depth often exceeding 80 m in semi-arid APAC, submersibles prevail where suction limits hobble surface pumps.
By Power Rating:
Mid-Range Systems Drive Commercial UptakeUnits of up to 3 kW dominate smallholder plots, yet the 3-10 kW slice registers the fastest 9.75% CAGR as cooperatives irrigate blocks of 8-20 ha. Declining per-kilowatt costs above 5 kW encourage growers to oversize arrays for morning and late-afternoon pumping windows, smoothing labour schedules in the solar water pump systems market. Modular designs allow owners to start with 5 kW and then add extra string inverters as acreage scales, avoiding stranded assets.
Industrial orchards and floriculture estates are piloting sets exceeding 10 kW to lift water from aquifers at depths of 150-200 m. Grid interconnection and protection relays inflate paperwork, but tariffs offset night-time top-ups when climate sensors trigger frost mitigation irrigation. Development banks in MEA now bundle concessional credit for 8-12 kW kits that serve shared pasture boreholes, cutting diesel haulage cost spikes after rainy-season road washouts.


By Drive Type:
DC Retains Lead, Hybrids Gain GroundDirect-current drives own 59.40% of 2025 revenue by bypassing inverters and associated losses, keeping the bill of materials lean for off-grid buyers. Fault diagnosis is simpler, with fewer electronic stages exposed to heat cycling. Yet grid-adjacent dairies favour hybrid controllers that toggle to AC during cloudbursts, keeping trough levels stable without the need for battery packs. Firmware updates enable remote parameter adjustments, such as increasing float switch thresholds in drought alerts.
Regulatory shifts in the EU impose power-quality limits on direct grid-tied systems, prompting installers to consider transformer-isolated hybrids. Commercial lenders also view bi-directional capability as collateral against output volatility, thereby increasing the odds of loan approval. The resulting traction tightens the supplier race to optimise MPPT algorithms for both PV and grid modes, fostering innovation in the solar water pump systems market.
By Application:
Drinking-Water Supply AcceleratesAgriculture and livestock still absorb 67.60% of 2025 shipments, but community drinking-water systems grew 8.55% CAGR on donor funding and NGO roll-outs. Zero-fuel pumps reduce operational leakage, allowing village committees to redirect tariffs to filter cartridges and improve well sanitation. Remote sensors alert technicians to the risk of dry-running, extending pump life. Health clinics now integrate small solar pumps with rooftop PV and UV purification, cutting disease incidents tied to stagnant hand-dug wells.
Industrial dewatering at quarries and tunnels remains a niche yet lucrative market. Predictable duty cycles align with solar curves, and telemetry eliminates the need for daily site visits. Environmental regulators are increasingly mandating a diesel phase-out, positioning solar pumps as compliance tools that halve CO2 footprints compared to gensets in the solar water pump systems market.
Geography Analysis
APAC Solar Water Pump Systems Market
Asia-Pacific generated 63.10% of 2025 revenue, underpinned by India’s target for 3 million pumps by 2026 and China’s integrated PV-pump packages that slash deployment times. State utilities in Maharashtra co-finance 3-7.5 HP submersibles, removing 90% of farmer CAPEX and fuelling bulk tender momentum. Concerns rise around groundwater overdraft, spurring pilots that pair metered pumps with prepaid smart cards to ration extraction sustainably.
MEA Solar Water Pump Systems Market
The Middle East & Africa contributes a modest base today, yet logs the swiftest 10.10% CAGR to 2031. Morocco’s NOOR irrigation loans and AfDB lines of credit unlock 2-5 kW PAYG pumps for cereal growers, while Kenya’s distributors bundle mobile-money repayment plans that match harvest cashflows. Intense irradiance and erratic diesel supply chains accentuate the comparative advantage of the solar water pump systems market in this region. Capacity-building grants train local technicians, improving first-year service call resolution rates from 54% to 82%
North America and Europe Solar Water Pump Systems Market
North America and Europe mature steadily as they retrofit diesel backup wells and pursue net-zero farm mandates. California’s SGMA groundwater rules and EU nitrate directives pressure growers to couple smart irrigation with solar pumping, thereby tightening accountability for the water–energy nexus. OEMs headquartered in these regions pilot satellite-linked asset clouds that fuse pump, soil, and weather analytics, exporting software licences to APAC dealers after market validation.

Regulatory Landscape
Policy support and compliance requirements heavily influence procurement for solar water pump systems, especially in Asia-Pacific where subsidized tenders dominate volumes. In India, the Ministry of New and Renewable Energy (MNRE) administers PM-KUSUM, with Component-B focused on standalone solar agricultural pumps; the program framework has included time-bound implementation milestones, including an extension of the scheme deadline to March 31, 2026 as communicated through official government channels.
Technical eligibility for subsidy-linked projects is anchored in standardized performance and quality testing. IEC 62253:2011 provides a recognized reference for design qualification and performance measurement of stand-alone photovoltaic pumping systems, and MNRE-linked specifications require testing and certification through authorized test centers against prescribed discharge and performance norms. State-level agencies operationalize the program through annual guidelines and allocation notices, such as Haryana's implementation guidelines for FY 2025-26 and its Phase-II allocation process under PM-KUSUM Component-B, which shape tender participation, documentation, and equipment configuration requirements.
Competitive Landscape
Competitive intensity is high, with no firm exceeding a 10% share, indicating a fragmented structure. Legacy pump majors—Grundfos, Xylem, and KSB—leverage their supply chains, while specialists such as Lorentz or Shakti Pumps pitch end-to-end solar kits. Strategic alliances dominate consolidation efforts; Xylem’s December 2024 majority stake in Idrica marries hydraulic hardware with digital analytics to deliver utility-scale smart-water suites. Grundfos partners with satellite IoT provider Myriota to embed nanoband links in controllers, providing distributors with data-driven service contracts and securing aftermarket revenue.
Regional OEMs deepen vertical integration. Saatvik Green Energy pivoted from module manufacturing to bundled pump sales after clinching a 250-unit tender in Maharashtra in February 2025. Shakti Pumps secured India’s largest single-state order for 12,537 units under PM-KUSUM, demonstrating its scale capability and narrowing the cost gap with multinational brands. IoT and hybrid-drive engineering remain key battlegrounds as clients demand continuous uptime and grid compatibility.
White-space opportunities sit in integrated storage, where lithium-iron-phosphate packs smooth evening loads for dairy and community taps. Entry barriers rise because certification, fire safety, and thermal management skills differ from those required for pump hydraulics. Firms that master both domains can prise premium margins in the solar water pump systems market.
Solar Water Pump Systems Industry Leaders
Shakti Pumps (India) Limited
Kirloskar Brothers Ltd.
Xylem Inc.
Grundfos Holding A/S
LORENTZ GmbH
- *Disclaimer: Major Players sorted in no particular order
Solar Water Pump Systems Market Companies Covered in this Report
- Advanced Power Inc.
- Bright Solar Ltd.
- C.R.I. Pumps Pvt. Ltd.
- Kirloskar Brothers Ltd.
- KSB SE & Co. KGaA
- LORENTZ GmbH
- Shakti Pumps (India) Ltd.
- Tata Power Solar Systems Ltd.
- Grundfos Holding A/S
- Xylem Inc.
- Franklin Electric Co. Inc.
- Jain Irrigation Systems Ltd.
- Solartech Renewable Energy Co.
- Dankoff Solar Pumps
- SunPumps Inc.
- Waaree Energies Ltd.
- Apex Pumps
- Mono Pumps (NOV)
- DAB Pumps SpA
- Wilo SE

Market Opportunities and Future Outlook
State procurement cadences continue to define deployment routes, with Haryana's Phase-II FY 2025-26 allocations under PM-KUSUM Component-B creating defined tender pipelines for solar pumping systems and related equipment. OEMs and system integrators that can supply certified, tender-compliant kits and deliver installation quality control and after-sales service in remote farming belts will be positioned to participate, supported by ongoing state implementation guidelines and allocation notices. In addition, the PM-KUSUM Component-B program remains a key channel for stand-alone solar water pumping deployments in multiple states, reinforcing the base for domestic manufacturing and local deployment capabilities.
Recent Industry Developments in Solar Water Pump Systems Market
- July 2026: Shakti Pumps (India) Limited announced a collaboration with Salesforce to implement Agentforce and related AI-led digital tools across operations, including solar pump business lines. The move strengthens lead-to-service workflows and field-service responsiveness, supporting scale execution for large state tenders and dispersed rural service networks.
- January 2026: Shakti Pumps (India) Limited received a work order from Karnataka Renewable Energy Development Limited for 16,780 solar photovoltaic water pumping systems under PM-KUSUM Component-B, valued at INR 654.03 crore. The order expands the company's footprint into Karnataka and reinforces competitive positioning in high-volume, subsidy-linked procurement.
- December 2025: Shakti Pumps (India) Limited received a work order from Madhya Pradesh Urja Vikas Nigam Limited for 2,033 stand-alone off-grid DC solar photovoltaic water pumping systems under PM-KUSUM Component-B, valued at INR 71.25 crore. The contract adds backlog for DC-focused off-grid configurations, supporting utilization of domestic manufacturing and installation capacity tied to state program rollouts.


Solar Water Pump Systems Market Report Scope and Research Methodology
Market Definition and Coverage
For this study, the solar water pump systems market covers revenue generated from solar-powered pumping solutions used to lift or move water for irrigation, community water supply, and industrial water movement. This includes the pump unit, solar modules, controller, and standard system integration.
Scope exclusions: We exclude off-grid diesel and grid-only pump systems, plus major civil works (such as borewell drilling and large-scale piping) that sit outside the pump system sale.
Segments Covered in This Report
- By Pump Type
- Surface (DC, AC/DC hybrid)
- Submersible (DC, AC/DC hybrid)
- Helical/Positive-displacement
- By Power Rating
- Up to 3 kW
- 3 to 10 kW
- Above 10 kW
- By Drive Type
- DC
- AC/DC Hybrid
- By Application
- Agriculture and Livestock
- Drinking-water Supply and Community Use
- Industrial and Mining Dewatering
- By Geography
- North America
- United States
- Canada
- Mexico
- Europe
- Germany
- United Kingdom
- France
- Italy
- NORDIC Countries
- Russia
- Rest of Europe
- Asia-Pacific
- China
- India
- Japan
- South Korea
- ASEAN Countries
- Rest of Asia-Pacific
- South America
- Brazil
- Argentina
- Rest of South America
- Middle East and Africa
- Saudi Arabia
- United Arab Emirates
- South Africa
- Egypt
- Rest of Middle East and Africa
- North America
Data Sources, Market Sizing, and Validation
Desk Research
Desk research is used to build the fact base that anchors volumes and pricing in each region before the model is finalized through field checks. We relied on public sources such as IRENA publications, World Bank datasets on agriculture and water access, FAO irrigation statistics, and UN Comtrade trade flows for pumps and solar components, which together help map likely demand pools.
We also reviewed policy and program information from national renewable-energy ministries and energy agencies, alongside customs notices, tariff schedules, and standards notes that affect import mixes and system design. Company annual reports, investor decks, and reputable press were used to understand product positioning, channel patterns, and reported order trends. A paid subscription for company financials and for import and export shipment-level signals was used selectively to cross-check directionally. These desk sources are not exhaustive, and other public references were also used for data collection, validation, and clarification.
Primary Interviews and Surveys
Primary work focused on validating what is actually being installed and paid for across agriculture-led demand, drinking-water projects, and industrial water movement. We spoke with a mix of manufacturers, distributors, and EPC-type installers, along with procurement-side stakeholders and program-linked experts across APAC, EMEA, and the Americas, to close gaps on typical system sizing, bundle content, channel margins, and recent pricing behavior.
Distribution of primary research fieldwork respondents
| Company type | Respondent position | Region |
|---|---|---|
| Top tier: 39% | CXOs: 14% | APAC: 38% |
| Mid tier: 47% | Functional/Unit leaders: 26% | EMEA: 35% |
| Smaller Players: 14% | Managers: 60% | Americas: 27% |
Market-Sizing & Forecasting
The market size is constructed using a top-down approach where country demand is rebuilt from irrigated-area needs, off-grid electrification gaps, solar pump program rollouts, and typical pump sizing ranges that link to flow and head requirements. Once that demand pool is set, it is converted into annual system shipments, then valued using region-specific average selling prices that reflect the common bundle (pump, controller, and solar array). These regional totals are summed to global figures.
To keep the totals realistic, we corroborate the model with selective bottom-up approximations, such as sampling supplier and distributor revenue ranges, checking channel inventory movement, and using a simple ASP times volume sense-check for key countries. Inputs that matter in this market include diesel price movements versus solar economics, subsidy intensity and procurement calendar timing, groundwater depth trends that tilt demand toward submersible systems, the split of DC versus hybrid drive systems by use case, and solar module price direction that influences bundle pricing. Forecasting relies mainly on scenario analysis supported by trend smoothing, where adoption is flexed under different policy continuity and farm investment assumptions. The forward curve is then reviewed with expert consensus so it remains practical. Where coverage gaps exist for smaller countries, proxy ratios are applied from comparable markets and adjusted using import patterns and program activity so the estimate stays traceable.
Data Validation & Update Cycle
Outputs are checked against independent signals, including trade flows, policy-led installation targets, and price movement indicators that should show up in the model if the sizing is directionally correct. When unusual jumps appear, assumptions are rechecked at the country level, and follow-up calls are triggered to confirm whether the change is a one-time tender spike, a currency effect, or a true demand shift.
Before sign-off, the dataset and calculations pass through more than one analyst review so formula and logic errors are removed and assumptions remain consistent across regions. The report is refreshed annually, and interim updates are made when material events occur, such as major subsidy rule changes or abrupt solar component price moves. Right before delivery, a fresh verification pass is completed so the numbers reflect the latest available inputs.
Mordor Intelligence's Solar Water Pump Systems Market Size Versus Other Published Estimates
Published market sizes for solar water pump systems can vary widely, even when the topic sounds the same, because each publisher draws the line differently on what is counted and how pricing is timed. The differences usually come from scope boundaries, currency conversion choices, and whether pricing is treated as a stable average or recalibrated as component costs and subsidy structures shift.
A refresh-led gap is common in this market because module and controller pricing can change faster than pump unit pricing, and public programs can pull demand forward into specific quarters, which changes the realized ASP for that year. When currency conversion is locked at a single point in time, or when the system bundle is treated as only the pump hardware without the typical solar and controller package, totals can move materially up or down. In the workflow used for this study, quarterly currency timing and recent ASP checks are revisited during updates, and that is a key reason the published 2026 value from Mordor Intelligence can sit apart from figures built on older price points or broader bundle assumptions.
Benchmark comparison
| Source | Market Size | Gaps in Research Methodology |
|---|---|---|
| Mordor Intelligence | USD 2.68 B (2026) | |
| Global Business Publisher A | USD 1.87 B (2025) | Uses a factory-gate framing and a different base year, and the value can understate markets where EPC-style system bundling and program-led pricing are common in end-customer spend. |
| Industry Research Publisher B | USD 3.04 B (2024) | Uses an earlier base year with a longer horizon and may embed broader category coverage and pricing assumptions that do not get reset as frequently to reflect recent component-driven ASP shifts and currency timing. |
The spread in the table is mainly explained by timing and what is treated as part of the system sale, which then flows through to ASP and the year chosen for conversion into USD. By keeping the demand pool tied to irrigation and water-supply indicators, and then validating pricing and bundle content through repeated checks, the estimate stays easier to reconcile back to clear drivers and repeatable steps.


Key Questions Answered in the Report
What is the current size of the solar water pump systems market?
The solar water pump systems market size reached USD 2.68 billion in 2026 and is forecast at USD 3.85 billion by 2031.
Which region leads global demand?
Asia-Pacific accounts for 63.10% of 2025 revenue, driven chiefly by India’s PM-KUSUM program.
What pump type is growing fastest?
Submersible units post the quickest 9.25% CAGR through 2031 as farmers tap deeper aquifers.
How are financing barriers being addressed?
Pay-as-you-go leasing and 90% capital subsidies under schemes like PM-KUSUM lower up-front costs for smallholders.
Which technological trend is differentiating suppliers?
IoT-enabled remote monitoring combined with predictive maintenance is emerging as a key competitive edge.
Why is MEA showing the highest growth rate?
Acute water scarcity, strong solar irradiance, and multilateral development financing propel a 10.10% CAGR in the region.
Page last updated on:


 Your data is secure and never sold or shared.


