
Market Overview
| Study Period | 2021 - 2031 |
|---|---|
| Market Size (2026) | USD 15.24 Billion |
| Market Size (2031) | USD 21.16 Billion |
| Growth Rate (2026 - 2031) | 6.79 % |
| Fastest Growing Market | Middle East and Africa |
| Largest Market | Asia Pacific |
| Market Concentration | Medium |
Major Players *Disclaimer: Major Players sorted in no particular order Image © Mordor Intelligence. Reuse requires attribution under CC BY 4.0. | |
Solar PV Inverters Market Analysis by Mordor Intelligence
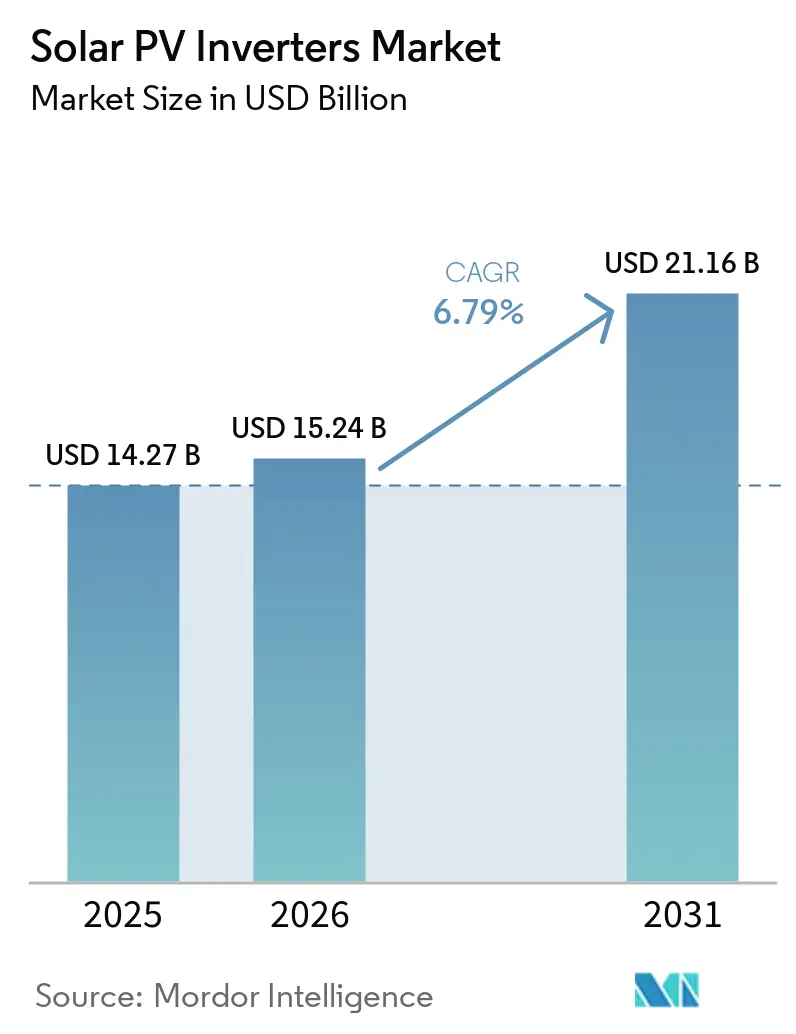
The Solar PV Inverters market size is expected to grow from USD 14.27 billion in 2025 to USD 15.24 billion in 2026 and is forecast to reach USD 21.16 billion by 2031 at 6.79% CAGR over 2026-2031.
The market’s expansion is underpinned by a move from simple DC-to-AC conversion toward smart, grid-forming solutions that safeguard power quality and unlock new revenue streams for owners. Asia-Pacific anchors global demand, yet the Middle East is now the fastest-growing territory as large utility projects intersect with grid-modernization agendas. Robust replacement cycles in Japan, rooftop mandates in India, and higher-voltage designs across the United States and Europe amplify near-term unit volumes, while persistent SiC/IGBT shortages and rising curtailment in China temper the pace of expansion. Despite those headwinds, premium pricing for advanced grid-support functions keeps aggregate revenue upward in the solar PV inverter market [1].
Key Report Takeaways
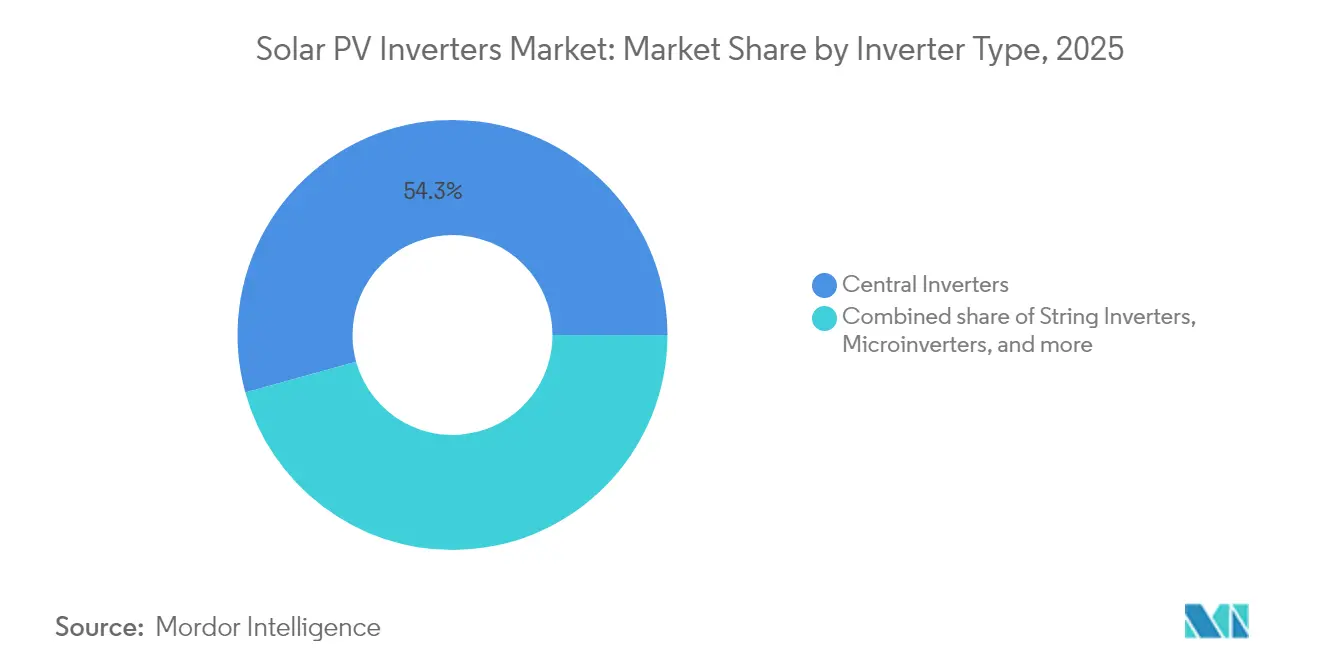
- By inverter type, central systems commanded 54.30% revenue share in 2025, while microinverters are projected to register the fastest 7.96% CAGR by 2031.
- By application, utility-scale installations accounted for 62.25% of the solar PV inverter market size in 2025, while residential is set to grow at a 7.45% CAGR through 2031.
- By phase, three-phase units led with 71.20% of the solar PV inverter market share in 2025; Single-phase is forecasted to post a 7.05% CAGR between 2026 and 2031.
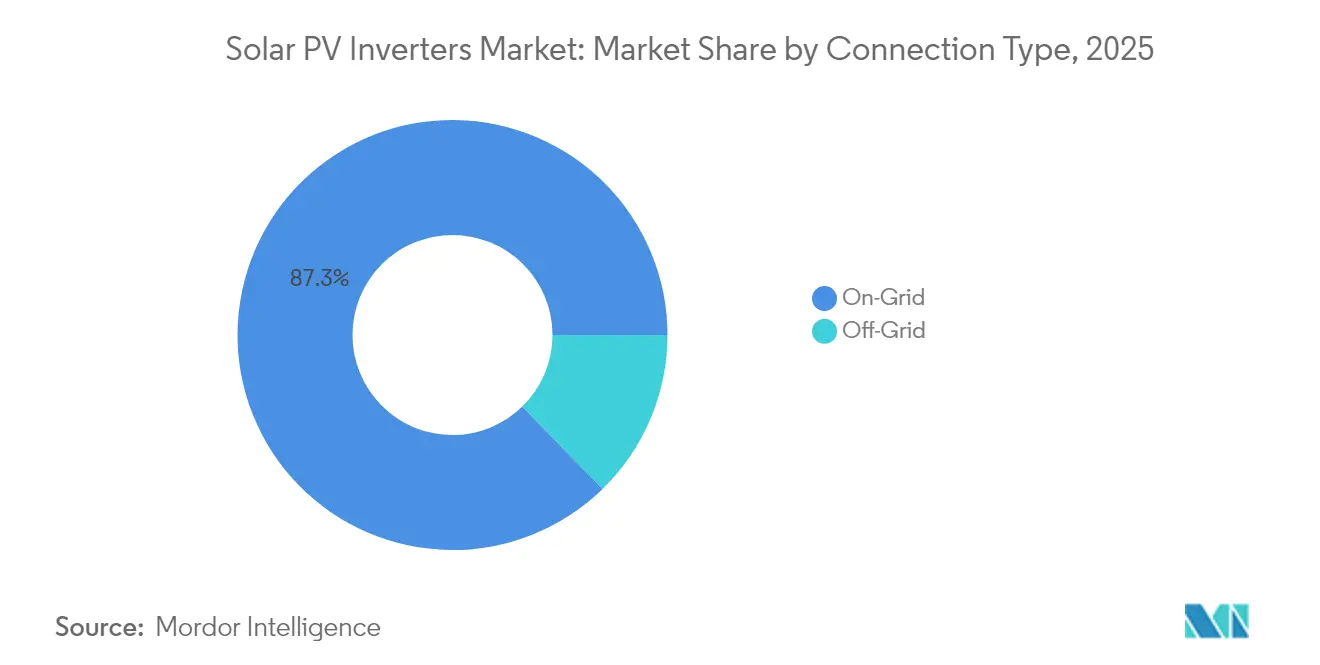
- By connection type, on-grid designs captured 87.30% of revenue in 2025, while off-grid solutions should expand at an 8.32% CAGR to 2031.
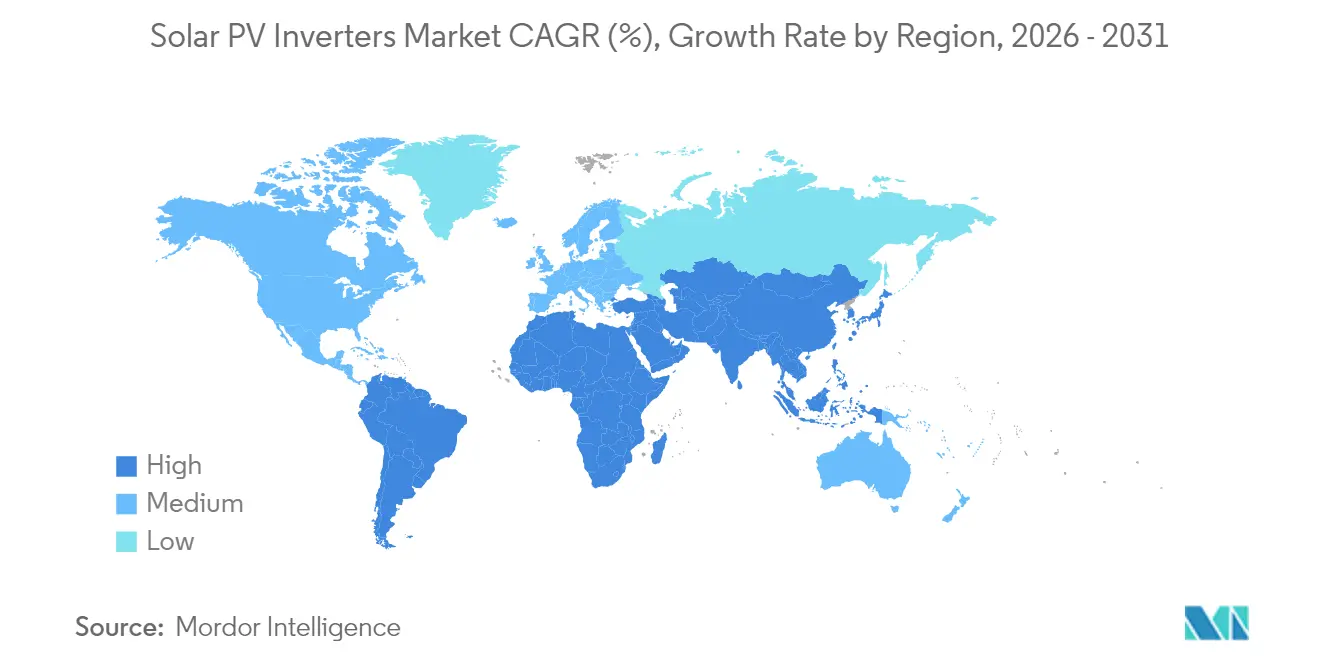
- By geography, Asia-Pacific held 54.40% of global shipments in 2025; the Middle East and Africa is the fastest-growing region with a 9.31% CAGR to 2031.
- Company level: the ten largest suppliers collectively controlled a major share of 2024 revenue, reflecting a highly concentrated landscape that raises barriers for new entrants.
Note: Market size and forecast figures in this report are generated using Mordor Intelligence’s proprietary estimation framework, updated with the latest available data and insights as of 2026.
Market Trends and Insights
Drivers Impact Analysis of Solar PV Inverters Market*
| Driver | (~) % Impact on CAGR Forecast | Geographic Relevance | Impact Timeline |
|---|---|---|---|
| Rapid adoption of high-voltage 1 500 V string inverters in utility-scale projects (US, Spain) | +1.2% | Global, with concentration in US and Spain | Medium term (2-4 years) |
| Mandatory rooftop-solar mandates in India's commercial buildings boosting ≤100 kW inverter demand | +0.8% | India, with spillover to Southeast Asia | Short term (≤ 2 years) |
| Aggressive replacement cycle of inverters installed during Japan's 2012-2016 FIT boom | +0.6% | Japan, with lessons for early-adopter markets | Medium term (2-4 years) |
| Integration of advanced grid-support functions lifting ASPs in Europe | +0.9% | Europe, expanding to North America | Long term (≥ 4 years) |
| Growth of hybrid PV-storage solutions driving bidirectional inverters in Australia | +0.7% | Australia, with replication in battery-incentive markets | Medium term (2-4 years) |
| Localization incentives in Brazil encouraging domestic manufacture of central inverters | +0.4% | Brazil, with potential expansion to Latin America | Long term (≥ 4 years) |
| Source: Mordor Intelligence | |||
Rapid adoption of high-voltage 1 500 V string inverters in utility-scale projects (US, Spain)
Utility developers increasingly specify 1,500 V—and pilot 2,000 V—DC architectures to lower balance-of-system costs and boost power density. GE Vernova’s 2,000 V platform showcases a 30% output gain that decreases levelized energy costs. This voltage migration renders 1,000 V arrays economically obsolete on new-build sites and spurs retrofit projects, especially where land and grid headroom allow bigger block sizes. Heightened semiconductor demand follows, tightening the supply of SiC devices and elevating the strategic importance of thermal design expertise among leading brands.
Mandatory rooftop-solar mandates in India’s commercial buildings boosting ≤100 kW inverter demand
India’s policy obliges new and existing commercial structures to install rooftop arrays, driving the sustained need for ≤100 kW inverters. Record additions of 4 GW in fiscal 2024 signal the scale of the opportunity [2]. Domestic manufacturers benefit from import-substitution targets embedded in the country’s 110 GW cell-and-module build-out by 2026, reinforcing the local value chain. While implementation gaps remain across several states, standardized installation practices create a template for broader residential uptake.
Aggressive replacement cycle of inverters installed during Japan’s 2012-2016 FIT boom
Feed-in premium rules push Japanese system owners to swap decade-old string inverters for units that supply reactive power and follow real-time price signals. Tokyo’s 2025 solar mandate for new buildings accelerates demand for devices capable of voltage regulation, driving premium revenue opportunities. The Japanese cycle offers a blueprint for other mature PV territories where early installations face synchronous aging and stricter grid codes.
Integration of advanced grid-support functions lifting ASPs in Europe
Europe now mandates remote-controlled, smart inverters on new projects. Germany’s Solarspitzen-Gesetz, in force since March 2025, limits feed-in to 60% unless advanced control capability is deployed. SMA’s adoption of 2 kV SiC MOSFETs in its flagship central platform underscores the performance leap required to satisfy those codes. Similar rules in Spain, Italy, and the United Kingdom elevate average selling prices (ASPs) across the regional solar PV inverter market.
Restraints Impact Analysis of Solar PV Inverters Market*
| Restraint | (~) % Impact on CAGR Forecast | Geographic Relevance | Impact Timeline |
|---|---|---|---|
| Persistent shortages & price volatility of high-current SiC/IGBT power modules | -1.4% | Global, with acute impact in premium segments | Short term (≤ 2 years) |
| Rising curtailment in China's northwest dampening central-inverter orders | -0.9% | China, with spillover effects to global pricing | Medium term (2-4 years) |
| Fragmented US interconnection codes inflating certification costs | -0.6% | United States, with indirect impact on global standards | Medium term (2-4 years) |
| Fire-safety concerns on rooftop DC circuits slowing microinverter uptake in Germany | -0.4% | Germany and EU, with potential spread to other markets | Long term (≥ 4 years) |
| Source: Mordor Intelligence | |||
Persistent shortages & price volatility of high-current SiC / IGBT power modules
SiC wafer supply tightness continues to constrain high-efficiency inverters and amplify bill-of-material costs. Wolfspeed’s financial distress heightens risk perceptions, whereas Infineon’s switch to cost-effective 200 mm SiC wafers signals relief from 2026 onward [3]. European and North American producers, dependent on advanced semiconductors for grid-forming functionality, experience sharper margin compression than vertically integrated Chinese peers able to fall back on silicon alternatives.
Rising curtailment in China’s northwest dampening central-inverter orders
Curtailment in China’s northwest could rise from 2.4% in 2023 to 10% by 2030. Large utility assets face revenue erosion, compelling developers to postpone or resize projects and trim orders for central units. Market-based pricing for renewable electricity, effective June 2025, intensifies competition for grid capacity. A nationwide storage build-out may offset long-range risks, but near-term order books remain vulnerable.
*Our forecasts treat driver/restraint impacts as directional, not additive. The impact forecasts reflect baseline growth, mix effects, and variable interactions.
Solar PV Inverters Market Segment Analysis
By Inverter Type:
Microinverters Gather MomentumCentral units retained a 54.30% revenue lead in 2025, yet microinverters are forecast to grow at an 7.96% CAGR as module-level electronics move beyond the early-adopter niche. Enphase shipped more than 6.5 million domestic microinverters in 2025, satisfying US localization criteria and underlining the segment’s commercial scale . The solar PV inverter market rewards firms that combine ASIC design, wireless data, and thermal engineering in a miniature footprint. Central architectures now confront flattish demand in China due to curtailment but remain anchored in utility projects elsewhere, especially where plant-level controls and competitive capex remain priorities.
Competitive intensity is pronounced in microelectronics; barriers arise from firmware sophistication and safety certifications rather than raw hardware cost. Consequently, low-price entrants struggle to keep pace with rapid feature rollouts such as rapid shutdown and battery interface modes. Despite robust volume growth, microinverters are not likely to eclipse string platforms before the next decade, keeping the solar PV inverter market diversified by architecture.

By Application:
Prosumer Demand Narrows the GapUtility plants captured 62.25% of 2025 shipments, reflecting large project pipelines locked under long-term PPAs. Even so, residential systems should expand by 7.45% annually as grid services and net-billing frameworks enhance household economics. India’s Pradhan Mantri Surya Ghar program targets 30 GW of rooftop arrays by March 2027, while Australia’s battery add-on trend lifts attachment rates. Commercial rooftops ride India’s rooftop mandate wave but face cautious finance terms in other regions that stretch payback timelines.
Prosumers increasingly value bidirectional capability and island-mode resilience, prompting inverter OEMs to integrate battery control logic. The resulting ASP uplift compensates for slower macro installation growth, supporting aggregate revenue progression inside the solar PV inverter market. Utility developers, meanwhile, focus on 1,500 V and 2,000 V platforms, coupling them with STATCOM-like functionalities to meet stricter grid-code compliance.
By Phase:
Residential Scale Fuels Single-Phase UptakeThree-phase machines accounted for 71.20% of 2025 revenue, anchored in commercial rooftops and utility installations. Single-phase units, however, track a 7.05% CAGR as household volumes climb in Europe, India, and Australia. Government approval of balcony solar kits up to 800 W in Germany illustrates how plug-and-play designs create grassroots capacity growth. Looking ahead, larger US homes and Japanese complexes may warrant quasi-three-phase solutions, blurring historical boundaries between the two categories.
Cost-downs in digital control boards and power stages allow single-phase products to incorporate advanced grid-forming algorithms. This capability reduces voltage flicker, boosting acceptance among distribution network operators. OEMs that standardize modular platforms across both phase variants should capture cross-segment synergies while keeping the bill of materials in check.
By Connection Type:
Hybrid Flexibility Expands Off-Grid NichesOn-grid architectures maintained an 87.30% share in 2025, enabled by net metering and feed-in frameworks. Off-grid solutions, projected to grow 8.32% annually, see traction in Sub-Saharan electrification and remote mining camps that demand autonomy from weak grids. Falling lithium-ion costs and ruggedized inverter-charger combos simplify deployment, although maintenance and upfront capex still hinder widespread uptake.
Hybrid systems that switch seamlessly between grid-tied and islanded modes straddle both segments. They satisfy backup power expectations in outage-prone regions such as California while capturing demand-response revenue when grid-connected. Consequently, inverter firmware roadmaps prioritize multi-mode capability as a baseline rather than an optional upgrade, reinforcing value capture inside the solar PV inverter market.
Geography Analysis
APAC Solar PV Inverters Market
Asia-Pacific generated 54.40% of 2025 shipments, underpinned by China’s vertically integrated supply chain and India’s policy-driven rooftop push. While China’s new market-based tariff regime may slow greenfield installations, volume resilience stems from retrofits that embed storage and higher-voltage strings. India’s manufacturing capacity, set to reach 110 GW by 2026, tightens domestic procurement loops and shields the local solar PV inverter market from import volatility, although regional disparities in regulatory execution temper immediate gains.
Europe, North America and Middle East Solar PV Inverters Market
The Middle East, clocking the quickest 9.31% CAGR through 2031, aligns gigawatt-scale projects with economic diversification blueprints. Harsh desert conditions drive demand for high-derating-temperature designs, opening niches for European OEMs specializing in sealed cubicle solutions. Grid-reinforcement efforts in Saudi Arabia and the United Arab Emirates elevate low-voltage ride-through and reactive-power management specifications, pressing vendors to certify products against stricter utility benchmarks. North America and Europe operate in a mature install base where replacement and retrofit cycles dominate incremental demand. The US Inflation Reduction Act’s domestic content credits accelerate localized production, with Texas, South Carolina, and Arizona facilities targeting annual output well above 30 GW by 2026. Europe’s renewable penetration surpassing 50% in markets such as Germany and Spain raises the value of grid-forming features, allowing vendors to pass through higher ASPs even as new-build volumes plateau.
Regulatory Landscape
Regulation for solar PV inverters is tightening around grid-support performance, safety, and local compliance pathways, which increases the value of certified ride-through, reactive power, and remote-control functionality. In Europe, Germanys VDE-AR-N 4105:2026 updates low-voltage connection requirements for residential and hybrid inverters, while EN IEC 62109-3:2026 expands safety testing for PV inverters, including robustness in more complex multi-source grid-connected scenarios. Australia continues to steer market access through the Clean Energy Council inverter listing program (aligned to AS/NZS 4777.2), which influences which models installers can deploy under common connection processes.
Large markets are also using standards and trade tools that shape sourcing and model portfolios. China issued GB/T 46898-2025 for residential hybrid PV and storage converters and GB/T 46987-2025 for PV system power conversion equipment at the end of 2025, with implementation rolling into 2026 and formalizing requirements for PV plus storage converter behavior. In India, MNRE extended self-certification provisions for higher-capacity inverter categories through December 31, 2026, helping projects proceed while compliance infrastructure scales. In the United States, NERC approved new inverter-based resource (IBR) standards (PRC-028-1, PRC-029-1, PRC-030-1), with key bulk power system compliance dates set to October 1, 2026, elevating data recording and ride-through expectations that flow into inverter controls and certification workstreams.
Competitive Landscape
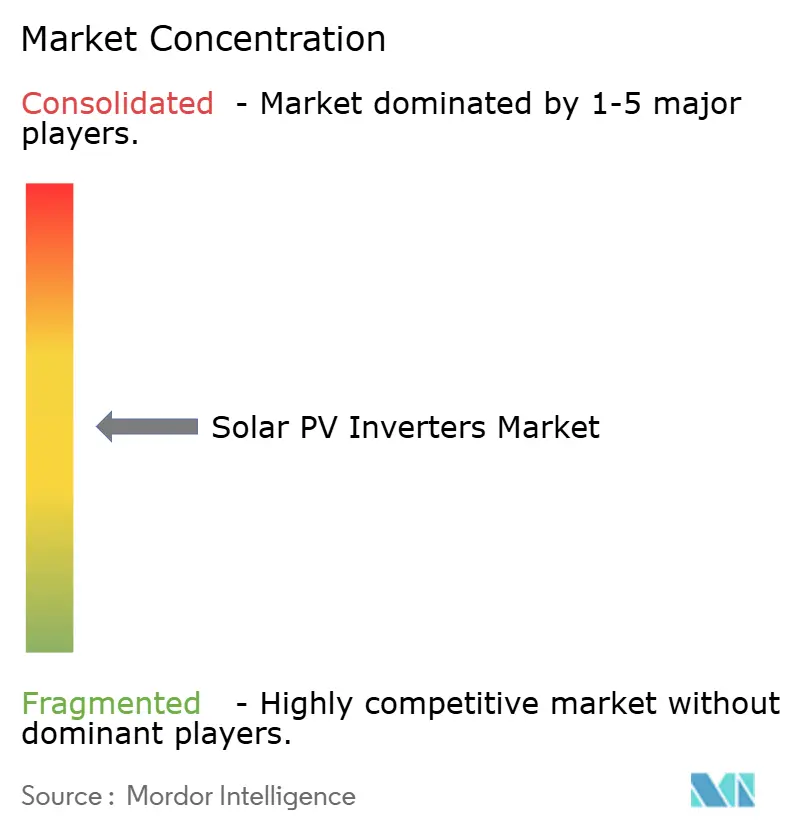
Market concentration is moderately consolidated: the ten largest suppliers commanded a major global revenue share in 2024. Chinese firms capitalize on material cost advantages and end-to-end vertical integration to dominate high-volume, price-sensitive segments. Conversely, European and American brands differentiate in firmware sophistication and compliance with domestic content stipulations. SolarEdge, for instance, produced its 250,000th unit at its Austin site in June 2025, underscoring localized scale-up momentum.
Technology rivalry centers on grid-forming control loops, bidirectional interfacing, and cybersecure remote-update capability. SMA’s integration of 2 kV SiC MOSFETs displays a leap toward ultra-high voltage solutions, while GE Vernova’s 2,000 V range targets balance-of-system savings for large developers. Enphase’s microelectronics pedigree delivers competitive moats in firmware, ASICs, and proprietary communication protocols, complicating fast-follower strategies from low-cost entrants.
M&A activity continues as inverter specialists seek portfolio breadth. Generac’s acquisition of Chilicon Power in 2024 provided an immediate pathway into microinverter hardware and monitoring. Hoymiles’ decision to open a Mexican plant the same year illustrates strategic hedging against United States trade uncertainties. Prospective newcomers confront a dual hurdle of steep certification expenses and a global value chain in which established vendors already occupy the lion’s share of utility pre-qualification lists, reinforcing the solar PV inverter market’s high entry barriers.
Solar PV Inverters Industry Leaders
-
Huawei Technologies Co., Ltd.
-
Sungrow Power Supply Co., Ltd.
-
SMA Solar Technology AG
-
SolarEdge Technologies Inc.
-
Enphase Energy Inc.
- *Disclaimer: Major Players sorted in no particular order
Solar PV Inverters Market Companies Covered in this Report
- Huawei Technologies Co., Ltd.
- Sungrow Power Supply Co., Ltd.
- SMA Solar Technology AG
- SolarEdge Technologies Inc.
- Enphase Energy Inc.
- FIMER SpA
- Delta Electronics, Inc.
- Growatt New Energy Technology Co., Ltd.
- Ginlong (Solis) Technologies
- TMEIC Corporation
- Mitsubishi Electric Corporation
- Schneider Electric SE
- Siemens AG
- Eaton Corporation plc
- Hitachi Energy Ltd.
- Omron Corporation
- Power Electronics España S.L.
- Chint Power Systems Co., Ltd.
- GoodWe Technologies Co., Ltd.
- GE Vernova
- Canadian Solar Inc. (CSI Solar)
- Toshiba Mitsubishi-Electric Industrial Systems Corp. (TMEIC)
- Kepco KPS (South Korea)
Market Opportunities and Future Outlook
Opportunity concentrates where policy or procurement translates into localization, certification, and capability upgrades. In the United States, the Treasury finalized Section 45X rules in October 2024, explicitly assigning inverter credits ranging from 0.25 cents per watt for central inverters (above 1 MWac) to 11 cents per watt for microinverters, improving the economics of domestic manufacturing and supply-chain localization for qualified products. This policy framework is reflected in industrial capacity additions, including EPC Powers July 2026 opening of a 167,000 sq ft factory in Fountain Inn, South Carolina, adding 27 GW of annual power-conversion capacity and expanding addressable demand beyond classic solar builds into grid-heavy loads such as AI data centers and utility-scale interconnections.
In Europe, the localization theme is also showing up through supply capacity and policy proposals rather than only installation growth. Regional inverter manufacturing capacity surpassed 100 GWac (with about 53 GWac available for the internal market), creating room for EU-qualified product lines that meet evolving grid-code and safety requirements without extended import lead times. The European Commissions March 2026 proposal for a Made-in-EU requirement for publicly funded solar projects further increases the strategic value of EU manufacturing footprints and compliant bill-of-materials strategies. In India, the extension of BIS-related compliance timelines for large solar inverters through December 31, 2026 points to a near-term opening for manufacturers that can secure testing slots, documentation, and local support, especially for higher-power string and central platforms used in utility and C&I rooftops.
Recent Industry Developments in Solar PV Inverters Market
- July 2026: Sungrow signed a framework agreement in India covering 4 GW of solar inverters and 2 GWh of solar-plus-storage, naming ReNew Power, Tata Power Renewable Energy, Adani Green Energy, and NHPC Renewable Energy. The arrangement bundles inverter supply with storage-oriented solutions over a defined rollout window and reinforces the shift toward integrated PV and BESS procurement and higher-value power-conversion packages.
- June 2026: Sungrow unveiled the SG510HX and an MVS turnkey solution at Intersolar Europe 2026, pairing a 511.5 kW string inverter with a medium-voltage station for utility-scale deployments. Bundling inverter and MV infrastructure as a system targets balance-of-system simplification and positions high-power string architectures as direct alternatives to traditional central inverter blocks.
- September 2024: GE Vernova introduced a 2,000 V utility inverter platform, piloted in North America, highlighting the move toward ultra-high-voltage DC architectures for large plants. The launch supported developers seeking lower balance-of-system costs and increased competitive pressure on incumbent utility-scale inverter vendors to accelerate 2,000 V-ready roadmaps.
Solar PV Inverters Market Report Scope and Research Methodology
Market Definition and Coverage
In this methodology, the solar PV inverters market covers the revenue generated from equipment that converts solar panel DC power into usable AC power for connection to loads, batteries, or the grid across residential, commercial, industrial, and utility settings.
Scope exclusions: This sizing excludes PV modules, racking, standalone transformers and switchgear, and EPC or O&M service revenue that is not invoiced as part of the inverter product sale.
Segments Covered in This Report
- By Inverter Type
- Central Inverters
- String Inverters
- Microinverters
- Hybrid/Battery-Ready Inverters
- By Phase
- Single-Phase
- Three-Phase
- By Connection Type
- On-Grid
- Off-Grid
- By Application
- Residential
- Commercial and Industrial
- Utility-Scale
- By Geography
- North America
- United States
- Canada
- Mexico
- Europe
- United Kingdom
- Germany
- France
- Spain
- Nordic Countries
- Russia
- Rest of Europe
- Asia-Pacific
- China
- India
- Japan
- South Korea
- Malaysia
- Thailand
- Indonesia
- Vietnam
- Australia
- Rest of Asia-Pacific
- South America
- Brazil
- Argentina
- Colombia
- Rest of South America
- Middle East and Africa
- United Arab Emirates
- Saudi Arabia
- South Africa
- Egypt
- Rest of Middle East and Africa
- North America
Data Sources, Market Sizing, and Validation
Desk Research
Desk research is used to build the factual base for installations, trade flows, and policy timelines that shape inverter demand, and then to sanity check the model outputs. We relied on public sources such as IEA PVPS statistics, IRENA renewables capacity data, U.S. EIA releases, Eurostat energy datasets, and UN Comtrade trade codes, which help us understand where solar additions and equipment movement are actually occurring.
Along with this, we reviewed company annual reports, investor presentations, product catalogs, and reputable energy press to interpret mix shifts such as string versus central adoption and the spread of hybrid, battery ready designs. Where gaps exist in public financial splits, we used paid subscriptions for company financials and intelligence, plus patent databases and an import and export shipment level database to cross-check technology direction and supply routes. These desk sources are not exhaustive, and many other public documents and datasets were referred to during data collection, validation, and clarification.
Primary Interviews and Surveys
Primary work was used to pressure test assumptions that are not directly observable in public statistics, including typical pricing by power class, channel margins, and the share of replacement demand in mature markets. We spoke with a mix of manufacturers, distributors, installers, EPC participants, and utility and C&I buyers across major solar regions so that demand signals and supply signals could be reconciled before finalizing totals.
Distribution of primary research fieldwork respondents
| Company type | Respondent position | Region |
|---|---|---|
| Top tier: 31% | CXOs: 18% | APAC: 46% |
| Mid tier: 50% | Functional/Unit leaders: 37% | EMEA: 30% |
| Smaller Players: 19% | Managers: 45% | Americas: 24% |
Market-Sizing & Forecasting
For sizing, the core model starts from a top-down build where annual solar additions by region are converted into an inverter demand pool using typical DC to AC sizing practices, application mix, and replacement cycles. To make the totals more realistic, results are then corroborated using selective bottom-up checks, such as sampled average selling prices by inverter type and region, distributor channel checks, and a limited roll-up of supplier revenues where product disclosure is clear.
Key inputs used in the model include annual PV capacity additions (GW), inverter loading ratios, the mix of residential versus utility scale installs, price progression by power class, and the share of hybrid and storage ready units. Grid code tightening and tender schedules were also tracked because they affect refresh cycles and the timing of demand more than many buyers expect.
Forecasts were produced using scenario analysis supported by short ARIMA runs on the historical demand pool, and then the final path was adjusted based on expert views on policy continuity, financing conditions, and expected price normalization. Where bottom-up visibility was weak in fragmented channels, conservative gap fills were applied using regional ASP bands and installation mix, and then checked again against trade and supply indicators.
Data Validation & Update Cycle
Validation is done through multiple checks so the final numbers are not driven by one data stream. Our analysts compare the modeled revenue totals against independent signals like solar installation trends, shipment indicators, published capacity additions, and the expected mix shift across inverter types, then re-check assumptions if large variances appear.
Before sign-off, outliers are reviewed in an internal analyst pass, and interview follow-ups are triggered if pricing, application mix, or policy timing looks inconsistent across regions. The report is refreshed on an annual cycle, and interim updates are made when material events occur, including major policy reversals or sudden pricing swings. Right before delivery, a final update sweep is performed so clients receive the latest view aligned with the most recent public releases.
Mordor Intelligence's Solar PV Inverters Market Size Measured Against Other Published Estimates
Published market values for solar PV inverters often do not match because each publisher defines the product line differently, chooses a different base year, and applies its own pricing and replacement logic. Inverters sit close to adjacent power electronics, so even a small scope choice can change the total, and forecasting style can widen the gap further.
Some estimates widen the basket by counting DC-side devices like power optimizers within the inverter total, and some also assume a faster ASP climb that is not consistently supported by recent bid and channel feedback. In Mordor Intelligence, only inverter revenue is counted across central, string, and micro types, and optimizer-only revenue is kept out, with ASP movement refreshed using primary checks by region and application so the demand pool stays tied to installed PV additions and realistic replacement cycles.
Benchmark comparison
| Source | Market Size | Gaps in Research Methodology |
|---|---|---|
| Mordor Intelligence | USD 15.24 B (2026) | |
| Global Consultancy A | USD 15.15 B (2025) | Uses an earlier base year and a different timing for currency and pricing inputs, and the scope write-up suggests hybrid and adjacent power electronics may be blended into the same total in some cases. |
| Industry Publisher B | USD 12.80 B (2024) | Appears to include power optimizers within the PV inverter category, and the growth path is more aggressive, which can happen when replacement cycles and application mix are not validated with channel-level price and volume checks. |
The spread in the table is mostly explained by what gets counted as an inverter versus adjacent electronics, plus the base year and how prices are carried forward. By keeping the demand pool anchored to PV additions and replacement timing, and then checking ASP bands through interviews, the approach stays transparent and repeatable even when public data is uneven.
Key Questions Answered in the Report
What is the current size of the solar PV inverter market in 2026?
The solar PV inverter market stands at USD 15.24 billion in 2026.
How fast will the market grow over the next five years?
It is projected to expand at a 6.79% CAGR, reaching USD 21.16 billion by 2031.
Which region leads global demand?
Asia-Pacific holds 54.40% of shipments due to China’s manufacturing scale and India’s rooftop mandates.
What inverter topology is gaining share fastest?
Microinverters exhibit the quickest growth at a 7.96% CAGR, propelled by residential and distributed generation uptake.
How concentrated is the industry?
The ten largest suppliers account for 60% of 2024 revenue, indicating high concentration with significant entry barriers.
What is the main technological trend shaping product design?
Grid-forming and bidirectional capabilities that support energy storage and ancillary services dominate current R&D roadmaps.