
Market Overview
| Study Period | 2021 - 2031 |
|---|---|
| Market Volume (2026) | 2.91 Terawatt |
| Market Volume (2031) | 7.23 Terawatt |
| Growth Rate (2026 - 2031) | 19.92% CAGR |
| Fastest Growing Market | Middle-East and Africa |
| Largest Market | Asia Pacific |
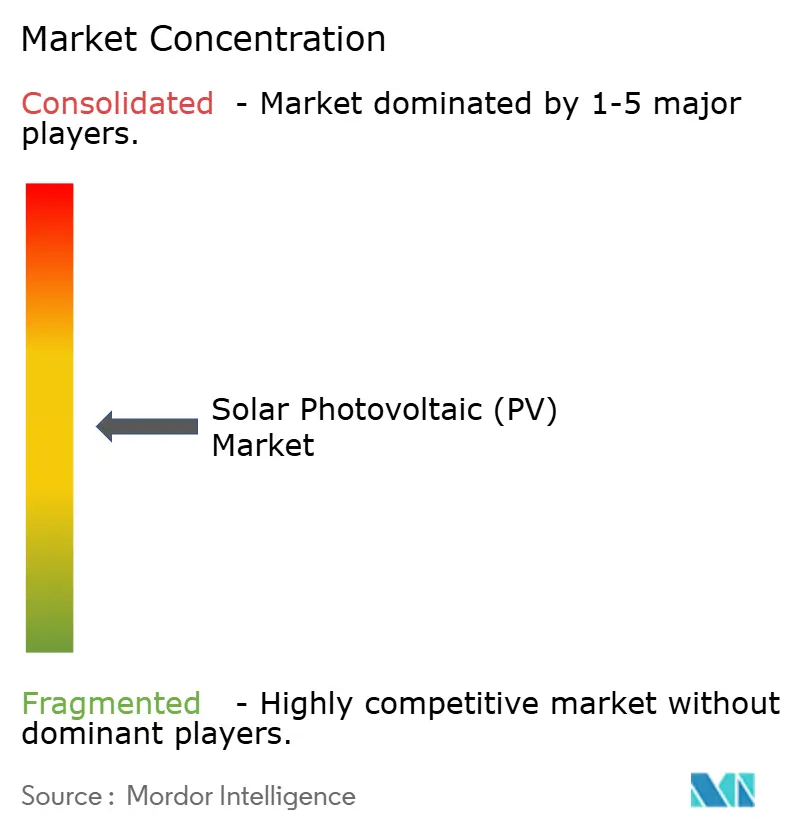
| Market Concentration | Medium |
Major Players *Disclaimer: Major Players sorted in no particular order Image © Mordor Intelligence. Reuse requires attribution under CC BY 4.0. | |
Solar Photovoltaic (PV) Market Analysis by Mordor Intelligence
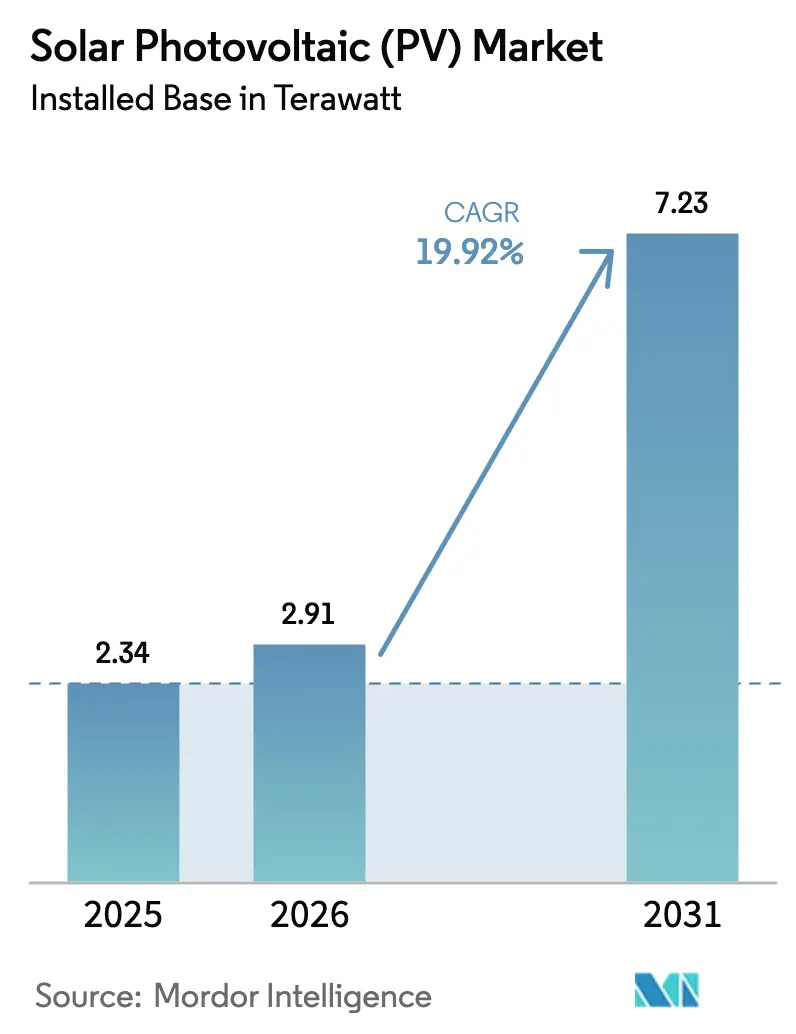
The Solar Photovoltaic Market size in terms of installed base is projected to be 2.34 Terawatt in 2025, 2.91 Terawatt in 2026, and reach 7.23 Terawatt by 2031, growing at a CAGR of 19.92% from 2026 to 2031.
Module average selling prices fell below USD 0.09 per watt-peak in early 2025, which enabled grid-parity in more than 140 countries and stimulated record procurement commitments from utilities and corporates. The United States production-tax-credit framework, tandem cell efficiency records above 34%, and accelerating green-hydrogen demand keep investment momentum high. Price competition among Chinese manufacturers continues to compress margins, yet it lowers levelized costs across emerging markets and unlocks incremental demand that was previously uneconomical. Robust policy support in the United States, India, and Saudi Arabia improves domestic supply security, while artificial-intelligence forecasting, battery pairing, and agrivoltaics collectively raise project returns and diversify revenue streams.
Key Report Takeaways
- By technology, the Solar Photovoltaic market was led by monocrystalline silicon captured 86.1% of the 2025 solar panels market share, whereas tandem and perovskite architectures are poised to grow at a 31.1% CAGR to 2031.
- By deployment type, ground-mounted arrays held 75.5% of 2025 installed capacity, while floating photovoltaic systems are forecast to advance at a 30.5% CAGR through 2031.
- By end-user, utility-scale independent power producers accounted for 63.2% of demand in 2025, but residential installations are expected to rise at a 22.7% CAGR between 2026 and 2031.
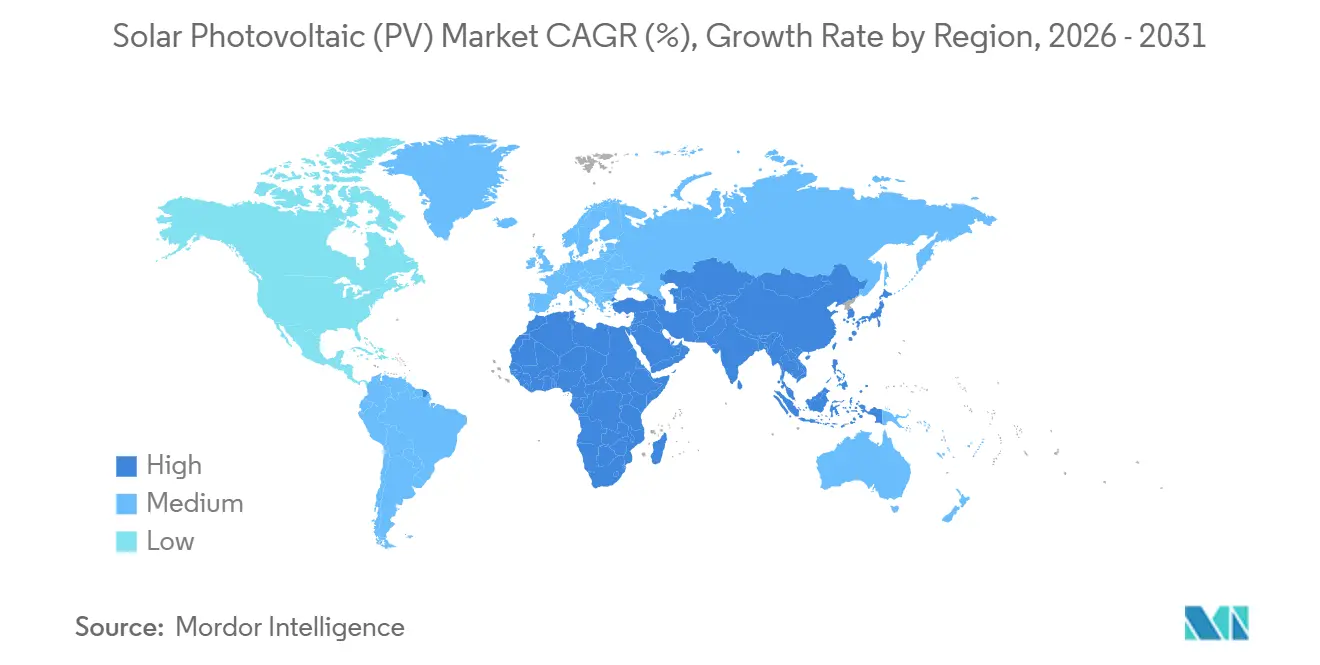
- By geography, Asia-Pacific commanded 64.3% of the Solar PV market share in 2025, whereas the Middle East and Africa region is poised for a 21.5% CAGR through 2031.
Note: Market size and forecast figures in this report are generated using Mordor Intelligence’s proprietary estimation framework, updated with the latest available data and insights as of January 2026.
Global Solar Photovoltaic (PV) Market Trends and Insights
Drivers Impact Analysis*
| Driver | (~) % Impact on CAGR Forecast | Geographic Relevance | Impact Timeline |
|---|---|---|---|
| Falling module ASPs widen grid-parity zones | 4.2% | Global, with strongest impact in India, Southeast Asia, Latin America, and Sub-Saharan Africa | Medium term (2-4 years) |
| IRA-driven on-shoring of PV manufacturing in the U.S. | 3.8% | North America, with spillover effects in Mexico and Canada | Medium term (2-4 years) |
| AI-enabled solar forecasting cuts balancing costs | 1.5% | North America, Europe, Australia; markets with advanced grid infrastructure and high renewable penetration | Short term (≤ 2 years) |
| Demand from green-hydrogen electrolyzer projects | 2.9% | Middle East (Saudi Arabia, UAE, Oman), Australia, Europe (Iberia, North Sea region), Chile | Long term (≥ 4 years) |
| Corporate 24/7 clean-power PPA commitments | 2.6% | North America, Europe, select Asia-Pacific markets (Japan, South Korea, Singapore) | Short term (≤ 2 years) |
| Agrivoltaics unlocks dual-land use revenues | 1.2% | Europe (France, Germany, Italy), United States (California, Midwest), India, Japan, with emerging adoption in Southeast Asia | Medium term (2-4 years) |
| Source: Mordor Intelligence | |||


Falling Module ASPs Widen Grid-Parity Zones
Spot prices in the Solar PV market dropped to USD 0.082 per watt-peak FOB China in July 2025, a 32% fall from early 2024. The decrease expanded grid-parity to 142 nations where utility-scale solar now undercuts coal and gas generation by 15–25%. Market consolidation accelerated as the five largest suppliers controlled 68% of 2025 shipments. Regulatory efficiency thresholds of 21% for utility projects and 19% for rooftop systems safeguard performance standards. Developers responded by integrating module production and EPC services to recapture margin. Forward price curves suggest another 10–15% decline by 2027 as N-type TOPCon technology achieves manufacturing parity with PERC.
IRA-Driven On-Shoring of PV Manufacturing in the U.S.
Section 45X credits of USD 0.07 per watt-dc for modules and USD 0.04 per watt-dc for cells spurred USD 10 billion of factory announcements through 2025. First Solar’s Louisiana plant adds 3.5 GW of thin-film output in 2026. Domestic module production reached 12 GW dc in 2024, yet satisfied only 8% of local demand. Treasury guidance now requires 55% U.S. cost content by 2027 to qualify for the full 30% investment tax credit. Vertically integrated supply chains cut lead times to eight weeks and slashed freight costs by 40% for East Coast projects.
AI-Enabled Solar Forecasting Cuts Balancing Costs
Machine-learning models lowered day-ahead forecast errors below 5% for California ISO in 2025, strengthening the Solar PV market by saving USD 8–12 per MWh in ancillary-service expenses.[1]National Renewable Energy Laboratory, “Utility-Scale Solar Grid Parity Expansion,” nrel.gov Google DeepMind’s work with National Grid ESO attained 92% prediction accuracy 36 hours ahead and deferred USD 200 million in spin-reserve investments. ERCOT integrated real-time forecasting into nodal prices and lifted market-clearing efficiency by 22%. Software licensing costs of USD 0.003–0.005 per watt-dc equal under 1% of project capex and deliver IRRs above 25%.
Demand From Green-Hydrogen Electrolyzer Projects
International Energy Agency modeling shows that 38 million tpa green-hydrogen capacity by 2030 will need 250–300 GW of dedicated solar.[2]International Energy Agency, “Hydrogen 2025 Report,” iea.org Saudi Arabia’s NEOM hub integrates 4 GW of renewables and ships 1.2 million tpa ammonia from 2026. Electrolyzer capex fell from USD 1,200 per kW in 2023 to USD 850 per kW in 2025, enabling merchant projects below USD 3 per kg of hydrogen. EU REPowerEU goals and ISO 14687 certification protocols further lift procurement in Spain, Portugal, and Greece.
Restraints Impact Analysis*
| Restraint | (~) % Impact on CAGR Forecast | Geographic Relevance | Impact Timeline |
|---|---|---|---|
| Grid-congestion & curtailment risks in high-penetration regions | -2.3% | California, Texas, Germany, South Australia | Short term (≤ 2 years) |
| Rapid polysilicon price swings squeeze producer margins | -1.8% | Global, most acute in China and Southeast Asia | Short term (≤ 2 years) |
| Anti-dumping trade actions fragment supply chains | -2.1% | United States, European Union, India | Medium term (2-4 years) |
| Rising rooftop-fire regulations add balance-of-system cost | -1.2% | California, Europe (Germany, France, UK), Australia | Medium term (2-4 years) |
| Source: Mordor Intelligence | |||
Grid-Congestion & Curtailment Risks in High-Penetration Regions
California curtailed 2.6 million MWh of renewable electricity in 2023, equal to 385,000 homes’ annual use.[3]California ISO, “2023 Annual Curtailment Report,” caiso.com Evening ramps increase gas-peaker cycling costs by USD 15–20 per MWh. ERCOT foresees 4 million MWh of curtailment each year by 2028 as West-Texas solar surpasses transmission capacity. Germany paid EUR 1.2 billion to compensate curtailed generators in 2024. South Australia imposed dynamic export limits on rooftop systems, cutting household feed-in revenue 12–18%. U.S. interconnection queues above 2,000 GW stretch upgrade timelines to a decade, posing a key challenge for the Solar photovoltaic PV market by pushing developers toward behind-the-meter installations.
Rapid Polysilicon Price Swings Squeeze Producer Margins
Prices climbed 35% between Q1 and November 2025 to USD 8.40 per kg after Xinjiang plant outages and export controls. Gross margins at non-integrated module makers fell to 9%, forcing Yingli and Suntech to idle lines. Vertically integrated leaders maintained 14–16% margins by securing in-house feedstock. New U.S. countervailing duties of 2.85–39.37% on Southeast-Asian imports increased landed prices by up to USD 0.04 per watt-peak.[4]U.S. Department of Commerce, “Preliminary Solar Countervailing Duties,” commerce.gov Futures contracts on the Shanghai exchange now hedge polysilicon exposure for 28% of global shipments.
*Our forecasts treat driver/restraint impacts as directional, not additive. The impact forecasts reflect baseline growth, mix effects, and variable interactions.
Segment Analysis
By Technology: N-Type Architectures Challenge PERC Dominance
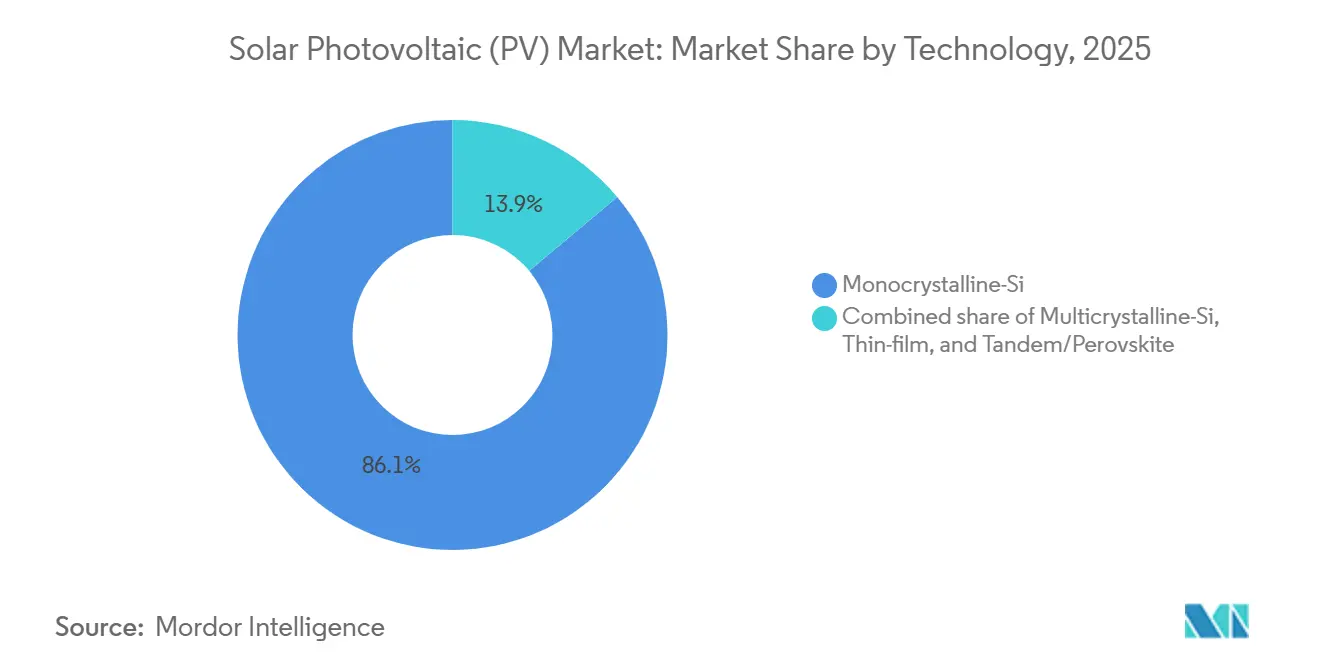
Monocrystalline silicon maintained 86.1% solar panels market share in 2025 as cell efficiencies reached 27.81%, reinforcing its leadership in the Solar PV industry. The solar panels market size for advanced tandem and perovskite modules is forecast to grow at 31.1% CAGR through 2031, reflecting Oxford PV’s 24.5% commercial products and 10,000-hour stability milestones. Multicrystalline declined to 8.2% as producers migrated toward N-type TOPCon and heterojunction lines that lift performance by 1.5–2 percentage points at comparable costs.
Investment in R&D topped USD 1.2 billion among leading firms in 2025, focusing on bifacial, half-cut, and multi-bus-bar layouts that push 600 W-plus panel ratings. Thin-film cadmium-telluride retained a 4.9% share, favored for hot-climate utility sites where lower temperature coefficients elevate annual energy yield 3-5%. Bankability hinges on IEC 61215 and IEC 61730 compliance, which underpins financing terms and lowers debt margins by up to 50 basis points.


By Deployment Type: Floating PV Gains Traction in Land-Constrained Markets
Ground-mounted arrays represented 75.5% of installations in 2025, with project capex falling to USD 0.75–0.95 per watt-dc. The solar panels market size allocated to floating photovoltaic systems is poised for a 30.5% CAGR run as China, India, and Singapore prioritize water-body utilization. India’s 100 MW Ramagundam plant delivered 5–10% higher output thanks to evaporative cooling.
Singapore’s Tengeh Reservoir system covers 60 MW and curbs annual water loss by 1.2 million m³. ASEAN nations now integrate floating PV with hydropower reservoirs to smooth seasonal flows and maximize transmission usage, with 12 schemes totaling 1.8 GW underway. Rooftop and building-integrated systems held an 18.3% share in 2025 but face tariff revisions such as California’s NEM 3.0, which cut export credits by 75% and shifted economics toward self-consumption tied to battery storage in the solar photovoltaic market.
By End-User: Residential Upswing Offsets Utility-Scale Maturity
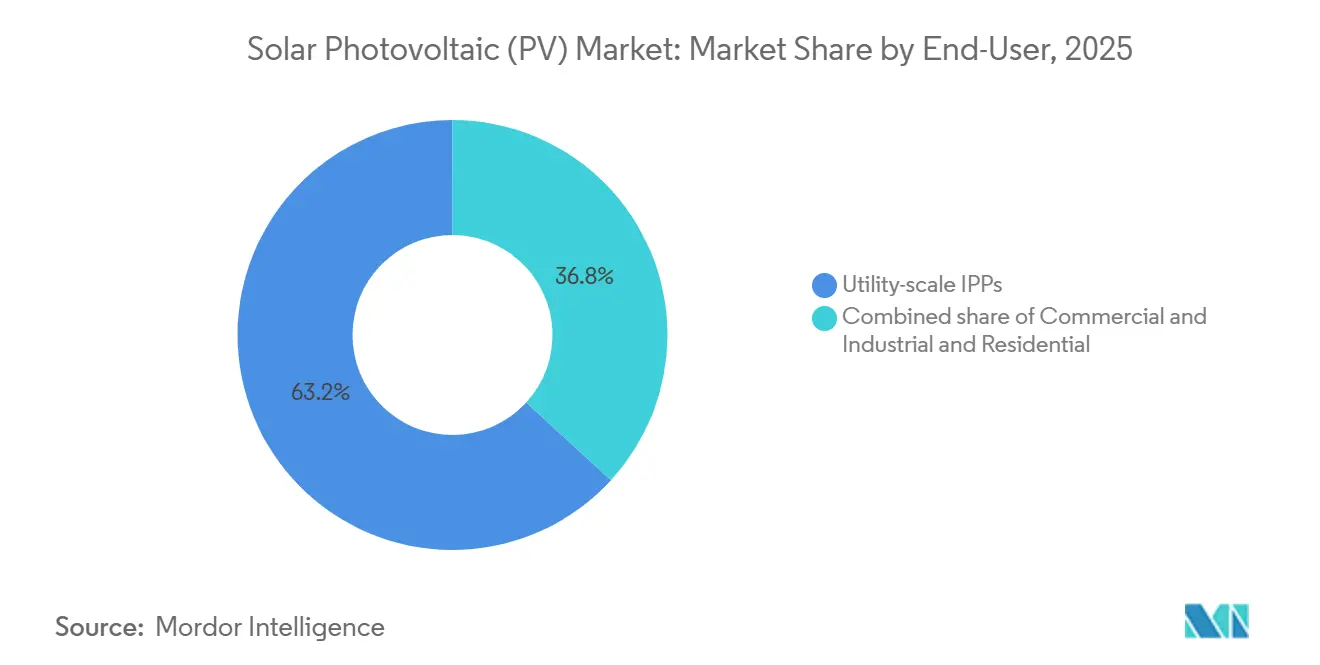
Utility-scale independent power producers dominated demand at 63.2% in 2025, anchored by 15–25-year power purchase agreements and levelized energy costs below USD 0.03 per kWh in high-irradiance zones. The solar panels market size for residential buyers is projected to expand at a 22.7% CAGR through 2031, buoyed by the 30% U.S. investment tax credit extension and rising retail electricity rates that compressed payback periods to six to eight years.
Commercial and industrial users claimed a 14.6% share in 2025, strengthening the Solar photovoltaic market as behind-the-meter arrays of 100 kW–5 MW gained traction to hedge time-of-use tariffs. Germany nullified VAT on systems below 30 kW, lifting household installations 38% year on year. India disbursed INR 18,000 crore in rooftop subsidies but reached only 11 GW of cumulative capacity due to interconnection hurdles. Corporate offtakers now specify 24/7 matching that necessitates storage additions of USD 0.25–0.40 per watt-dc yet secures Scope 2 emission cuts exceeding 90%.
Geography Analysis
Asia-Pacific closed 2025 with 64.3% of global installed capacity, driven by China’s 210 GW of new projects and India’s 85 GW cumulative base. Japan’s feed-in tariff step-down slowed rooftop growth, but corporate PPAs advanced 62% as LNG volatility spurred interest in price stability. ASEAN markets added 18 GW thanks to concessional finance that trimmed debt premiums 30–40 basis points. Australia’s household penetration reached 38%, yet dynamic export caps in high-renewables states redirected capital toward utility-scale solar-plus-storage.
The Middle East and Africa are set for a 21.5% CAGR, supported by Saudi Arabia’s 58.7 GW Vision 2030 roadmap and the UAE’s 5 GW Dubai park expansion. Saudi Arabia’s 1.5 GW Sudair plant achieved a record USD 0.0104 per kWh bid price. The UAE’s Noor Abu Dhabi now covers 10% of local demand and exports into the Gulf interconnector. South Africa awarded 3.2 GW in Bid Window 6 but postponed 1.8 GW due to grid constraints. Nigeria deployed 450 MW of mini-grids in 2025, extending service to 2.8 million people.
North America accounted for 12.8% of the solar photovoltaic market capacity in 2025. The United States added 32 GW, with Texas surpassing California in annual additions. Canada’s 30% clean-electricity tax credit stimulated 2.5 GW across Alberta and Ontario. Mexican rooftop deployment slowed amid net-metering uncertainty. Europe captured a 9.4% share; Germany installed 8.5 GW and Spain 6.2 GW under carbon-price pressures near EUR 90 per t CO₂. Brazil’s distributed-generation base hit 18 GW in 2025, retaining full retail credit for exports.

Regulatory Landscape
Policy and standards continue to shape demand and supply localization across major solar PV regions. In the United States, the Inflation Reduction Act framework (including Section 45X production tax credits) supports domestic manufacturing economics, while evolving eligibility conditions (such as rising domestic-content requirements and restrictions related to foreign entities of concern) affect procurement strategies and supply-chain routing for both utility and distributed projects.
In Europe, Renewable Energy Directive III (RED III) sets an implementation anchor by requiring member states to designate renewables go-to areas and streamline permitting, with timelines referenced at 12 months for projects in those areas. Across markets, bankability and safety compliance remain tied to IEC standards for modules (IEC 61215 and IEC 61730), and newer policy emphasis is shifting toward grid integration, curtailment management, and hybridization rules that support solar-plus-storage and tighter system control for distributed PV.
Competitive Landscape
The Solar PV market shows moderate concentration: the top 10 module vendors shipped around 70% of volumes in 2025, yet power prices remain limited as global capacity exceeds demand. Leaders are converting PERC lines to TOPCon or heterojunction to secure 24%–26% efficiencies and 10%–15% price premiums, while Longi and Trina scale perovskite partnerships to commercialize tandem modules before 2028. White-space niches include solar-plus-storage bundles for commercial customers, agrivoltaics, and floating PV integrators.
First Solar differentiates with cadmium-telluride modules immune to polysilicon swings, though its 16.4 GW capacity in 2025 remains small versus crystalline incumbents, limiting influence on global pricing. Indian manufacturers Adani Solar and Waaree Energies leverage subsidies to scale 10 GW each by 2027, challenging Chinese dominance in South Asia and the Gulf. U.S. entrants Toledo Solar and Ebon Solar rely on IRA credits to establish integrated supply chains, while Meyer Burger advances heterojunction lines in Germany after completing a 2024 restructuring. Competitive dynamics are expected to bifurcate between cost-optimized utility suppliers and technology leaders targeting premium applications, driving further consolidation among unintegrated producers during the next polysilicon downturn.
Solar Photovoltaic (PV) Industry Leaders
LONGi Green Energy Technology Co. Ltd.
Trina Solar Co. Ltd.
JinkoSolar Holding Co. Ltd.
JA Solar Technology Co. Ltd.
First Solar Inc.
- *Disclaimer: Major Players sorted in no particular order

Market Opportunities and Future Outlook
Hybridization and firming solutions are broadening the addressable use-cases for PV beyond energy-only delivery, especially where grid congestion and negative pricing constrain conventional offtake. Utility procurement is increasingly aligning with dispatchable renewable configurations, including Masdar reaching financial close in July 2026 on a 5.2 GW solar project paired with 19 GWh of storage in Abu Dhabi, and China Three Gorges commencing commercial trial operation in July 2026 of a 1 GW PV-plus-CSP hybrid facility in Hami. These project structures create room for module suppliers, storage integrators, and EPCs to support performance guarantees, grid-code compliance, and tighter controls.
Distributed and small-scale PV also offers a separate opportunity set, supported by self-consumption economics and the growing role of lifecycle services. With 2025 installations reported at 698 GW globally and small-scale PV investment exceeding large-scale PV investment by 28% in the same year, there is space for financing-led offerings, rooftop-plus-battery packages, and end-of-life recycling and takeback programs, particularly where safety and permitting requirements are tightening. At the same time, manufacturing localization programs (notably in the United States) and supply-chain diversification efforts provide openings for new domestic capacity, equipment, and materials suppliers to plug into shorter lead-time regional supply chains.
Recent Industry Developments
- May 2026: JinkoSolar and Masdar signed a 2 GW Tiger Neo module purchase agreement to support Abu Dhabi's Round-The-Clock renewable energy project. The deal links high-volume module supply to a flagship solar-plus-storage procurement model, reinforcing demand for high-efficiency N-type modules in firmed power applications.
- November 2025: First Solar announced a new 3.7 GW manufacturing facility in Gaffney, Cherokee County, South Carolina, with an investment of about USD 330 million and operations planned for the second half of 2026. The expansion strengthens US-based thin-film supply and aligns with domestic manufacturing incentives and buyer preferences for localized procurement.
- June 2024: California continued to implement NEM 3.0 export-credit reforms that reduced compensation for exported rooftop solar generation and shifted residential economics toward self-consumption. The policy design accelerated interest in pairing PV with batteries and home energy management systems, influencing equipment mix and installer offerings in one of the largest distributed-solar markets.


Research Methodology Framework and Report Scope
Market Definition and Coverage
For this study, the solar photovoltaic market is defined as solar PV installations measured in terms of installed capacity added and cumulative installed base, tracked across major end-use settings and geographies.
Scope exclusions: We do not count the value of electricity sold, renewable credits, or downstream power trading income as part of this market size.
Segmentation Overview
- By Technology
- Monocrystalline-Si
- Multicrystalline-Si
- Thin-film (CdTe, CIGS, a-Si)
- Tandem/Perovskite
- By Deployment Type
- Ground-mounted
- Rooftop/Building-Integrated (BIPV)
- Floating PV
- By End-User
- Residential
- Commercial and Industrial
- Utility-scale IPPs
- By Geography
- North America
- United States
- Canada
- Mexico
- Europe
- Germany
- United Kingdom
- France
- Italy
- Russia
- Rest of Europe
- Asia-Pacifc
- China
- India
- Japan
- South Korea
- ASEAN Countries
- Australia
- Rest of Asia-Pacifc
- South America
- Brazil
- Argentina
- Rest of South America
- Middle East and Africa
- Saudi Arabia
- United Arab Emirates
- South Africa
- Nigeria
- Rest of Middle East and Africa
- North America
Data Sources, Market Sizing, and Validation
Desk Research
Desk research was used to build the starting dataset for PV capacity and the policy and grid signals that usually explain why installations rise or slow down. We referred to public and official sources such as IEA PVPS publications, IRENA renewable statistics, World Bank macro indicators, UN Comtrade trade statistics for PV-related categories, and national energy agencies and regulators that publish installed capacity and auction outcomes.
Alongside this, we reviewed company annual reports, investor presentations, and project announcements to sense-check deployment pipelines and technology shifts. A paid subscription for company financials and intelligence was used selectively to map supply-side context and to avoid double counting across integrated players. These desk inputs were then carried into interviews, and the list above is illustrative only, since additional sources were also used for data collection, validation, and clarification.
Primary Interviews and Surveys
Primary work was done through expert interviews and structured surveys across developers, EPC participants, component suppliers, utilities, financiers, and policy and grid specialists who track connection timelines and tender volumes. Since this is a global market, responses were balanced across APAC, EMEA, and the Americas, so assumptions on annual additions, curtailment risk, and permitting timelines could be checked across very different markets.
Distribution of primary research fieldwork respondents
| Company type | Respondent position | Region |
|---|---|---|
| Top tier: 35% | CXOs: 22% | APAC: 43% |
| Mid tier: 43% | Functional/Unit leaders: 33% | EMEA: 32% |
| Smaller Players: 22% | Managers: 45% | Americas: 25% |
Market-Sizing & Forecasting
Sizing starts from a top-down rebuild of PV demand using country-level installed-capacity series, annual additions, and commissioning timelines, then mapped into a consistent global installed base in GW and TW. Selective bottom-up checks are then used to confirm direction and magnitude, such as sampled project pipeline rollups, channel checks on shipment trends, and sanity checks using typical module and inverter capacity-to-unit relationships.
Key practical inputs for this market include annual PV additions (GW), cumulative installed base (GW or TW), utility-scale auction and tender awards, rooftop permitting and interconnection time, grid congestion and curtailment signals, and typical project realization lags from award to commissioning. Forecasts are built using scenario analysis supported by expert views, where drivers such as policy continuity, interest rates, supply availability, and grid connection capacity are varied to keep the outlook realistic. Where bottom-up indicators are missing for smaller countries, gaps are handled by using regional installation shares and adjusting them with stated national targets and recent year build rates.
Data Validation & Update Cycle
Outputs are validated by comparing the modeled installed base and annual additions against independent signals, including published capacity statistics, commissioning announcements, and trade flow directionality. Any outliers, step changes, or country totals that break historical patterns are reviewed again, and follow-up calls are triggered when a single assumption drives a large share of the change.
Before sign-off, the model is checked by another analyst for arithmetic integrity, unit consistency (GW versus TW), and country-to-region rollups. The report is refreshed annually, and interim updates are made when major policy shifts, large tender cycles, or supply disruptions materially change near-term installations. Prior to delivery, a fresh review pass is completed so clients receive the latest updated view.
Mordor Intelligence's Solar Photovoltaic Market Sizing Compared With Other Published Estimates
Different published estimates for solar PV can look far apart because they sometimes measure different things, even when the titles sound similar. The biggest split usually comes from whether the number is tracking installed capacity (GW or TW) or tracking market value in USD, and then from how services and downstream revenue are treated.
The table shows that the baseline is stated in TW of installed capacity, and in Mordor Intelligence's model the market is sized as PV installed base rather than counting equipment revenues or electricity generation income, which is why revenue-based estimates land on much larger USD figures for the same broad industry.
Benchmark comparison
| Source | Market Size | Gaps in Research Methodology |
|---|---|---|
| Mordor Intelligence | USD 2.34 T (2025) | |
| Global Consultancy A | USD 604.02 B (2024) | Uses a revenue definition for photovoltaics, so it captures equipment and related value streams rather than a capacity metric, and the base year also differs. |
| Trade Publisher B | USD 331.60 B (2024) | Represents Solar PV market value in USD and may bundle system components and services, which is not directly comparable with an installed-capacity installed-base figure. |
Taken together, the spread is mainly a unit and scope issue, not a simple disagreement on growth direction. By keeping the sizing tied to installed-capacity signals and then checking country rollups against independent deployment indicators, the estimate stays traceable to steps that can be repeated during updates.


Key Questions Answered in the Report
How large is global installed solar panel capacity in 2026?
Installed capacity reached 2,916.85 GW in 2026 and is projected to climb to 7,233.35 GW by 2031, implying a 19.92% CAGR over the forecast period.
Which cell architecture is advancing fastest after 2025?
Tandem perovskite–silicon technology is forecast to post a 31.1% CAGR to 2031 as commercial modules surpass 24% efficiency and secure long-term durability certifications.
What policy measure is driving new photovoltaic manufacturing in the United States?
Section 45X production tax credits under the Inflation Reduction Act pay up to USD 0.07 per watt-dc for modules and are linked to more than USD 10 billion of announced factory investments.
Why are floating solar projects gaining popularity in Asia?
Water-based arrays boost output 5–10% through evaporative cooling, avoid land-acquisition hurdles, and qualify for dedicated renewable targets in China, India, and Singapore.
How quickly are residential solar installations growing in the United States?
Residential installations are expected to expand at a 22.7% CAGR through 2031, supported by the 30% federal investment tax credit and rising grid electricity prices.
Page last updated on:






