
Solar Photovoltaic Glass Market Size and Share
Market Overview
| Study Period | 2021 - 2031 |
|---|---|
| Market Volume (2026) | 32.24 Million tons |
| Market Volume (2031) | 75.08 Million tons |
| Growth Rate (2026 - 2031) | 18.42 % |
| Fastest Growing Market | Asia Pacific |
| Largest Market | Asia Pacific |
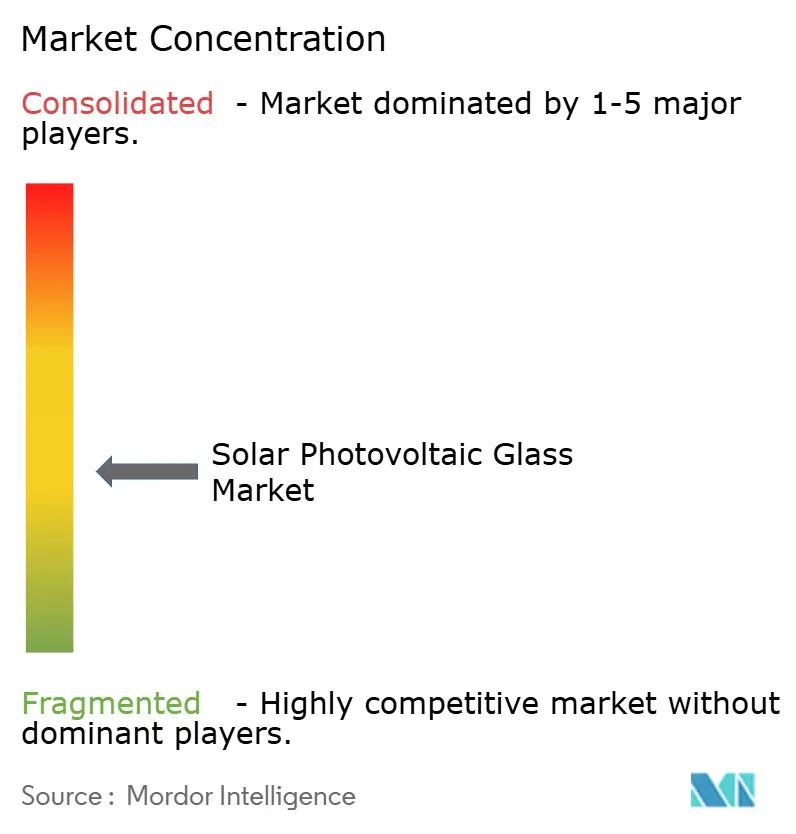
| Market Concentration | Medium |
Major Players *Disclaimer: Major Players sorted in no particular order Image © Mordor Intelligence. Reuse requires attribution under CC BY 4.0. | |
Solar Photovoltaic Glass Market Analysis by Mordor Intelligence
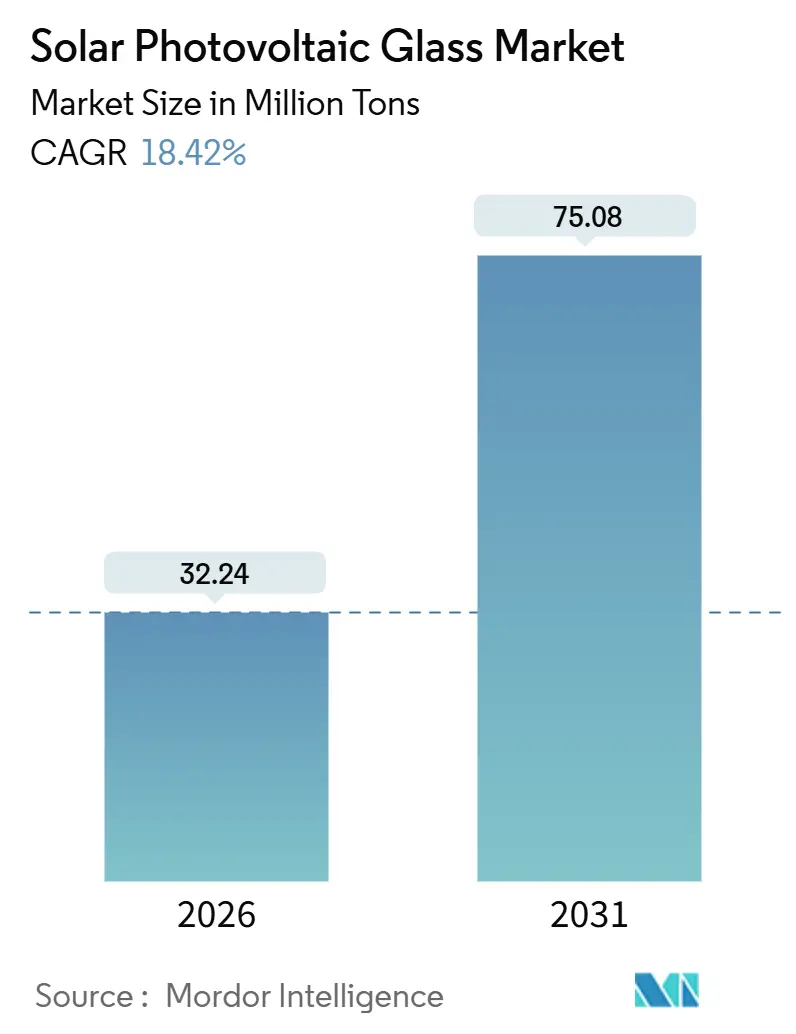
The Solar Photovoltaic Glass Market size is estimated at 32.24 Million tons in 2026, and is expected to reach 75.08 Million tons by 2031, at a CAGR of 18.42% during the forecast period (2026-2031). Government-mandated local-content rules, anti-dumping measures, and targeted tax credits are catalyzing regional capacity additions, even as global module oversupply intermittently depresses prices. Trade barriers in India and incentive packages in the United States have reshaped procurement economics, pushing float-line investments onshore and fracturing a once-global supply chain. Technology shifts toward bifacial, glass-glass, and thin-film modules are doubling per-watt glass intensity in certain projects, while recycled-cullet mandates in Europe add a parallel source of volume growth. Competitive dynamics are intensifying as module makers backward-integrate to secure margin and supply certainty, widening the strategic gap between scale-driven Asian leaders and policy-sheltered North American entrants.
Key Report Takeaways
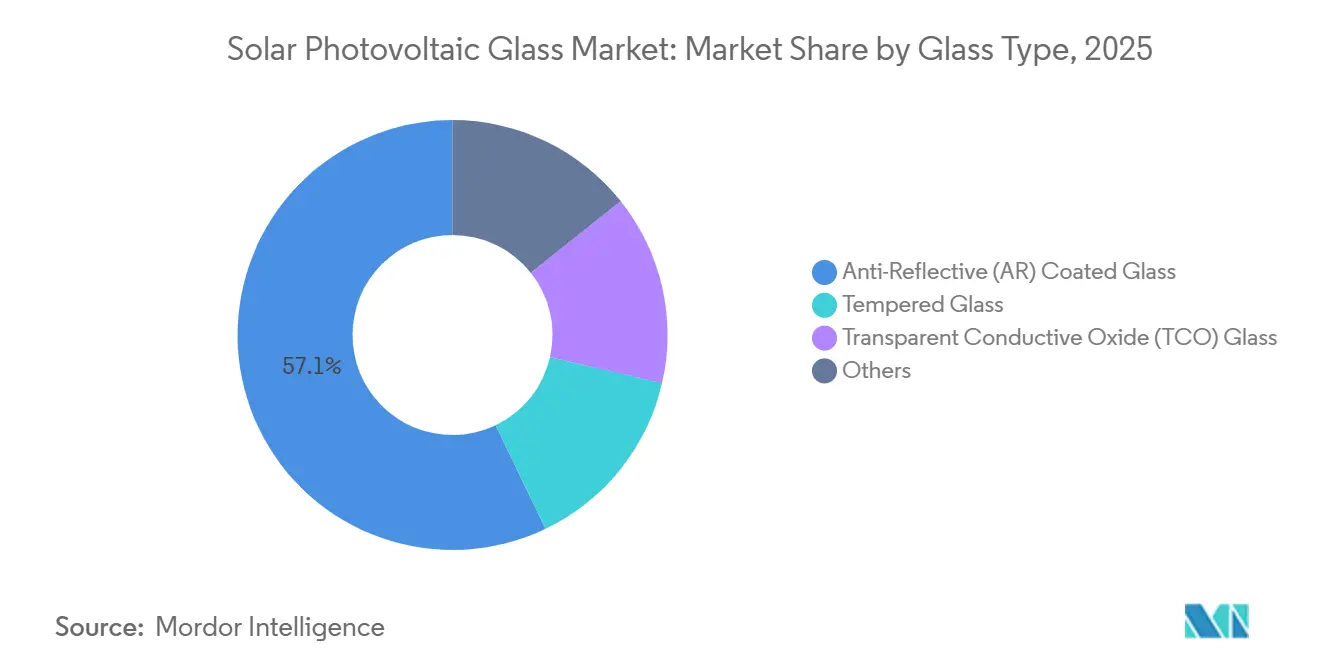
- By glass type, anti-reflective coated glass led with 57.12% of the solar photovoltaic glass market share in 2025, while transparent conductive oxide glass is projected to grow at a 22.43% CAGR to 2031.
- By manufacturing process, float-line production accounted for 67.78% of the solar photovoltaic glass market size in 2025, and rolled glass is set to advance at a 19.56% CAGR through 2031.
- By solar technology, crystalline silicon captured 90.90% of demand in 2025, whereas CIGS is forecast to post the fastest 23.42% CAGR by 2031.
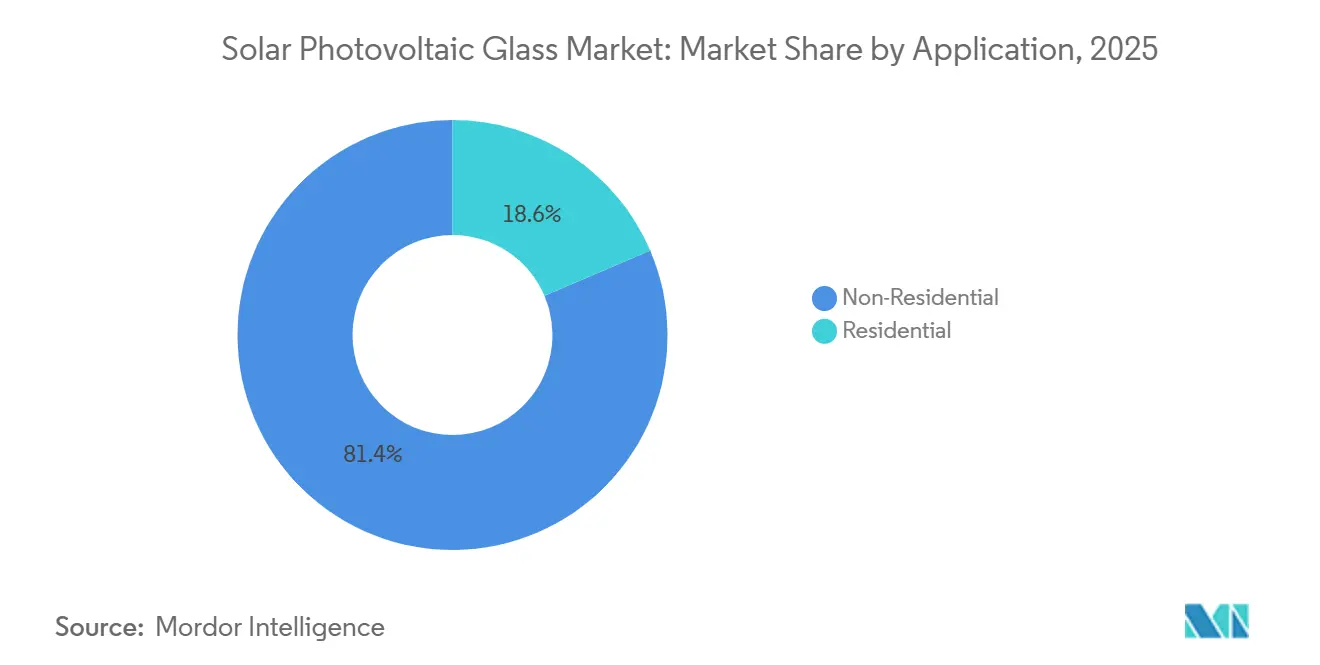
- By application, non-residential installations commanded 81.43% of volume in 2025 and are expected to maintain an 18.78% CAGR over the forecast period.
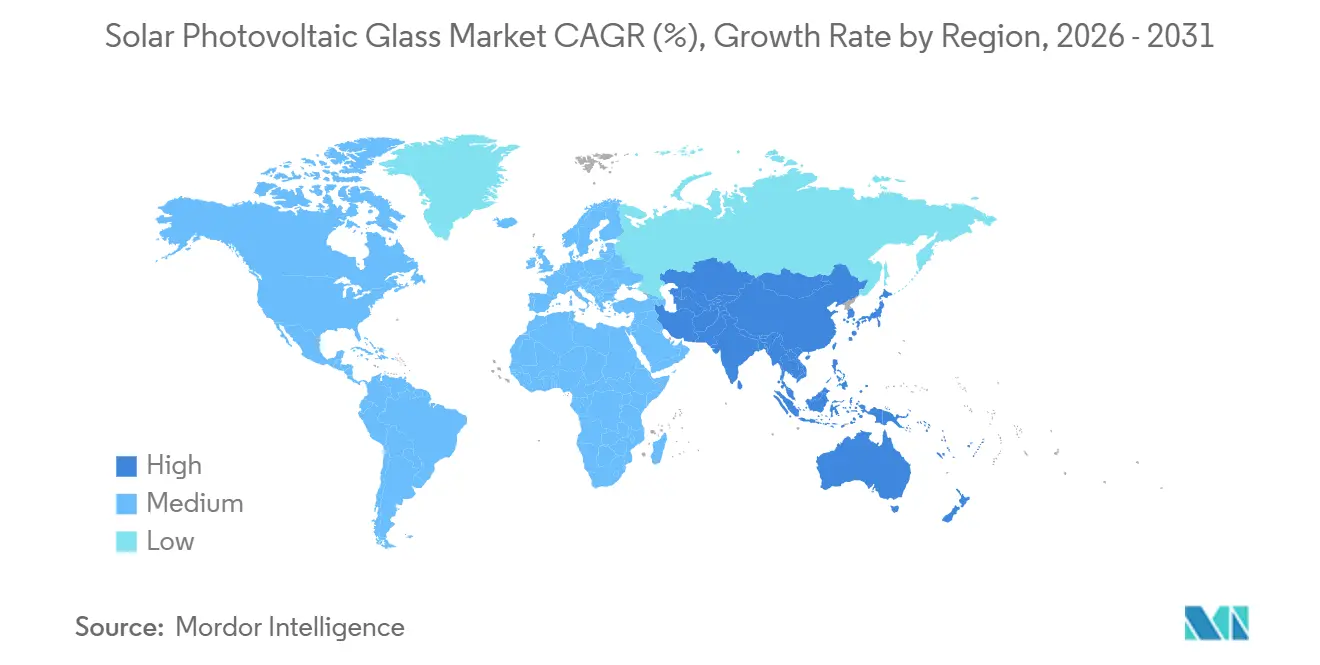
- By geography, Asia-Pacific dominated with 61.14% of the 2025 volume and is poised to expand at a 19.34% CAGR, the highest regional growth rate.
Note: Market size and forecast figures in this report are generated using Mordor Intelligence’s proprietary estimation framework, updated with the latest available data and insights as of January 2026.
Market Trends and Insights
Drivers Impact Analysis of Solar Photovoltaic Glass Market*
| Drivers | (~) % Impact on CAGR Forecast | Geographic Relevance | Impact Timeline |
|---|---|---|---|
| Government-mandated solar-glass quotas in Asia | +4.2% | China, India, ASEAN spill-over | Medium term (2-4 years) |
| Rapid build-out of ultra-low-iron float lines in MENA | +3.1% | Saudi Arabia, UAE, Egypt | Long term (≥4 years) |
| Rising adoption of bifacial and glass-glass modules | +3.8% | Global, led by APAC and North America | Short term (≤2 years) |
| Inflation Reduction Act-fuelled U.S. reshoring | +2.7% | United States | Medium term (2-4 years) |
| Circular-economy demand for recycled glass | +1.9% | EU core, Japan pilots | Long term (≥4 years) |
| Source: Mordor Intelligence | |||
Government-Mandated Solar-Glass Quotas in Asia
Local-content quotas in China and India are pulling furnace capacity back onshore after a decade of offshoring that favored lower-cost Southeast Asian hubs. India’s Directorate General of Trade Remedies imposed anti-dumping duties of USD 570–664 per ton on Chinese and Vietnamese imports in December 2024, instantly reversing landed-cost advantages for overseas suppliers. Simultaneously, China’s Ministry of Industry and Information Technology issued draft rules in mid-2025 requiring that at least 60% of a module’s glass be sourced within provincial borders, supporting employment in traditional glass-producing provinces[1]. These measures shorten logistics chains, shelter domestic producers from import competition, and accelerate furnace-build decisions even during periods of soft module demand. Capacity growth decoupled from end-market fundamentals in late 2025, creating periodic regional oversupply but sustaining the overall solar photovoltaic glass market growth curve. Although logistics costs have risen, local players benefit from secure off-take and policy-driven margins.
Rapid Build-Out of Ultra-Low-Iron Float Lines in Middle-East and North Africa
Saudi Arabia, the United Arab Emirates, and Egypt are exploiting low-cost gas and strong solar resources to establish export-ready float-line clusters. ACWA Power’s 2 GW Al Dhafra project in Abu Dhabi demonstrated regional self-sufficiency by sourcing tempered glass from nearby furnaces in 2025. Riyadh’s Public Investment Fund earmarked USD 500 million for a 1,000-ton-per-day plant at Jubail, with commissioning set for 2026. Egypt’s New and Renewable Energy Authority signed an MoU with Şişecam in 2025 to study a Suez-adjacent line aimed at European offtakers. These investments promise a structurally lower cash cost due to feedstock energy economics but face execution risks tied to equipment lead times and offtake agreements. If schedules slip, capital may be stranded in a market already contending with module oversupply, underscoring the importance of synchronized downstream demand.
Rising Adoption of Bifacial and Glass-Glass Modules
Utility-scale developers are flocking to bifacial and glass-glass architectures that boost yield and extend module life. Bifacial penetration reached 35% of 2025 installations, particularly in high-albedo deserts and snow-covered regions, effectively doubling glass demand per watt[2]. First Solar’s Series 7 dual-glass CdTe module logged a degradation rate below 0.4% per year, reinforcing investor appetite for long-dated cash flows. The shift is asymmetric; residential installers still favor lighter polymer backsheets, creating planning complexity for glass suppliers. Nevertheless, expanded bifacial uptake is set to add incremental volume even if overall module growth moderates, bolstering solar photovoltaic glass market momentum.
Inflation Reduction Act-Fuelled United States PV-Glass Reshoring
Section 45X of the Inflation Reduction Act delivers a USD 0.40 per m² production tax credit for domestic solar glass, flipping the investment calculus for U.S. float lines. First Solar’s USD 1.1 billion expansion across Ohio and Alabama in 2024 added 3.3 GW of modules and integrated TCO glass lines. Guardian Industries followed in early 2025, committing to retrofit its Kingsburg, California furnace for ultra-low-iron output. While incentives bridge the cost gap, the United States faces skills shortages in furnace operations and an 18-month lead time for critical refractories, delaying ramp-ups. Treasury guidance issued in mid-2025 further clarifies that only glass melted and tempered domestically qualifies, ensuring new capacity rather than partial finishing.
Restraints Impact Analysis of Solar Photovoltaic Glass Market*
| Restraints | (~) % Impact on CAGR Forecast | Geographic Relevance | Impact Timeline |
|---|---|---|---|
| Soda-ash and energy-price volatility | -1.8% | Global, acute in Europe and Turkey | Short term (≤2 years) |
| Capital-intensive furnace conversion to low-carbon fuels | -1.4% | EU, North America, Japan | Long term (≥4 years) |
| Hail-damage risk to thin heat-strengthened glass | -0.9% | North America, Australia, Brazil | Medium term (2-4 years) |
| Source: Mordor Intelligence | |||
Soda-Ash and Energy-Price Volatility
Soda ash made up 12-15% of raw-material costs in 2025 and spiked 38% Y/Y when natural-gas curtailments shuttered Turkish and Chinese plants. Glass furnaces themselves rely heavily on gas; European operators saw TTF prices average EUR 45/MWh in H1 2025, triple the long-term norm. Spanish and Italian lines opted for maintenance shutdowns over operating at negative margins, while Chinese mills, sheltered by state-controlled pricing, widened their cost advantage. Volatility compresses cash flows and delays investment decisions, tempering but not derailing the solar photovoltaic glass market expansion.
Capital-Intensive Furnace Conversion to Low-Carbon Fuels
Hydrogen-fueled or electric furnaces cost USD 80–120 million per 600-TPD line, a hurdle that only the largest players can cross ahead of Europe’s 2027 Carbon Border Adjustment Mechanism. Schott’s pilot hydrogen furnace cut Scope 1 emissions by 70% but reduced campaign life from 12 to 8 years due to refractory wear. NSG’s electric pilot in Japan ran at a 15% cost premium when grid prices topped JPY 20/kWh (USD 0.13/kWh). The technology pathway is proven but capital-heavy, making timing contingent on regulatory clarity and green hydrogen availability.
*Our forecasts treat driver/restraint impacts as directional, not additive. The impact forecasts reflect baseline growth, mix effects, and variable interactions.
Solar Photovoltaic Glass Market Segment Analysis
By Glass Type:
Coatings Enhance Yield, TCO AcceleratesAnti-reflective coated glass held 57.12% of 2025 volume, cementing its role as the performance baseline for crystalline-silicon modules. Transparent conductive oxide glass, though a smaller slice of the solar photovoltaic glass market size, is set for a rapid 22.43% CAGR as thin-film demand scales. Tempered substrates continue in rooftop markets because building codes emphasize impact resistance, but growth is slower as utility projects shift to lighter heat-strengthened variants. First Solar’s inline-TCO float process trims production time by 15%, making vertically integrated CdTe lines less exposed to spot glass pricing.
Premium dual-layer AR coatings from AGC cut reflectance below 1%, translating into module-level efficiency gains of up to 0.5 percentage points. The coating space is bifurcating: tier-one manufacturers pay USD 2-3/m² extra for anti-soiling layers, while price-sensitive developers opt for uncoated glass. Specialty products for agrivoltaics and building-integrated photovoltaics, including semi-transparent options, form niche avenues that lift overall value per ton, reinforcing the solar photovoltaic glass market growth narrative.

By Manufacturing Process:
Float Leads, Rolled ReboundsFloat-line technology controlled 67.78% of 2025 output owing to superior flatness (<0.1 mm/m) critical for high-efficiency cells. Rolled glass, historically confined to thin film, is forecast to rise at a 19.56% CAGR as CdTe and CIGS lines multiply. A solar photovoltaic glass market size advantage stems from float’s scale economics - Xinyi operates 14 lines with cash costs below USD 180/ton - but its 24/7 nature locks in high fixed energy demand. Rolled production offers demand-responsive flexibility and textured surfaces that aid light trapping, narrowing the quality gap through automated thickness control systems.
Guardian’s retrofitted Kingsburg float line aims to tap domestic-content premiums in the United States, showing policy can offset float operating rigors. Meanwhile, Taiwan Glass is tightening rolled-glass tolerance to ±0.15 mm, making it suitable for bifacial modules. Incremental process shifts could redistribute share but leave float structurally dominant through 2031.
By Solar Technology:
Crystalline Dominates, CIGS SurgesCrystalline silicon absorbed 90.90% of glass tonnage in 2025, supported by wafer cost deflation and entrenched supply chains. CIGS, off a low base, is projected at a 23.42% CAGR as flexible form factors open portable and building-integrated avenues. Cadmium-telluride modules require proprietary TCO glass, providing First Solar with captive demand and pricing insulation. Emerging perovskite-silicon tandems, such as Hanwha Q CELLS’ 28%-efficient pilot, may shift specifications toward alternative substrates, but commercialization remains post-2027. For now, crystalline expansion anchors the solar photovoltaic glass market share, while niche thin-film gains diversify the product mix.
By Application:
Utility-Scale Non-Residential Drives VolumeNon-residential projects represented 81.43% of 2025 demand and are forecast to maintain an 18.78% CAGR through 2031. Utility-scale farms favor 2.0 mm bifacial glass to cut material usage, reinforcing volume leadership. Commercial rooftops and industrial facilities add steady but smaller demand streams under corporate decarbonization mandates. Residential uptake grows from a lower base yet is tempered by higher financing costs. Specialized segments such as agrivoltaics require semi-transparent coatings, and floating solar relies on moisture-resistant glass, both adding differentiated demand pockets that keep overall solar photovoltaic glass market growth broad-based.
Geography Analysis
APAC Solar Photovoltaic Glass Market
Asia-Pacific held 61.14% of global volume in 2025 and is on pace for a 19.34% CAGR, the fastest regional climb. China’s Xinyi and CSG operated more than 32,000 TPD of capacity but paused new furnace ignitions in early 2026 as glass prices dipped below cash cost. India’s December 2024 anti-dumping duties triggered domestic expansions by Borosil Renewables and HNG Float Glass, insulating the local solar photovoltaic glass market from import pressure. Japan and South Korea remain smaller in tonnage yet focus on high-efficiency TCO lines linked to tandem-cell research and development. Southeast Asian exporters, once cost leaders, now face margin pressure from rising protectionism in end-markets.
North America Solar Photovoltaic Glass Market
North America records a lower absolute share but commands the steepest percentage capacity growth because of Section 45X credits. First Solar’s Ohio and Alabama complexes, plus Guardian’s California retrofit, anchor a reshoring wave that rewards integrated players with bonus tax incentives. Canada’s upcoming 5 GW module plant by Canadian Solar will source glass domestically, while Mexico positions itself for nearshore supply into the United States under USMCA rules. Lead-time advantages and content bonuses collectively underpin a differentiated solar photovoltaic glass market strategy versus import-heavy models.
EMEA and South America Solar Photovoltaic Glass Market
Europe’s share was relatively low in 2025 as high gas prices shuttered several legacy lines; TTF futures averaged EUR 45/MWh in the first half, triple historical norms. Innovation persists, however: Saint-Gobain-Veolia’s Lyon recycling facility and Schott’s hydrogen-fired pilot furnish technology leadership and align with the EU’s 2027 Carbon Border Adjustment Mechanism. Central European rolled-glass makers struggle against Asian imports even after tariffs, pointing to consolidation ahead. South America and Middle East and Africa remain growth frontiers, with Saudi Arabia’s 1,000-TPD Jubail line and Brazil’s BNDES-backed São Paulo project underscoring policy-driven localization pushes that extend the global solar photovoltaic glass market footprint.
Value Chain Analysis
The upstream stack centers on ultra-clear, low-iron inputs (silica sand, soda ash, limestone/dolomite) and recycled cullet, with energy (natural gas/electricity) and furnace refractories acting as key operating and maintenance dependencies. Material and process additives broaden the PV-glass supply base: anti-reflective coatings are applied via sol-gel or sputtering, while thin-film routes tie demand to transparent conductive oxide (TCO) deposition and other high-spec surface treatments. Adjacent consumables such as silver-paste glass frits also connect cell-side efficiency work back into glass selection and encapsulation requirements.
Midstream production is dominated by capital-intensive float and rolled lines (high-temperature melting followed by forming, tempering/heat-strengthening, and coating). Quality control for thickness and flatness, as well as optical transmission, shapes yields and drives contract qualification with module makers. Downstream channels run primarily through long-term supply agreements and direct shipments to module factories and integrated producers, with trade and domestic-content programs accelerating regionalized supply chains, notably in the United States, India, and parts of Asia. Recent U.S. actions also show how glass, technology, and module assembly are becoming more tightly linked, including a five-year, 3 GW Solx and Caelux partnership (April 2026) to integrate perovskite energy-producing glass into Solx platforms and Stewart Glass plans to add a second line at its Ohio solar glass facility (May 2026). Together, these moves reinforce localized qualification, simplify logistics, and support co-development across glass and module ecosystems.
Competitive Landscape
The global solar photovoltaic glass market is moderately fragmented. Backward integration by module makers intensifies rivalry, as illustrated by Hanwha Solutions’ 1,200-TPD Korean float line commissioned in 2024. Asian incumbents chase economies of scale, squeezing cash costs below USD 180/ton, while U.S. entrants monetize policy premiums and reduced freight. European producers differentiate through decarbonization credentials and recycled-content compliance, preserving margin in a high-cost energy environment. Technology is an emerging moat. First Solar’s inline fluorine-doped tin-oxide deposition eliminates a sputter step and trims cycle time 15%, securing IP-driven margins. AGC’s dozen dual-layer AR patents filed since 2024 spotlight a pivot to coating innovation. Disruptors like Onyx Solar and Interfloat exploit specialty niches (semi-transparent façades and low-cost rolled thin-film substrates) that sit outside volume-centric battles yet expand overall solar photovoltaic glass market diversity. Capital intensity remains a hurdle; new 600-TPD lines need USD 80–120 million, limiting entrants to players with balance-sheet strength or policy support. Consolidation talk heightened in 2025 after soda-ash price spikes compressed margins for second-tier independents, indicating room for mergers.
Solar Photovoltaic Glass Industry Leaders
-
Xinyi Solar Holdings Limited
-
Flat Glass Group Co. Ltd.
-
AGC Inc.
-
CSG Holding Co. Ltd.
-
Saint-Gobain
- *Disclaimer: Major Players sorted in no particular order
Solar Photovoltaic Glass Market Companies Covered in this Report
- AGC Inc.
- Borosil Renewables
- CSG Holding Co. Ltd.
- First Solar
- Flat Glass Group Co. Ltd.
- Guardian Industries
- Hainan Development Holdings (Nanhai) Co. Ltd.
- Hanwha Group
- Interfloat Corporation
- Irico Group New Energy Co. Ltd.
- Jinjing Group Co. Ltd.
- Kaneka Energy Management Solutions
- Nippon Sheet Glass Co. Ltd.
- Onyx Solar Group LLC
- Saint-Gobain
- Schott Solar Glass AG
- Sisecam
- Taiwan Glass Ind. Corp.
- Vitro
- Xinyi Solar Holdings Limited
Market Opportunities and Future Outlook
White space is widening where policy and standards pull procurement toward localized, PV-specific glass supply and building-integrated requirements. In India, capacity additions tied to post-December 2024 trade protection are translating into specific projects, including Waaree Energies development of a USD 415 million solar glass facility under Waaree Green Glass targeting 2,500 tons per day (March 2026) and Borosil Renewables foundation work to add 600 tons per day in Gujarat, with commissioning scheduled between October and December 2026 (May 2025). In the United States, announced expansions such as Stewart Glass adding a second production line at Logan, Ohio (May 2026, with ramp milestones disclosed into 2027) create a clearer path for module manufacturers and developers seeking domestic-content compliance and shorter lead times.
At the product level, opportunity is concentrating in higher-specification formats that raise value per ton, including thinner ultra-clear glass (2.0-3.2 mm), dual-layer anti-reflective and anti-soiling coatings for bifacial and glass-glass modules, and TCO-coated substrates that support thin-film and emerging tandem architectures. Standards development is also shaping a more defined route for building-integrated photovoltaics (BIPV) glass: China issued GB/T 29759-2026 for insulating solar PV glass units in buildings (May 2026, implemented December 1, 2026), and pre-normative work in IEA-PVPS Task 15 covers building-code integration topics such as safety, glare, and test methods. As a result, unmet needs are shifting from commodity cover glass toward qualified building-grade PV glazing, domestic supply assurance, and co-engineered glass solutions aligned with next-generation module designs.
Recent Industry Developments in Solar Photovoltaic Glass Market
- April 2026: Xinyi Solar confirmed that the second solar glass production line at its Indonesia facility is slated to begin production in Q2 2026. The added line strengthens its Southeast Asia footprint and provides an alternative supply base for customers navigating evolving trade and local-content constraints.
- February 2026: Flat Glass Group approved and participated in a CNY 50 million funding injection for Shanghai Fulai Ruicheng New Materials Co., Ltd. The funding supports materials capability building adjacent to PV manufacturing inputs, aligning the company with higher-value materials and process upgrades tied to next-generation module requirements. The funding also highlights Flat Glass Group's active role in expanding domestic materials capacity to serve evolving PV manufacturing demands.
- January 2026: Xinyi Solar ignited its first 1,200 tonnes per day photovoltaic glass furnace at the new facility in the JIIPE Special Economic Zone, Indonesia. Starting up a large-scale furnace expands export-ready capacity outside China and helps diversify production risk across geographies.
Solar Photovoltaic Glass Market Report Scope and Research Methodology
Market Definition and Coverage
For this study, the solar photovoltaic glass market covers PV-grade glass used as a functional cover or substrate in solar modules, where glass properties directly affect module power output and operating lifetime.
Scope exclusions: We exclude general flat glass sold for buildings or vehicles when it is not specified for photovoltaic module use, and we also exclude non-PV architectural glazing that only supports solar control.
Segments Covered in This Report
- By Glass Type
- Tempered Glass
- Anti-Reflective (AR) Coated Glass
- Transparent Conductive Oxide (TCO) Glass
- Others
- By Manufacturing Process
- Float Glass
- Rolled Glass
- By Solar Technology
- Crystalline Silicon
- Cadmium-Telluride (CdTe) Thin Film
- Amorphous Silicon (a-Si)
- Copper-Indium-Gallium-Diselenide (CIGS)
- Other Technologies
- By Application
- Residential
- Non-Residential
- Commercial
- Industrial/Institutional
- Other Applications
- By Geography
- Asia-Pacific
- China
- India
- Japan
- South Korea
- Rest of Asia-Pacific
- North America
- United States
- Canada
- Mexico
- Europe
- Germany
- United Kingdom
- France
- Italy
- Spain
- Netherlands
- Rest of Europe
- South America
- Brazil
- Argentina
- Rest of South America
- Middle-East and Africa
- Saudi Arabia
- United Arab Emirates
- Turkey
- South Africa
- Egypt
- Rest of Middle-East and Africa
- Asia-Pacific
Data Sources, Market Sizing, and Validation
Desk Research
Desk research was used to set the base model structure, then to keep each assumption tied to observable signals. We relied on public sources such as International Energy Agency (IEA) solar PV installation series, UN Comtrade trade statistics for glass and PV-related categories, USGS mineral and materials references for glass inputs, and International Renewable Energy Agency (IRENA) renewable capacity additions.
To narrow the market boundary, we also reviewed sources such as customs and tariff notices, government energy ministry releases, and technical publications that describe PV module formats and glass intensity by design (for example, glass-glass and bifacial adoption). Company annual reports, investor presentations, and reputable press were then used to sanity-check capacity additions, plant ramp timelines, and pricing direction. Where helpful, we used paid subscriptions for company financials and intelligence, patent databases, and shipment-level import and export datasets to verify directional movement, while keeping the final model independent of any single source. The sources listed above are illustrative, and additional public references were used for collection, validation, and clarification.
Primary Interviews and Surveys
Primary work focused on interviews and short surveys with people across the PV glass and module value chain, including manufacturing, sales, procurement, project engineering, and distribution. We used these discussions to confirm glass thickness trends, the pace of bifacial and glass-glass module uptake, typical contract terms, and how pricing resets across regions, which then informed adjustments to secondary assumptions.
Distribution of primary research fieldwork respondents
| Company type | Respondent position | Region |
|---|---|---|
| Top tier: 37% | CXOs: 15% | APAC: 51% |
| Mid tier: 41% | Functional/Unit leaders: 30% | EMEA: 31% |
| Smaller Players: 22% | Managers: 55% | Americas: 18% |
Market-Sizing & Forecasting
The market was sized using a top-down build that reconstructs PV glass demand from solar PV deployment and module design intensity, then converts it into glass volumes and values. In practice, we mapped regional PV additions to module output, then translated that output into glass requirements using indicators such as the mix of glass-glass versus glass-backsheet modules, bifacial penetration, typical glass thickness ranges, and average module wattage trends.
After forming the demand pool, we applied average selling prices using explicit rules so the value line remained consistent, particularly when energy and soda ash costs move and when new capacity ramps up. Primary inputs were used to guide how quickly prices reset in contracts, how fast thickness is shifting, and where quality premiums are persisting. We then corroborated the results with selective bottom-up approximations, such as sampled capacity and utilization checks for PV glass lines, channel checks on lead times, and a limited ASP times volume cross-check. Where coverage was incomplete, gaps were handled by assigning conservative utilization and import-reliance assumptions.
Forecasting was built with scenario analysis using trend-linked inputs, so demand is not projected as a straight line. Variables stress-tested in the model include the utility-scale versus rooftop mix, policy-led installation momentum, the timing and ramp curves of float line expansions, and trade friction that changes import share by region.
Data Validation & Update Cycle
Validation is done in layers so totals do not drift from real market signals. We compare model outputs against independent checkpoints such as regional solar installation trends, glass capacity announcements, and observed price direction, then review outliers before sign-off.
When a variance is material, we re-check the assumptions driving it and re-contact relevant experts to determine whether the change is structural or temporary. Reports are refreshed annually, with interim updates when major policy changes, capacity disruptions, or pricing shocks occur. Prior to delivery, a final analyst review is completed so clients get the latest updated view.
Mordor Intelligence's Solar Photovoltaic Glass Market Size Measured Against Other Published Estimates
It is normal to see different market sizes for solar photovoltaic glass, even when the scope sounds identical. The differences usually come from how the market is defined, whether estimates are reported in value or volume, and how prices and adoption shifts are handled across regions.
Key gap drivers are typically the treatment of glass intensity per module (especially glass-glass formats), the point in time used for currency and pricing, and whether the estimate counts PV-specific glass only or also includes adjacent glazing uses. By tracking module-format mix and updating PV glass pricing resets by region, Mordor Intelligence keeps the market total aligned to PV-grade glass consumption signals rather than broader flat-glass revenue pools.
Benchmark comparison
| Source | Market Size | Gaps in Research Methodology |
|---|---|---|
| Mordor Intelligence | USD 0.00 B (2026) | |
| Global Consultancy A | USD 10.08 B (2024) | Uses a revenue-first lens with a 2024 base year, and the scope can be wider if it includes PV glass used in broader building-integrated applications, which can lift the value total versus PV-grade module glass only. |
| Industry Publisher B | USD 10.30 B (2024) | Anchors sizing in value terms for 2024 and extends forecasts to 2032, with outcomes highly sensitive to assumed price expansion and long-run adoption speed for bifacial and glass-glass modules. |
The spread in published values is mainly explained by scope boundaries and how prices are rolled forward when capacity expands quickly. Our approach stays traceable because each sizing step links installation-driven demand, module design intensity, and region-level price setting that can be re-checked as conditions change.
Key Questions Answered in the Report
What is the projected size of the solar photovoltaic glass market by 2031?
The market is expected to reach 75.08 million tons by 2031, expanding from 32.24 million tons in 2026.
How fast is demand for transparent conductive oxide glass growing?
TCO glass is forecast to register a 22.43% CAGR between 2026 and 2031, the fastest among glass types.
Which region will add capacity most quickly over the forecast period?
Asia-Pacific will maintain the highest absolute volume, while North America posts the steepest percentage growth due to U.S. tax incentives.
How are policy measures influencing glass manufacturing locations?
Anti-dumping duties in India, local-content quotas in China, and U.S. Section 45X tax credits are driving a shift toward regionalized, onshore float-line investments.
What technology trends are changing glass demand intensity?
Wider adoption of bifacial and glass-glass modules is roughly doubling glass usage per watt in many utility-scale projects, boosting overall volume growth.
What is the biggest cost challenge facing producers today?
Volatility in soda-ash and natural-gas prices compresses margins, especially in Europe, where energy costs remain elevated.