
Software Defined Networking Market Size and Share
Market Overview
| Study Period | 2020 - 2031 |
|---|---|
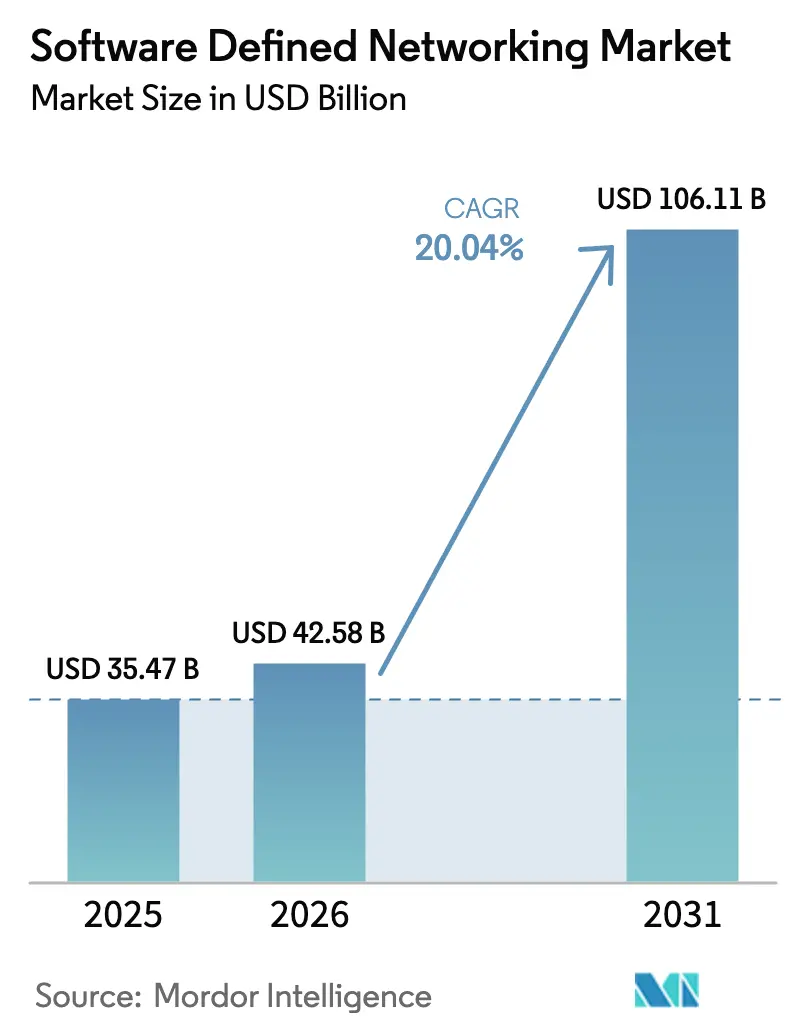
| Market Size (2026) | USD 42.58 Billion |
| Market Size (2031) | USD 106.11 Billion |
| Growth Rate (2026 - 2031) | 20.04% CAGR |
| Fastest Growing Market | Asia-Pacific |
| Largest Market | North America |
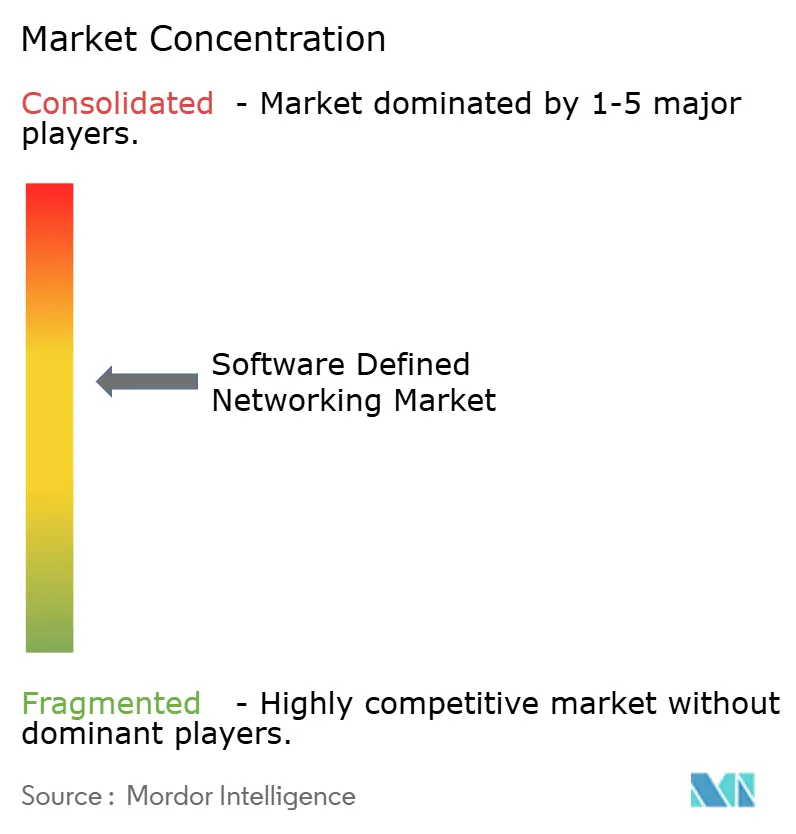
| Market Concentration | Medium |
Major Players *Disclaimer: Major Players sorted in no particular order Image © Mordor Intelligence. Reuse requires attribution under CC BY 4.0. | |
Software Defined Networking Market Analysis by Mordor Intelligence
The software-defined networking market size is expected to grow from USD 35.47 billion in 2025 to USD 42.58 billion in 2026 and is forecast to reach USD 106.11 billion by 2031 at 20.04% CAGR over 2026-2031. Momentum stems from the migration away from fixed-function hardware toward programmable fabrics that support real-time traffic engineering and automated policy enforcement. Large-scale 5G core virtualization, continued cloud migration, and the need to curb network energy consumption all reinforce demand. Government digital-sovereignty laws are amplifying the appeal of open-source controllers, while AI-based telemetry shortens troubleshooting cycles and improves capacity planning. Heightened competitive pressure forces incumbents to blend hardware portfolios with controller software, services, and intent-based orchestration.
Key Report Takeaways
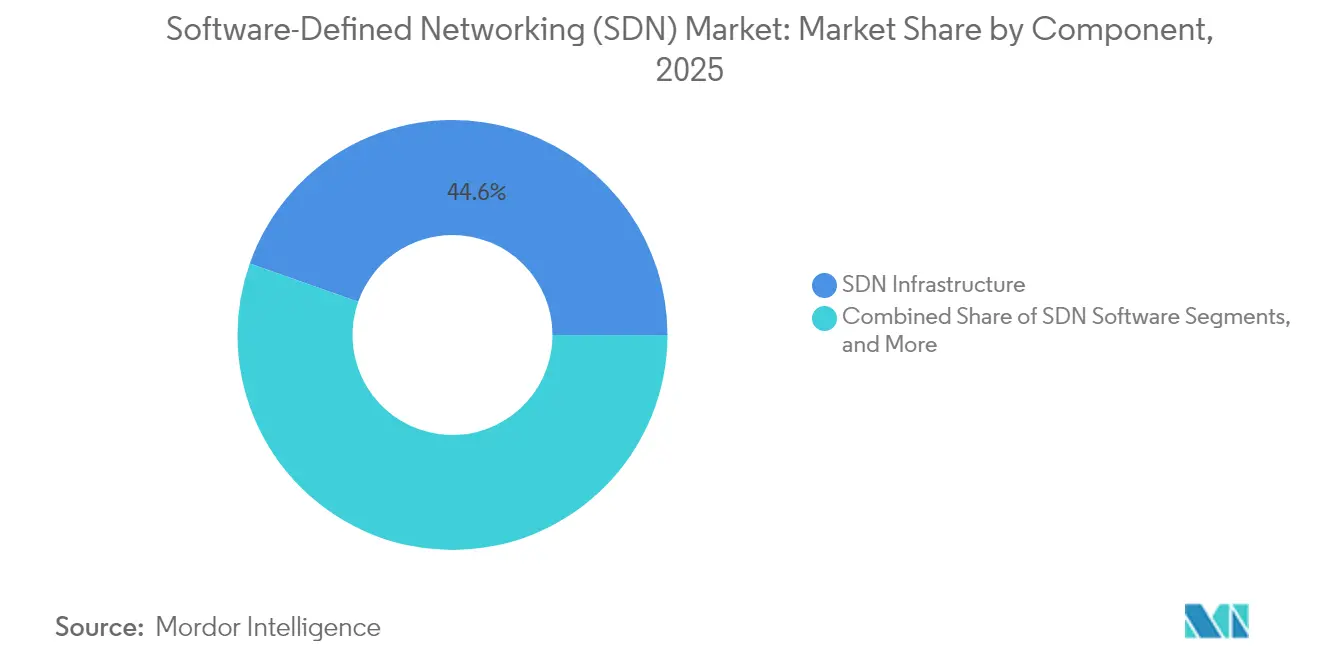
- By component, SDN infrastructure led with 44.60% of software-defined networking market share in 2025; Services and Support is expanding at a 20.78% CAGR to 2031.
- By deployment mode, on-premise retained 53.90% of the software-defined networking market size in 2025, but cloud deployment is poised for 22.3% CAGR through 2031.
- By organization size, large enterprises controlled 61.80% revenue in 2025, while SMEs are projected to compound at 21.7% CAGR.
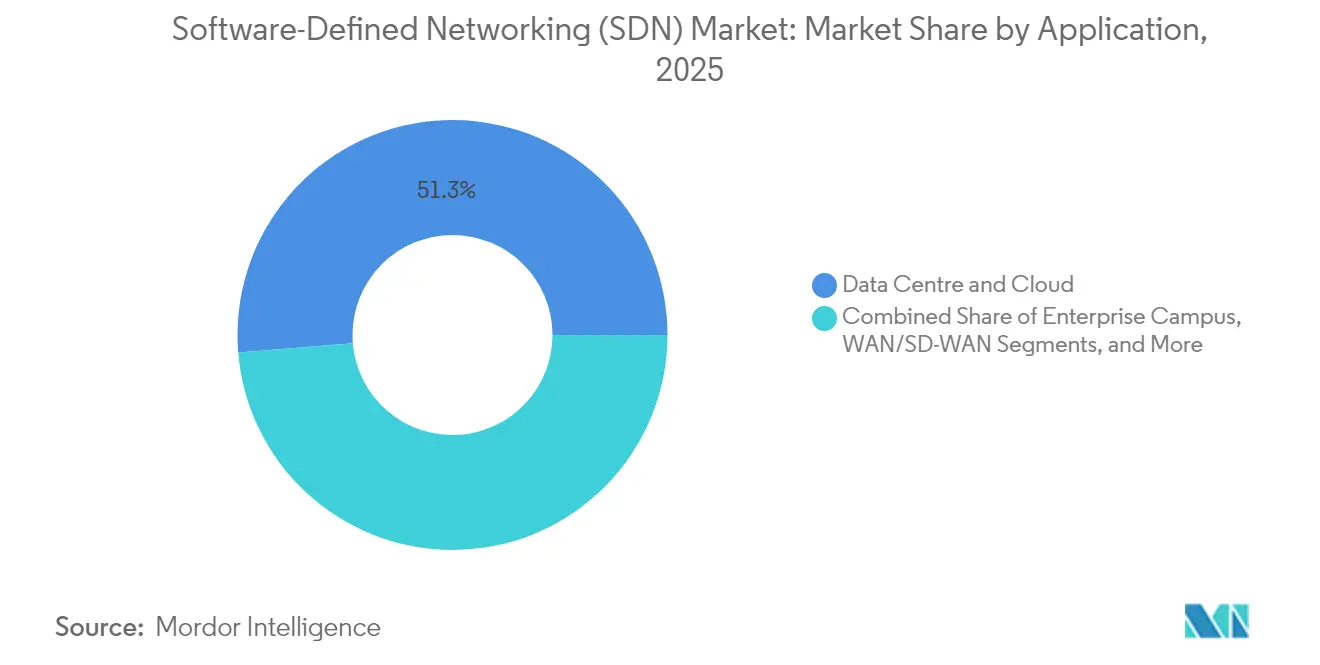
- By application, data-center/cloud captured 51.30% of the software-defined networking market share in 2025, whereas SD-WAN shows a 22.1% CAGR outlook.
- By end user, Telecom and Cloud SPs 32.10% of the software-defined networking market share in 2025, whereas Manufacturing shows a 20.9% CAGR outlook.
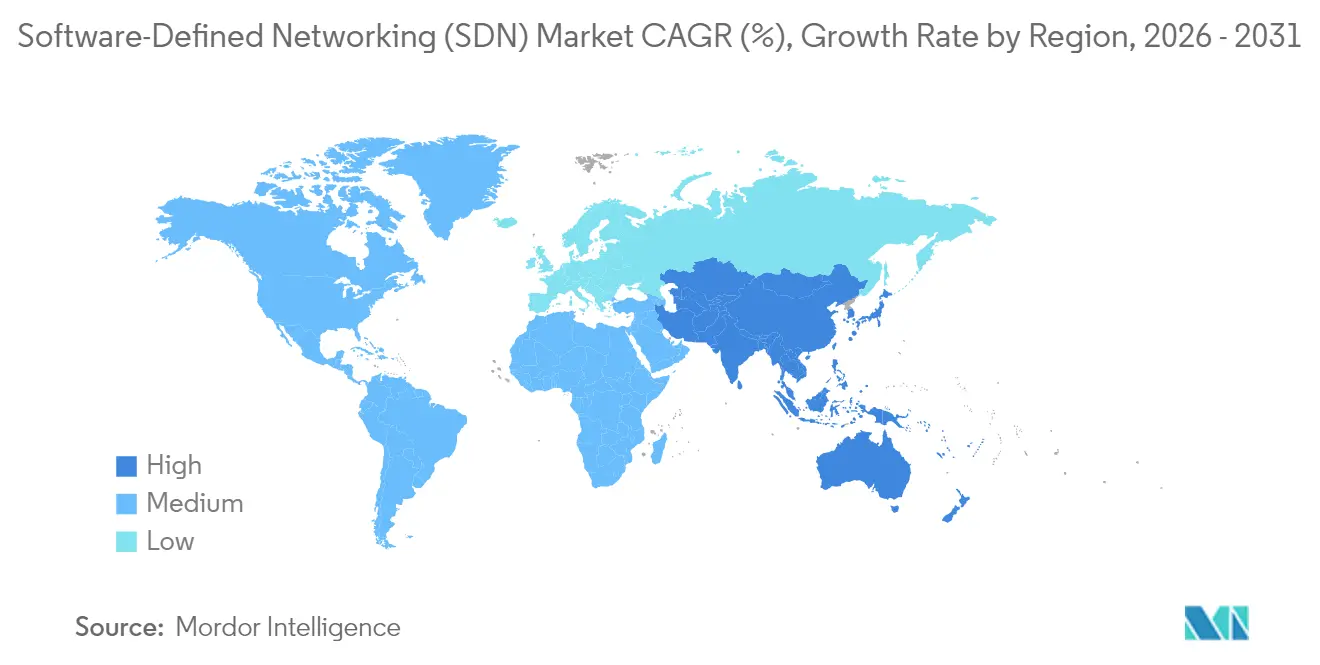
- By geography, North America commanded 36.80% revenue in 2025; Asia-Pacific records the fastest 21.1% CAGR through 2031.
Note: Market size and forecast figures in this report are generated using Mordor Intelligence’s proprietary estimation framework, updated with the latest available data and insights as of 2026.
Global Software Defined Networking Market Trends and Insights
Drivers Impact Analysis*
| Driver | (~) % Impact on CAGR Forecast | Geographic Relevance | Impact Timeline |
|---|---|---|---|
| Rising investment toward automation of network infrastructure | +3.2% | Global, with concentration in North America and Europe | Medium term (2-4 years) |
| Increasing adoption of cloud and IoT-centric services | +4.1% | Global, led by Asia-Pacific and North America | Short term (≤ 2 years) |
| Proliferation of 5G core virtualization projects | +2.8% | Asia-Pacific core, spill-over to Europe and North America | Medium term (2-4 years) |
| Programmable data-plane (P4) acceleration for ultra-low-latency slicing | +1.9% | North America & Europe, emerging in Asia-Pacific | Long term (≥ 4 years) |
| Sustainability mandates driving energy-optimised SDN fabrics | +2.3% | Europe-led, expanding to North America and Asia-Pacific | Medium term (2-4 years) |
| Sovereign-cloud push for open-source SDN controllers | +1.7% | Europe & North America, selective APAC adoption | Long term (≥ 4 years) |
| Source: Mordor Intelligence | |||
Rising Investment Toward Automation of Network Infrastructure
Enterprises and public agencies are redirecting capex toward programmable fabrics that shrink manual configuration windows. The U.S. Department of Defense earmarked USD 1.355 billion for networking RDT&E programs focused on edge computing and collaborative processes in fiscal 2025. [1]U.S. Department of Defense, “Research, Development, Test & Evaluation FY 2025,” defense.gov Intel’s Network and Edge division generated USD 1.3 billion Q2 2024 revenue from AI-ready Ethernet NICs and infrastructure processing units that underpin self-driving networks. Field studies indicate that SDN-enabled automation can lop up to 40% off operational expenditure and accelerate service rollout by 60%. Financial-services teams illustrate the trend with a 26% rise in GitHub commits targeting Python-based network-automation tools during 2024. Combined, these factors keep automation spending on an upward trajectory through the medium term.
Increasing Adoption of Cloud and IoT-Centric Services
Dynamic multicloud topologies require networks that scale with elastic compute resources. IBM research notes that 60% of communications-service providers already employ AI for performance monitoring in hybrid cloud environments. [2]IBM, “Boost productivity with Responsible AI agents,”ibm.com Manufacturing facilities report a 68% fall in downtime and an 80% rise in continuity after pairing SDN with digital-twin analytics on the production floor. Healthcare providers see comparable gains, using programmable segmentation to protect connected medical devices while sustaining real-time telemetry flows. Such benefits accelerate near-term uptake, especially across Asia-Pacific where cloud traffic volumes are highest.
Proliferation of 5G Core Virtualization Projects
Virtualized 5G cores rely on SDN for network-slice orchestration and ultra-low-latency edge connectivity. Nokia’s bid to purchase Infinera strengthens domestic manufacturing and software-defined radio access offerings in the United States. Research finds that P4-based data planes outperform eBPF alternatives inside standalone 5G cores, particularly in high-throughput scenarios. AT&T’s pledge to virtualize 75% of core functions set the early benchmark for telco SDN deployment. Private-industrial 5G slices now appear in automotive and advanced-manufacturing campuses across Japan and Germany, reinforcing demand for programmable controllers.
Programmable Data-Plane (P4) Acceleration for Ultra-Low-Latency Slicing
P4’s protocol-independent design enables fine-grained packet handling at line-rate. Telefonica Research shows that feature extraction on routers via P4 improves ML-based traffic classification without degrading throughput. Comparative lab work indicates P4Docker can slash latency by 50% and lift throughput 25% versus Mininet simulation. High-frequency trading desks see direct monetary returns from microsecond improvements. Switch silicon vendors now embed PISA pipelines, making P4 adoption practical for mainstream enterprises by the late 2020s.
Restraints Impact Analysis*
| Restraint | (~) % Impact on CAGR Forecast | Geographic Relevance | Impact Timeline |
|---|---|---|---|
| Shortage of SDN-skilled professionals | -2.1% | Global, acute in North America and Europe | Short term (≤ 2 years) |
| Rising sophistication of SDN-targeted cyber-attacks | -1.8% | Global, concentrated in high-value targets | Medium term (2-4 years) |
| Multi-vendor P4/eBPF interoperability gaps | -1.3% | North America and Europe primarily | Medium term (2-4 years) |
| Business-critical outages from intent-based control-plane failures | -1.6% | Global, enterprise-focused | Short term (≤ 2 years) |
| Source: Mordor Intelligence | |||
Shortage of SDN-Skilled Professionals
Demand for personnel who can code-switch between networking, DevOps, and cloud disciplines exceeds supply. EU research highlights uneven digital-skills development among member states, delaying advanced-network rollouts. Enterprises respond with certification programs, yet P4 and intent-based orchestration remain niche competencies drawing premium salaries. The talent deficit inflates project timelines and advisory-services costs, particularly for brownfield upgrades.
Rising Sophistication of SDN-Targeted Cyber-Attacks
Centralized controllers present lucrative attack surfaces. Vulnerability assessments of OpenDaylight and Floodlight show exposure to LLDP replay and ARP-poison attacks, whereas ONOS fares better but remains imperfect. ENISA warns that cross-border digital infrastructure requires stronger information-sharing frameworks to counter evolving threats. [3]ENISA, “Threat Landscape for 5G Networks,” enisa.europa.eu Financial institutions are especially sensitive because single-controller compromise can reverberate across entire trading platforms.
*Our forecasts treat driver/restraint impacts as directional, not additive. The impact forecasts reflect baseline growth, mix effects, and variable interactions.
Segment Analysis
By Component: Infrastructure Dominance Amid Services Acceleration
SDN infrastructure contributed 44.60% of 2025 revenue, anchoring the software-defined networking market size at the hardware layer where programmable ASICs replace legacy switches. Capital-intensive refresh projects remain a prerequisite for controller adoption, sustaining hardware spend into the late 2020s. However, Services and Support postings show the steepest 20.78% CAGR, as enterprises outsource design, deployment, and lifecycle management. Providers like HCLTech widened managed-SDN offerings that bundle AI orchestration and multicloud visibility, underpinning repeatable revenue streams.
Software-controller ecosystems form the decision plane. Open-source frameworks such as ONOS and OpenDaylight temper the risk of vendor lock-in while fostering community-driven innovation. Comparative testing finds ONOS delivers stronger forwarding throughput, whereas OpenDaylight excels in topology discovery and policy distribution. The bifurcation spurs vendors to integrate proprietary value AI-assisted policy engines, zero-trust extensions on top of hardened upstream code.


By Deployment Mode: Cloud Transformation Accelerates
On-premise installations held 53.90% of 2025 revenue as many regulated sectors insist on in-house control. Yet cloud-hosted controllers compound at 22.3% through 2031 as CIOs pivot from capital budgets to opex models. The shift couples with elastic compute tenancy; enterprises spin up controller clusters alongside virtualized workloads, trimming underutilized capacity when demand ebbs. Hybrid topologies emerge as a pragmatic compromise, letting operators preserve sensitive flows on-site while leveraging hyperscale fabrics for burst traffic. A Futuriom survey reveals that 95% of network leaders view multi-cloud connectivity as mission-critical, a stance that reinforces cloud SDN adoption.
Total cost-of-ownership calculations favor cloud for greenfield rollouts under 100 sites, while large campus estates still justify amortized appliance spend. Vendors now bundle controller-as-a-service tiers with traffic-analysis dashboards, easing SME onboarding. Inter-cloud policy alignment remains a friction point; standards groups push for open API schemas to share intent metadata across Amazon, Microsoft, and Google realms.
By Organization Size: Enterprise Leadership Faces SME Disruption
Large enterprises accounted for 61.80% of 2025 spend, leveraging scale budgets to modernize data-center, campus, and WAN domains. Their deployments merge SDN with IT-service-management platforms, feeding topology insights into ITIL workflows for automated trouble-ticket routing. In contrast, SMEs inject momentum, posting a 21.7% CAGR as turnkey SD-WAN subscriptions negate the need for specialist staff. They often start with cloud-hosted vCPE that offers point-and-click segmentation for branch offices.
Price elasticity favors pay-as-you-grow tiers; providers package bandwidth, cloud egress, and security under a unified SLA. Vendors build simplified dashboards that abstract away topology complexity, positioning SME solutions as “consumer-grade UX inside enterprise networks”. The rapid scale of SME logos sharpens channel competition and compresses margins for mid-tier resellers.
By Application: Data Center Maturity Contrasts SD-WAN Growth
Data-center and cloud fabrics delivered 51.30% of 2025 sales, underpinned by well-documented ROI. Cohesive east-west traffic engineering and serverless orchestration keep this slice of the software-defined networking market resilient. Yet SD-WAN registers the quickest 22.1% CAGR amid pandemic-driven hybrid-work norms. Direct cloud handoffs reduce trombone latency, and application-aware routing boosts SaaS performance.
Campus SDN adoption trails but accelerates as organizations unify access-edge and core policies. Vendors now ship Wi-Fi APs that natively tag flows for controller-driven micro-segmentation. In WAN domains, MPLS fade-out continues; intent-based overlay fabrics promise 10-minute branch turn-ups compared with weeks under legacy ordering cycles.
By End User: Telecom Leadership Amid Manufacturing Surge
Telecom and cloud service providers retained 32.10% of 2025 turnover, harnessing SDN to enable 5G slicing, NFV, and edge MEC nodes. Their requirements push scalability thresholds into millions of end points, steering product roadmaps toward P4 pipelines and AI-root-cause engines. Manufacturing vaults forward with a 20.9% CAGR, embedding SDN in Industry 4.0 settings to guarantee deterministic latency between robots, sensors, and analytics hubs. Semiconductor fabs attribute uptime gains to programmable fabrics that isolate clean-room machinery from office traffic.
BFSI modernization trails telcos yet accelerates thanks to low-latency trading and regulatory audit mandates. Healthcare players lean on controller APIs to enforce HIPAA-aligned segmentation across multicloud workloads. Retail chains pursue omnichannel consistency, shifting POS and inventory platforms onto SD-WAN for resilient site connectivity.
Geography Analysis
North America generated 36.80% of 2025 revenue, buoyed by enterprise cloud migration and federal Research and Development outlays. The U.S. Department of Defense alone invested more than USD 1.3 billion in software-centric networking projects, forging demand for secure, programmable fabrics in classified environments. Start-up density around Silicon Valley, Austin, and Toronto accelerates controller innovation, while open-source stewardship by the Linux Foundation fosters multivendor interoperability.
Europe ranks second, driven by sustainability mandates and digital-sovereignty statutes that advocate open-source adoption. EU firms bear bureaucratic costs equal to 1.8% of turnover, incentivizing automated network operations that curb compliance overhead. Regulators promote competition by obligating wholesale access and monitoring oligopolistic tendencies within telecom backbones. Simultaneously, national 5G rollout targets spur carrier investment in SDN-controlled RAN slicing for enterprise verticals, aligning with energy-efficiency commitments.
Asia-Pacific is the fastest-growing locale, posting a 21.1% CAGR through 2031. China’s Digital Silk Road has driven nearly USD 23 billion into ICT projects across 24 Indo-Pacific states since 2017, catalyzing wide-area SDN deployments for cross-border data corridors. Japanese smart-manufacturing consortia deploy private 5G and time-sensitive networking overlays, while India’s IT-services giants integrate SDN into managed campus solutions for domestic enterprises. Rapid urbanization and a swelling base of mobile-first consumers enlarge edge-traffic volumes, making programmable congestion control a necessity rather than a luxury.

Regulatory Landscape
The regulatory environment for software-defined networking is increasingly shaped by telecom equipment compliance requirements and cross-industry standardization that affects SDN control, orchestration, and SD-WAN service definitions. In India, the Department of Telecommunications (TEC) notified Essential Requirements for Software Defined Wide Area Network Equipment (TEC 30072603) on May 5, 2026 under the Telecommunication Act, 2023, adding a formal compliance layer that vendors and importers must meet for in-country deployments.
On the standards side, IETF and ITU-T updates are tightening technical baselines used by operators and vendors to implement policy-driven routing and SD-WAN services at scale. IETF updated RFC 9256 (Segment Routing Policy Architecture) in May 2026, while ITU-T finalized Q.Suppl.79 in November 2025 to document technical parameters for SD-WAN services based on SRv6, supporting alignment across multi-vendor WAN overlays. ETSI also advanced NFV interoperability by publishing ETSI GS NFV-SOL 003 V5.4.1 in April 2026, which defines RESTful protocols for the Or-Vnfm reference point that SDN/NFV stacks rely on for lifecycle management in telecom and cloud-service-provider environments.
Value Chain Analysis
The SDN value chain covers silicon and systems for the data plane (switches/routers/NICs), controller and orchestration software (including open-source controllers and automation frameworks), and services that bring security, telemetry, and lifecycle operations into production networks. Hardware-software disaggregation continues as operators combine multi-vendor forwarding infrastructure with controller stacks and open interfaces, while component suppliers such as Ciena provide high-speed optical elements (including 1600ZR/ZR+ class coherent pluggables) that support data-center interconnect and transport domains increasingly managed through SDN control.
Standards and open ecosystems shape product roadmaps and procurement by defining controller southbound expectations and operational automation primitives; initiatives such as ETSI TeraFlowSDN and Telecom Infra Project (TIP) MUST IP technical requirements reflect this shift toward shared specifications. Midstream, security and policy enforcement are being embedded deeper into SDN-managed fabrics through SASE and SD-WAN integration, with providers such as Palo Alto Networks integrating security services into carrier and enterprise architectures. Downstream, system integrators and managed-service providers capture more value by deploying, customizing, and operating multi-vendor SDN stacks, particularly where skills shortages and cyber-risk management raise the need for ongoing services and support.
Competitive Landscape
Competition remains restless as legacy hardware vendors race to infuse software, while cloud-native entrants weaponize agile release cycles. Cisco and Juniper still dominate chassis share, yet revenue reliance shifts toward recurring licenses, controller subscriptions, and automation packages.
Arista Networks epitomizes disruptive ascent, surpassing USD 7 billion in FY 2024 revenue by tailoring data-center switches for AI cluster fabrics. Broadcom’s Tomahawk 6 silicon pushes 102.4 Tbps and 1,024×100 Gbps SerDes into a single device, catering to hyperscale build-outs where microburst buffering and congestion telemetry are must-haves. Open-source controller communities create further headwinds, giving enterprises cheaper entry paths and heightening price sensitivity.
Services specialists carve value by bridging skill gaps. Global system integrators develop turnkey playbooks that meld P4 data planes with zero-trust overlays. Meanwhile, telco NEPs chase vertical solutions in manufacturing, healthcare, and smart cities, where domain know-how offsets commoditizing hardware economics. Vendor differentiation now gravitates to AI-assisted operations, sovereign-cloud compliance, and energy-optimized forwarding.
Software Defined Networking Industry Leaders
Ciena
Dell Technologies
Palo Alto Networks
NEC Corporation
AT&T Business
- *Disclaimer: Major Players sorted in no particular order

Market Opportunities and Future Outlook
Opportunities are expanding around security-forward SDN and SD-WAN architectures that reduce the risk from centralized control planes and fit new threat models. A key signal is the July 2026 launch of a Quantum-Resilient SASE Fabric by Palo Alto Networks and AT&T, which reframes SD-WAN and SASE roadmaps around crypto-agility and policy enforcement across distributed edges. This creates whitespace for vendors and service providers that can combine SDN policy orchestration with stronger identity, segmentation, and cryptographic lifecycle management in enterprise WAN and telecom backbones.
A second opportunity area connects SDN automation to AI-era bandwidth growth and higher-capacity optical and Ethernet fabrics, where operations and assurance increasingly require closed-loop control. Ciena highlighted new high-speed connectivity innovations in March 2026, including higher-capacity coherent optics aimed at data-center and interconnect scaling, which increases the need for SDN controllers and multi-domain orchestration to automate provisioning, telemetry, and change management across packet and optical layers. Open-source automation frameworks such as ETSI TeraFlowSDN (Release 7) also extend capabilities for P4-device integration and multi-granular optical network automation, supporting deployments that favor open interfaces and community-driven interoperability over single-vendor stacks.
Recent Industry Developments
- June 2026: Ciena's Blue Planet division released Configuration and Change Management CCM, an AI-driven solution to unify device configuration, change, and lifecycle management across multi-vendor networks. The launch accelerates network automation across diverse equipment and strengthens intent-based operations. The move reinforces Ciena's position in multi-vendor orchestration for large scale cloud and service provider deployments.
- June 2026: Palo Alto Networks introduced new features and enhancements in its mid-year 2026 release cycle for Prisma SD-WAN. The enhancements broaden performance and security capabilities for distributed networks. The update strengthens the company's SD-WAN offering against competing platforms in fast growing enterprise WAN deployments.
- November 2025: Dell Technologies expanded Enterprise SONiC Distribution platform to support NVIDIA Spectrum-X Ethernet platforms for unified, lossless Ethernet fabrics in AI and HPC environments. The expansion enables tighter integration with high performance accelerators and improves fabric efficiency for data center workloads. This aligns with open source ecosystem momentum to enhance scalable AI and HPC deployments.


Research Methodology Framework and Report Scope
Market Definition and Coverage
For this study, the software-defined networking (SDN) market covers revenue earned from SDN software and controllers, SDN-enabled infrastructure, and related implementation and support services that help networks be centrally managed and programmable across enterprise and service-provider environments.
Scope exclusions: Excludes pure traditional networking hardware sold without SDN control features, and excludes general IT consulting that is not tied to SDN deployment or operations.
Segmentation Overview
- By Component
- SDN Infrastructure (Switching, Routers, NICs)
- SDN Software / Controllers
- Services and Support
- By Deployment Mode
- On-premise
- Cloud
- By Organization Size
- Large Enterprises
- Small and Medium Enterprises (SMEs)
- By Application
- Data Centre and Cloud
- Enterprise Campus
- WAN / SD-WAN
- Others
- By End User
- Telecom and Cloud Service Providers
- BFSI
- Healthcare
- Retail and E-commerce
- Manufacturing and Industrial
- Others
- By Geography
- North America
- United States
- Canada
- Mexico
- South America
- Brazil
- Argentina
- Rest of South America
- Europe
- Germany
- United Kingdom
- France
- Italy
- Rest of Europe
- Asia-Pacific
- China
- Japan
- India
- South Korea
- Rest of Asia-Pacific
- Middle East and Africa
- GCC
- Turkey
- South Africa
- Rest of Middle East and Africa
- North America
Data Sources, Market Sizing, and Validation
Desk Research
Desk research starts by pinning down the real demand signals behind SDN rollouts, so we do not size only from marketing claims. We refer to public sources such as FCC broadband and telecom releases, NIST publications, IEEE papers, IETF standards work, and the World Bank digital indicators to understand infrastructure readiness, traffic growth, and policy direction that can influence SDN adoption.
We then layer in evidence from company filings, earnings call transcripts, investor decks, and credible press coverage to map where spend is moving across data center, campus, and provider networks. For normalization, we also use paid subscriptions that compile company financials and news, plus patent databases to track controller, orchestration, and automation activity over time. The desk sources listed here are illustrative only, and many other public references were used for data collection, validation, and clarification.
Primary Interviews and Surveys
Primary research is used to turn the desk inputs into usable sizing assumptions, especially where bundles and deployment choices blur revenue reporting. We speak with network architects, operations managers, procurement teams, system integrators, and service-provider staff across key regions so we can confirm what is being purchased, how it is priced (licenses, subscriptions, and services), and when refresh cycles typically occur.
Distribution of primary research fieldwork respondents
| Company type | Respondent position | Region |
|---|---|---|
| Top tier: 34% | CXOs: 12% | APAC: 49% |
| Mid tier: 51% | Functional/Unit leaders: 35% | EMEA: 32% |
| Smaller Players: 15% | Managers: 53% | Americas: 19% |
Market-Sizing & Forecasting
Sizing begins with a top-down build where enterprise networking spend and service-provider network investment are reconstructed by region, and then filtered through SDN adoption and attach rates across controllers, SDN-capable infrastructure, and services. To keep it grounded, we cross-check the totals using selective bottom-up approximations, such as sampled deal-level pricing ranges, channel feedback on controller subscriptions, and simple volume times ASP checks for SDN-capable switching and routing.
The model leans on practical inputs that respondents can confirm, including data center capacity expansion and cloud build-outs, virtualization and automation penetration in network operations, 5G transport and core modernization activity, typical subscription durations, and the services share seen in early deployments versus steady-state operations. Where vendor reporting mixes SDN with adjacent networking lines, we handle gaps by applying validated split factors based on product descriptions, deployment use cases, and regional customer mix, then we re-test the result against adoption narratives.
For forecasting, we rely on scenario analysis supported by trend lines in the above variables, then adjust the path using expert views on timing of cloud migrations, budget cycles, and policy-driven network upgrades. This keeps the forecast explainable and repeatable, while still reflecting real-world shifts in pricing and deployment models.
Data Validation & Update Cycle
Validation is done in steps, starting with internal checks that make sure the implied ASPs, service shares, and regional splits stay realistic versus observed buying behavior. Our analysts compare the model output with independent signals, such as reported capex patterns, data center build indicators, and enterprise network refresh cues, then review any anomalies before sign-off.
When large variances show up by region or end-user group, we re-check assumptions and, when needed, reconnect with a subset of participants to confirm what changed and why. Reports are refreshed annually, with interim updates when material events affect demand or pricing. Before delivery, the full dataset and assumptions receive a fresh pass so clients get the most current view available.
Mordor Intelligence's Software Defined Networking Market Estimate Compared With Other Published Estimates
Published SDN market values can vary a lot because teams do not always count the same revenue streams, and they may also anchor the model to different demand proxies. Differences also appear when one estimate is built from vendor category totals, while another is built from adoption and pricing logic across user environments.
The biggest gap drivers we see in SDN are whether SD-WAN and broader network security add-ons are bundled into the total, how managed services are treated versus pure software subscriptions, and how quickly pricing is assumed to evolve as controller features become more standardized. Currency timing and refresh cadence matter too, because short-term capex swings by cloud and telecom buyers can shift the annual base.
Benchmark comparison
| Source | Market Size | Gaps in Research Methodology |
|---|---|---|
| Mordor Intelligence | USD 42.58 B (2026) | |
| Global Consultancy A | USD 37.66 B (2024) | Uses an earlier base year and folds SDN into a narrower vendor-category view, which can undercount professional services and deployment support revenue that shows up outside product lines. |
| Industry Tracker B | USD 39.10 B (2025) | Applies a uniform ASP progression to sampled shipments and assumes faster software price compression, which can miss regional contract differences and the services share in early-stage rollouts. |
The spread in the table mostly comes from what gets counted as SDN-adjacent revenue and how pricing and services are treated in the base year. By keeping services tied only to SDN implementation and operations, and by separating controller and infrastructure revenue from adjacent WAN bundles, a clearer demand pool is maintained in the approach used by Mordor Intelligence.


Key Questions Answered in the Report
What is the current size of the software-defined networking market?
The market is worth USD 42.58 billion in 2026 and is projected to rise to USD 106.11 billion by 2031.
Which region shows the highest growth potential?
Asia-Pacific posts a 21.1% CAGR through 2031, propelled by large-scale 5G rollouts and manufacturing digitization.
Why is SD-WAN growing faster than data-center SDN?
Remote-work patterns and cloud-first application delivery favor SD-WAN overlays that improve SaaS performance and reduce branch latency.
What skills are most in demand for SDN careers?
Expertise in P4 programming, DevOps automation, and multicloud networking is scarce and commands premium salaries.
How vulnerable are SDN controllers to cyber-attacks?
Centralized controllers can be single points of failure; studies reveal replay and poisoning exploits, underscoring the need for layered security and continuous patching.
Page last updated on:






