
Software Composition Analysis Market Size and Share
Market Overview
| Study Period | 2020 - 2031 |
|---|---|
| Market Size (2026) | USD 430.12 Billion |
| Market Size (2031) | USD 981.62 Billion |
| Growth Rate (2026 - 2031) | 17.95 % |
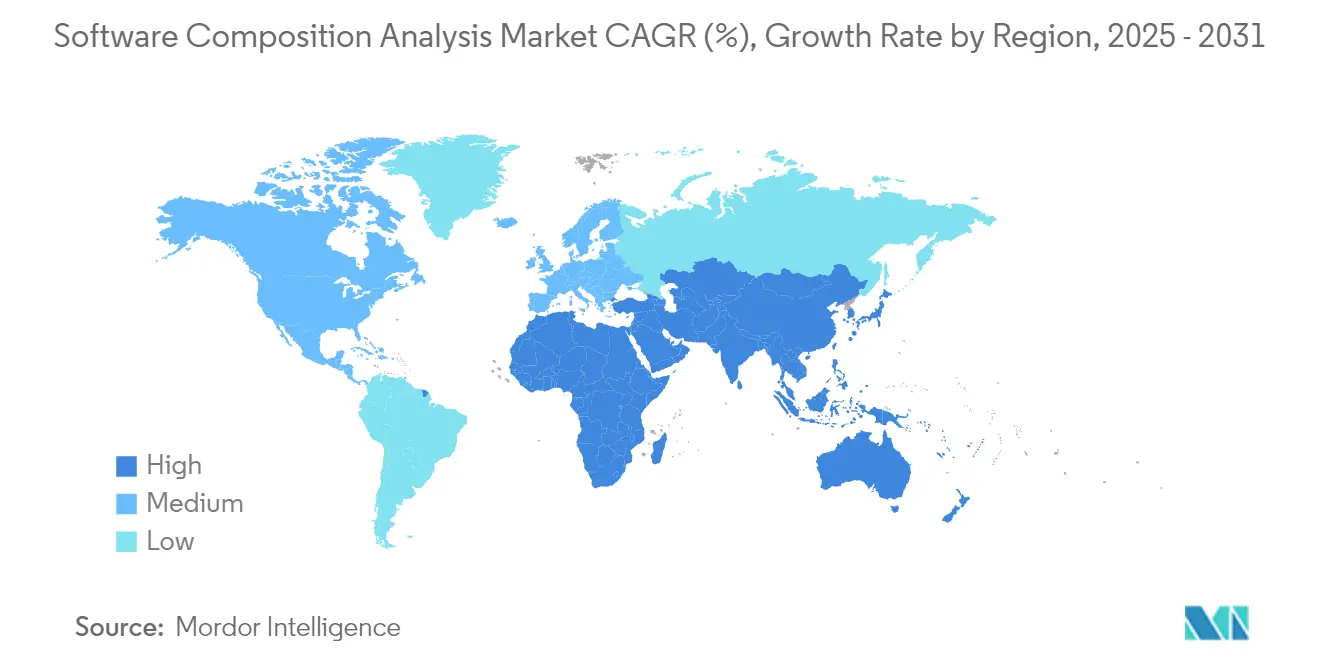
| Fastest Growing Market | Asia-Pacific |
| Largest Market | North America |
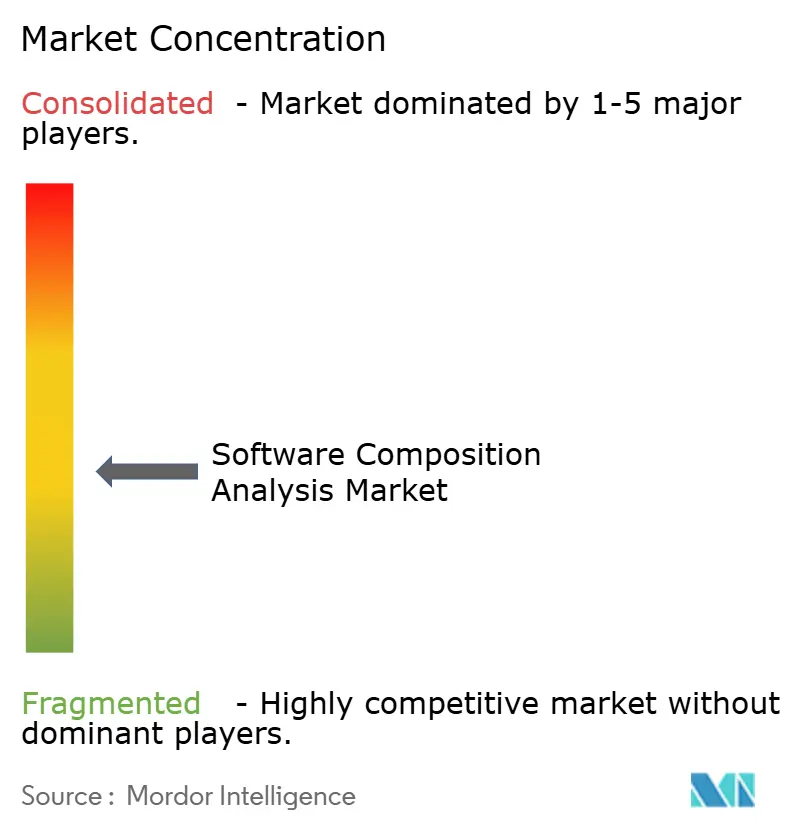
| Market Concentration | Medium |
Major Players *Disclaimer: Major Players sorted in no particular order Image © Mordor Intelligence. Reuse requires attribution under CC BY 4.0. | |
Software Composition Analysis Market Analysis by Mordor Intelligence
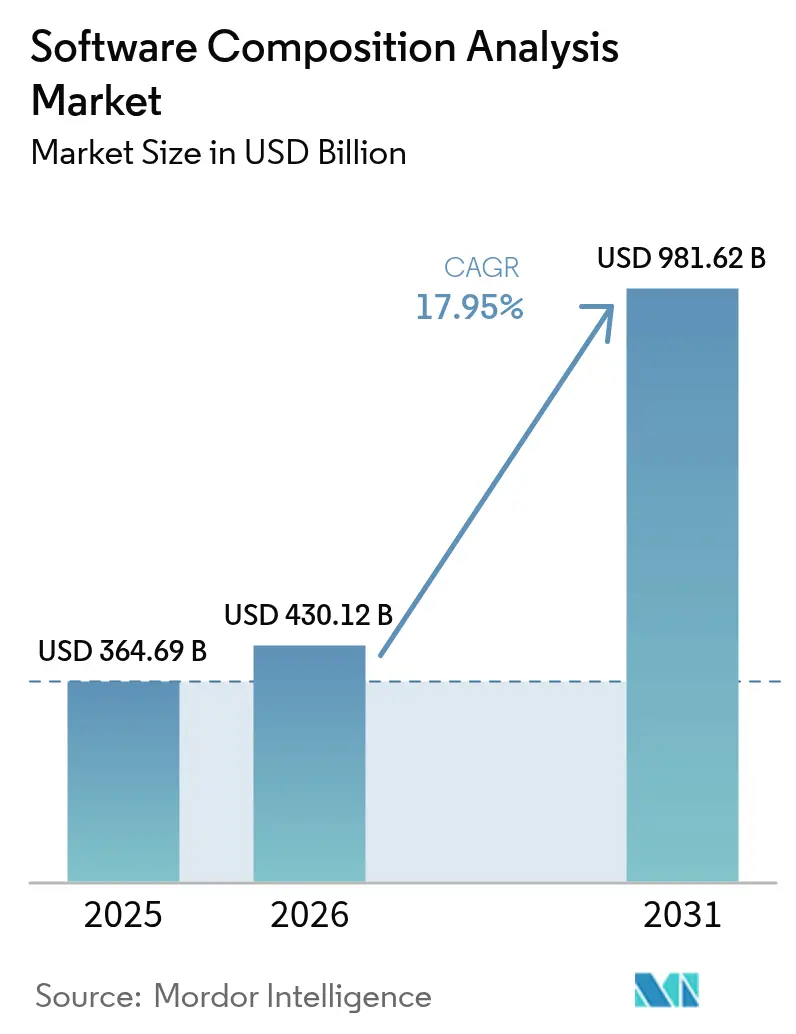
The Software Composition Analysis market size was valued at USD 364.69 billion in 2025 and estimated to grow from USD 430.12 billion in 2026 to reach USD 981.62 billion by 2031, at a CAGR of 17.95% during the forecast period (2026-2031). Rapid expansion reflects the transition of Software Composition Analysis from a specialized security add-on to a core pillar of software engineering. Mandatory Software Bills of Materials (SBOM) across federal and EU procurement frameworks, escalating supply-chain attacks targeting open-source ecosystems, and rising DevSecOps budgets sustain robust demand. Enterprises favor cloud-native platforms that embed automated SBOM generation, license governance, and vulnerability prioritization into developer workflows. Simultaneously, artificial intelligence (AI) code-generation tools introduce new transitive dependencies, further entrenching continuous Software Composition Analysis within modern build pipelines.
Key Report Takeaways
- By component, Solutions captured 66.80% of Software Composition Analysis market share in 2025, while Services are set to record an 18.05% CAGR to 2031.
- By deployment mode, cloud delivery accounted for 62.10% share of the Software Composition Analysis market size in 2025 and is projected to expand at 19.05% CAGR through 2031.
- By organization size, Large Enterprises held 72.90% revenue share in 2025; Small and Medium Enterprises lead growth at 18.55% CAGR.
- By industry vertical, IT and Telecom led with 25.20% contribution to the Software Composition Analysis market in 2025, whereas Healthcare and Life Sciences are advancing at an 18.12% CAGR to 2031.
- By region, North America commanded 27.10% share of the Software Composition Analysis market in 2025; Asia-Pacific is set to grow at 18.88% CAGR through 2031.
Note: Market size and forecast figures in this report are generated using Mordor Intelligence’s proprietary estimation framework, updated with the latest available data and insights as of 2026.
Market Trends and Insights
Drivers Impact Analysis of Software Composition Analysis Market*
| Driver | (~) % Impact on CAGR Forecast | Geographic Relevance | Impact Timeline |
|---|---|---|---|
| Dependence on Open-Source Components | +4.2% | Global | Long term (≥ 4 years) |
| Regulatory Mandates for SBOM and Compliance | +5.1% | North America and EU, expanding to Asia-Pacific | Medium term (2-4 years) |
| Escalating Supply-Chain Cyber-attacks | +3.8% | Global, concentrated in North America and Europe | Short term (≤ 2 years) |
| Shift-Left DevSecOps Budgets | +2.9% | North America and EU core, spill-over to Asia-Pacific | Medium term (2-4 years) |
| Cyber-insurance Underwriting Requirements | +1.7% | North America and EU | Short term (≤ 2 years) |
| AI Code-Generation Expanding Transitive Dependencies | +2.3% | Global, led by North America | Long term (≥ 4 years) |
| Source: Mordor Intelligence | |||
Dependence on Open-Source Components
Open-source libraries appear in more than 99% of enterprise codebases, creating visibility gaps that legacy application security tooling cannot bridge. Package managers and container images multiply transitive dependencies, so an average cloud-native application now incorporates hundreds of third-party modules across several languages. Vulnerable or malicious packages grew 28% in major repositories during 2024, forcing security teams to adopt continuous monitoring and inventory automation. Despite risk exposure, organizations retain open-source reliance because it saves an estimated USD 8.8 trillion in annual development costs, making abandonment impractical for innovation-driven roadmaps.
Regulatory Mandates for SBOM and Compliance
In the United States, federal suppliers must now deliver attested SBOMs under Executive Order 14028 and CISA’s March 2024 Secure Software Development Attestation framework.[1]The European Union’s Cyber Resilience Act, effective December 2024, obliges SBOM creation for every product with digital elements and imposes penalties of up to 2.5% of global turnover for non-compliance. Japan’s Ministry of Economy, Trade and Industry (METI) has issued similar guidelines, signaling converging global policy momentum. Compliance imperatives extend Software Composition Analysis procurement into manufacturing, automotive, healthcare, and industrial automation domains where software security was previously peripheral.
Escalating Supply-Chain Cyber-attacks
The March 2024 XZ Utils backdoor, inserted after a multi-year social-engineering campaign, reached production in several Linux distributions before discovery. Attackers increasingly target build systems, package repositories, and CI/CD pipelines rather than application runtime, driving urgent rollout of proactive Software Composition Analysis controls. Costs continue to mount; global supply-chain breach damages are projected to hit USD 60 billion in 2025, creating clear economic justification for enterprise-wide adoption.
Shift-Left DevSecOps Budgets
Enterprises invest earlier in the software lifecycle because vulnerabilities patched during development cost 100 times less than those remediated post-deployment. The DevSecOps tooling market is forecast to reach USD 41.66 billion by 2030, and 78% of teams plan to infuse AI into secure coding workflows. Modern Software Composition Analysis platforms therefore integrate seamlessly with source control systems, issue trackers, and integrated development environments to deliver real-time insight for engineers without stalling velocity.
Restraints Impact Analysis of Software Composition Analysis Market*
| Restraint | (~) % Impact on CAGR Forecast | Geographic Relevance | Impact Timeline |
|---|---|---|---|
| Shortage of SCA-Skilled Talent | -2.1% | Global, acute in North America and EU | Long term (≥ 4 years) |
| High False-Positive Fatigue | -1.8% | Global | Medium term (2-4 years) |
| License Fatigue Curtailing Scan Scope | -1.2% | Global | Short term (≤ 2 years) |
| Run-time Integrity Tools Cannibalising SCA Spend | -0.9% | North America and EU | Medium term (2-4 years) |
| Source: Mordor Intelligence | |||
Shortage of SCA-Skilled Talent
The United States alone trails demand by 225,000 cybersecurity workers, leaving many organizations without the expertise to interpret detailed dependency graphs, prioritize vulnerabilities, and craft remediation policies.[2] Because Software Composition Analysis spans development, legal, and procurement functions, the skills gap cannot be bridged through traditional security hiring alone. Firms report six-to-twelve-month onboarding cycles for new analysts, driving reliance on vendor professional services and managed security providers, which elevates total cost of ownership.
High False-Positive Fatigue
Research shows that 95% of fixes triggered by generic scanning do not materially reduce risk, eroding trust in vulnerability management programs.[3]Legacy Software Composition Analysis engines often flag entire archives on the basis of a single inactive class, flooding security queues with thousands of low-value alerts and slowing deployment pipelines. Teams therefore seek precision engines capable of dynamic reachability verification and exploitability scoring, but higher-accuracy solutions remain expensive and integration-intensive, limiting adoption in cost-sensitive environments.
*Our forecasts treat driver/restraint impacts as directional, not additive. The impact forecasts reflect baseline growth, mix effects, and variable interactions.
Software Composition Analysis Market Segment Analysis
By Component:
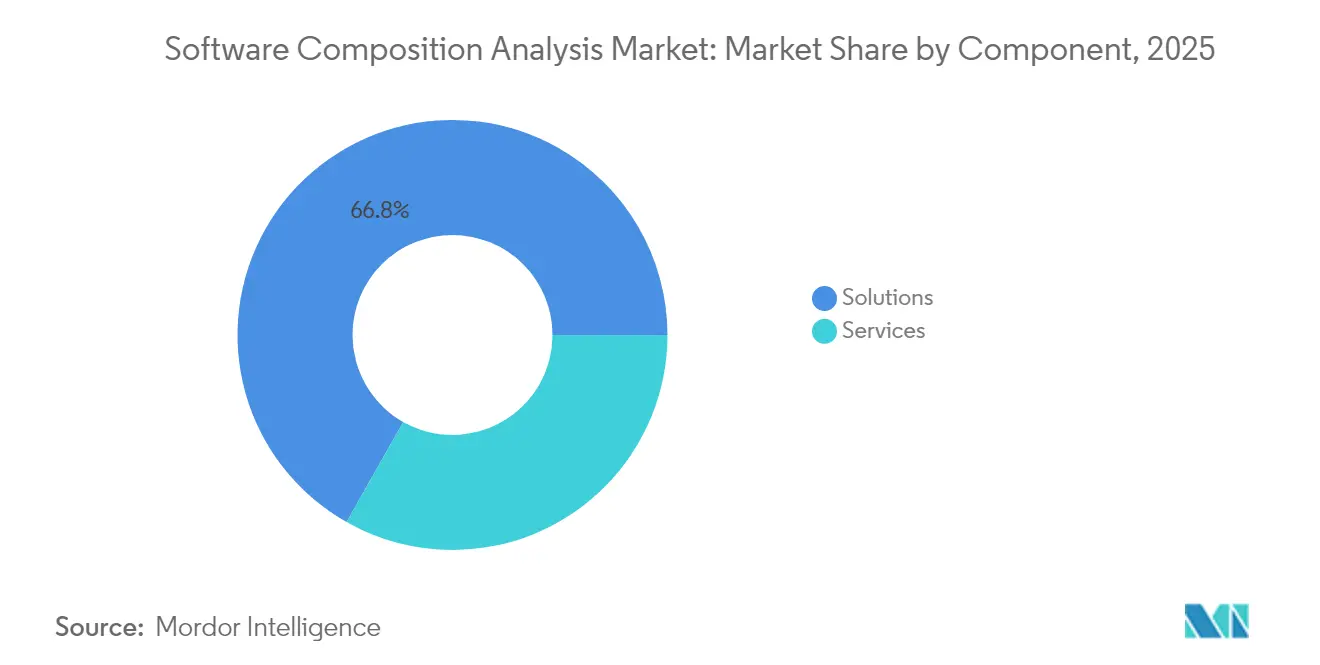
Consolidated Platforms Dominate Implementation ComplexitySolutions generated 66.80% revenue in 2025, reflecting enterprise preference for unified suites that combine vulnerability detection, license governance, and SBOM automation in a single console. Extensive policy engines, developer plug-ins, and workflow orchestration capabilities encourage consolidation of overlapping security functions. Services, though smaller, accelerate at 18.05% CAGR through 2031 because most organizations lack deep expertise to fine-tune scan policies, embed tooling into sprawling CI/CD pipelines, and interpret nuanced license risks. Consulting, integration, and managed detection offerings therefore help enterprises operationalize platform investments.
Organizations with thousands of repositories across diverse languages increasingly engage specialist service partners to customize scan performance, design remediation playbooks, and integrate results into governance, risk, and compliance dashboards. For mid-market buyers, managed services offset onboarding time by providing turnkey dashboards and expert triage. As a result, services revenue growth outpaces pure license expansion, even though platform fees continue to anchor the Software Composition Analysis market.

By Deployment Mode:
Cloud Delivery Scales With DevOps VelocityCloud-hosted products secured 62.10% share in 2025 and display a 19.05% CAGR outlook, underscoring how SaaS economics resonate with agile software pipelines. Instant database updates, elastic compute capacity, and direct integration with GitHub or GitLab actions enable high-frequency scans without dedicated infrastructure. On-premises deployments remain essential in defense, critical infrastructure, and highly regulated financial institutions where data sovereignty or export-control rules prevent external code movement.
Hybrid patterns emerge as a pragmatic middle path, allowing enterprises to retain sensitive source code in local scanners while pulling real-time vulnerability intelligence from cloud APIs. Vendors differentiate through AI-supported remediation suggestions and container image scanning that leverage cloud GPU clusters for model training. This technical depth widens the performance gap between native-SaaS leaders and legacy on-premise incumbents, steering budget allocations toward cloud subscriptions over perpetual licenses.
By Organization Size:
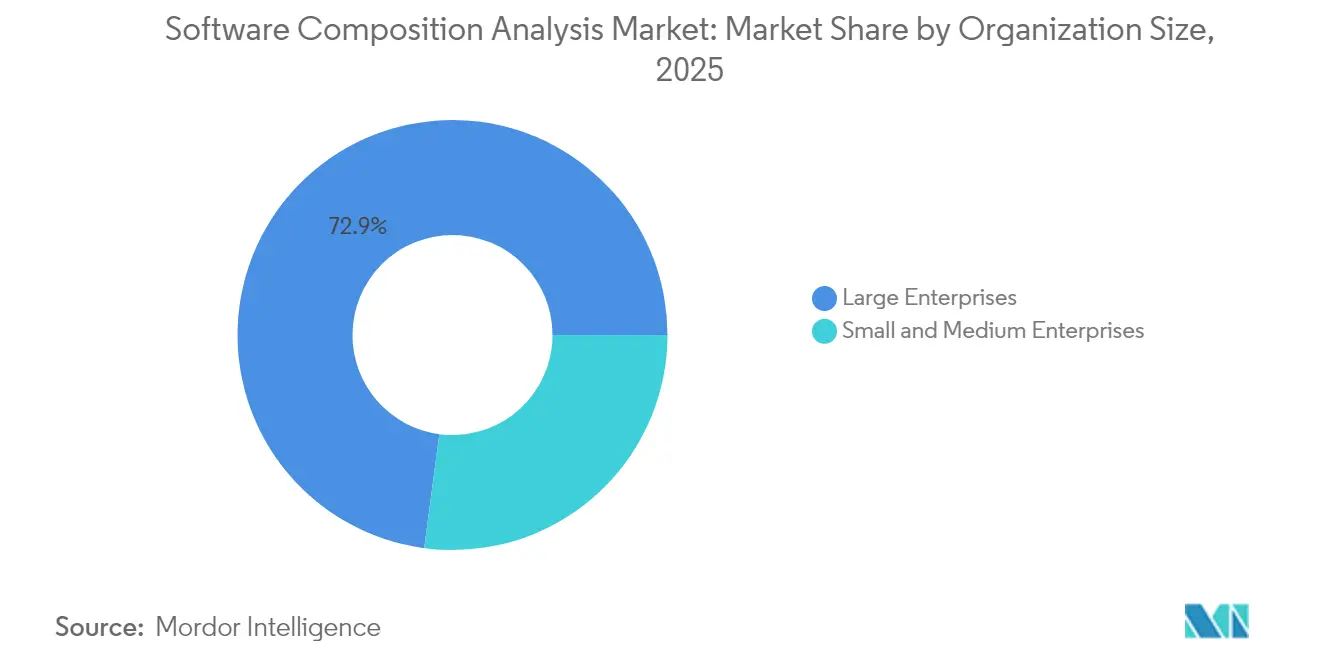
Regulatory Pressure Catalyzes SME UptakeLarge Enterprises controlled 72.90% of 2025 expenditure, deploying multi-tool stacks that align with varied programming ecosystems and international compliance regimes. Their scale demands features such as enterprise-wide policy orchestration, single sign-on, and granular role-based access control. However, the highest growth originates from Small and Medium Enterprises at 18.55% CAGR, because SBOM mandates now cascade down the supplier chain, compelling even boutique software vendors to document components for upstream clients.
SMEs gravitate toward all-in-one platforms that fold Software Composition Analysis, static application testing, and container security into a single subscription to reduce vendor sprawl. Usage-based and freemium pricing lower entry barriers, while AI-guided dashboards streamline triage tasks for resource-constrained teams. Such democratization broadens the Software Composition Analysis industry’s total addressable base far beyond Fortune 500 constituents.
By Industry Vertical:
Healthcare Compliance Accelerates AdoptionIT and Telecom retained 25.20% share in 2025 because cloud service providers and network operators face constant targeting by sophisticated adversaries who infiltrate supply chains to gain downstream access. Unified platform coverage across microservices, infrastructure-as-code, and downstream libraries remains a strategic necessity. The Healthcare and Life Sciences segment logs the fastest 18.12% CAGR owing to FDA rules requiring SBOM submission in medical-device pre-market filings and ongoing vulnerability disclosure obligations throughout product lifecycles.
Financial services firms intensify investment amid growing scrutiny from regulators concerned about systemic risk posed by third-party code. Manufacturers and automotive suppliers, governed by forthcoming EU Cyber Resilience Act requirements and ISO/SAE 21434 standards, respectively, now view Software Composition Analysis tooling as integral to product liability mitigation. This regulatory diffusion ensures sustained multiyear growth across a broadening set of verticals, fueling geographic diversification of provider revenue.
Geography Analysis
North America Software Composition Analysis Market
North America remained the largest regional contributor with 27.10% of 2025 revenue, anchored by U.S. federal procurement mandates that oblige every government software contractor to furnish SBOMs and secure-development attestations. The region benefits from deep venture-capital ecosystems, mature DevSecOps cultures, and a concentration of platform vendors that accelerate private-sector adoption.
Europe Software Composition Analysis Market
Europe’s trajectory strengthens following the December 2024 enactment of the Cyber Resilience Act, which obliges SBOMs for any digital product sold in the bloc by 2027. Germany drives early uptake thanks to its export-oriented manufacturing base, while the United Kingdom maintains spending momentum through financial-services modernization programs and national infrastructure hardening initiatives.
APAC Software Composition Analysis Market
Asia-Pacific posts the fastest 18.88% CAGR through 2031. Japan promulgated detailed SBOM guidelines via METI, and a consortium of major enterprises now pilots common tooling stacks to streamline adoption. China invests in domestic Software Composition Analysis capacity to protect strategic industries, whereas India’s IT-services sector embeds SBOM generation into contracts with multinational customers. Southeast Asian economies show rising interest as public-sector digitalization initiatives expose them to supply-chain threats that demand proactive controls.
Regulatory Landscape
Software composition analysis adoption is being shaped by procurement-driven SBOM mandates and product-security legislation. In the United States, Executive Order 14028 supply chain requirements and CISA's Secure Software Development Attestation framework (March 2024) have pushed federal suppliers toward attested SBOM production and continuous component visibility. CISA also updated guidance with the 2025 Minimum Elements for a Software Bill of Materials (SBOM), emphasizing machine-processable SBOM practices that fit the formats used across modern SCA workflows.
In Europe, the Cyber Resilience Act (Regulation (EU) 2024/2847) entered into force on 10 December 2024 and sets expectations for SBOM-centered transparency and vulnerability handling for products with digital elements. The CRA implementation timeline provides near-term compliance anchors, including Chapter IV provisions on the notification of conformity assessment bodies applying from 11 June 2026, and reporting of actively exploited vulnerabilities applying from 11 September 2026. ENISA's 2025 SBOM implementation guidance further reinforces operational expectations around SBOM consumption and implementation, increasing the need for automated SBOM generation, license governance, and evidence retention within SCA platforms.
Competitive Landscape
The Software Composition Analysis market exhibits moderate fragmentation. Leading suites from Synopsys, Snyk, and Sonatype leverage extensive vulnerability databases, developer-first plug-ins, and active open-source community engagement. Cloud security platforms, including Palo Alto Networks Prisma Cloud and Checkmarx One, embed Software Composition Analysis modules to offer unified application protection. Accuracy improvement becomes a critical differentiator; Azul’s runtime reachability analysis claims thousand-fold false-positive reduction, challenging static-only incumbents.
Mergers and acquisitions accelerate capability expansion. Socket acquired Coana in April 2025 to bolster static reachability scoring, and Veracode purchased Phylum in January 2025 to enhance malicious package detection. Patent filings reveal industry focus on AI-assisted dependency mapping, automated SBOM lifecycle management, and exploitability scoring. In-house innovation couples with growing partner marketplaces, enabling buyers to extend core scanning with ecosystem add-ons that address infrastructure-as-code, container registry, and runtime telemetry use cases.
Channel partnerships broaden reach into regulated verticals. Systems integrators package Software Composition Analysis with broader DevSecOps transformations, while managed security service providers deliver co-managed dashboards for resource-limited customers. Despite active consolidation, a steady stream of venture-backed startups continues to introduce specialized features such as privacy compliance mapping and machine-learning model bill-of-materials, ensuring competitive dynamism through the forecast horizon.
Software Composition Analysis Industry Leaders
-
Synopsys, Inc.
-
Sonatype Inc.
-
Snyk Limited
-
Veracode Inc.
-
Mend.io (White Source Ltd.)
- *Disclaimer: Major Players sorted in no particular order
Software Composition Analysis Market Companies Covered in this Report
- Synopsys Inc.
- Sonatype Inc.
- Snyk Ltd.
- Veracode Inc.
- Mend.io (White Source Ltd.)
- Flexera (Revenera)
- Contrast Security Inc.
- OpenText Corp.
- Perforce Software Inc.
- Checkmarx Ltd.
- GitLab Inc.
- GitHub (Microsoft Corp.)
- JFrog Ltd.
- Black Duck (Synopsys)
- Endor Labs
- Datadog Inc.
- Palo Alto Networks (Prisma Cloud)
- IBM Corp.
- Broadcom (Symantec)
- Micro Focus (OpenText)
- nexB Inc.
- Qwiet AI
- SecureStack
Market Opportunities and Future Outlook
SBOM consumption maturity and operationalization create a clear whitespace across government and regulated-industry buyers, where the focus is shifting from initial inventory generation to ongoing use of SBOM data in security workflows. CISA's SBOM consumption recommended practices (2024) and the 2025 Minimum Elements update emphasize machine-processable SBOMs and practical use in vulnerability response. This increases the value of tooling that normalizes SBOM formats (SPDX/CycloneDX), enriches components with vulnerability intelligence, and maps findings into ticketing and CI/CD workflows.
Policy shifts are also moving buyers from checklist compliance toward measurable risk reduction, strengthening the case for platforms that provide reachability and exploitability context and connect outputs to automated remediation. The White House Memorandum M-26-05 (January 2026) moved federal guidance toward a risk-based approach to software and hardware security while continuing to support SBOMs in contractual terms, strengthening procurement alignment with continuous assurance rather than one-time documentation. At the same time, the EU Cyber Resilience Act's phased applicability in 2026 for conformity assessment infrastructure and vulnerability reporting tightens post-market vulnerability handling expectations, supporting opportunities for SCA vendors and service partners to package evidence, manage SBOM lifecycles, and run vulnerability disclosure workflows for manufacturers and their software suppliers.
Recent Industry Developments in Software Composition Analysis Market
- June 2026: Snyk launched Evo Agentic Development Security (ADS) within its AI Security Platform to secure development workflows that use autonomous AI agents. The release extends SCA relevance from dependency detection into guardrails and enforcement across agent-driven build and change cycles, aligning with buyer priorities around AI-generated code and transitive dependencies.
- May 2026: Sonatype expanded Sonatype Firewall protections to block malicious open source packages before they enter repository environments. By shifting protection earlier in the software supply chain and applying controls at the repository ingress point, the update supports enterprise programs that standardize policy enforcement across many teams and artifact stores.
- April 2025: Socket acquired Coana to enhance static reachability analysis across large-scale code repositories. The combination strengthens prioritization by focusing remediation on vulnerabilities that are actually reachable in applications, addressing false-positive fatigue that commonly slows developer adoption of SCA findings.
Software Composition Analysis Market Report Scope and Research Methodology
Market Definition and Coverage
For this study, the market covers revenues generated from software composition analysis tools and related services that help organizations identify, track, and manage third party and open source components in software.
Scope exclusions: We exclude general application security testing tools that do not perform dependency and component analysis as a core function.
Segments Covered in This Report
- By Component
- Solutions
- Services
- By Deployment Mode
- Cloud
- On-premises
- Hybrid
- By Organisation Size
- Large Enterprises
- Small and Medium Enterprises
- By Industry Vertical
- IT and Telecom
- BFSI
- Retail and E-commerce
- Government
- Healthcare and Life Sciences
- Manufacturing
- Automotive
- Energy and Utilities
- Other Verticals
- By Geography
- North America
- United States
- Canada
- Mexico
- South America
- Brazil
- Argentina
- Rest of South America
- Europe
- Germany
- United Kingdom
- France
- Italy
- Spain
- Rest of Europe
- Asia-Pacific
- China
- Japan
- India
- South Korea
- Southeast Asia
- Rest of Asia-Pacific
- Middle East and Africa
- Middle East
- Saudi Arabia
- United Arab Emirates
- Turkey
- Rest of Middle East
- Africa
- South Africa
- Nigeria
- Egypt
- Rest of Africa
- Middle East
- North America
Data Sources, Market Sizing, and Validation
Desk Research
Desk work was used to shape the market boundary and to build the first set of demand signals before we spoke to industry participants. We referred to public sources such as NIST guidance on the Secure Software Development Framework, CISA publications on SBOM practices, US executive orders and procurement related documents, and the NVD CVE database to understand how exposure trends and compliance expectations are shifting.
To convert that context into sizing inputs, we also reviewed items such as company filings, investor presentations, reputable cybersecurity press coverage, and documentation from open source foundations and standards bodies. Where needed, we cross checked company level revenue cues and deal activity using paid subscriptions for company financials and intelligence, news and financials, and a patent database for directional innovation tracking. These examples are not exhaustive, and many other public sources were also used to collect, validate, and clarify data points.
Primary Interviews and Surveys
Primary work focused on confirming how SCA is bought and priced, and on separating license, subscription, and service revenues so totals stay comparable across vendors and regions. We spoke with a mix of tool providers, channel and service partners, and enterprise security and DevSecOps stakeholders across major regions to validate adoption timing, renewal behavior, and typical packaging (including cloud and on premises deployments).
Distribution of primary research fieldwork respondents
| Company type | Respondent position | Region |
|---|---|---|
| Top tier: 34% | CXOs: 17% | APAC: 42% |
| Mid tier: 44% | Functional/Unit leaders: 26% | EMEA: 35% |
| Smaller Players: 22% | Managers: 57% | Americas: 23% |
Market-Sizing & Forecasting
The sizing starts with a top-down approach where the addressable pool is reconstructed from software security spend signals and then filtered to SCA specific use cases (dependency inventorying, vulnerability matching, and license compliance). After that, results are checked with selective bottom-up approximations, such as sampled price points for subscriptions and services multiplied by adoption ranges, plus channel checks to avoid overcounting the same revenue twice.
Inputs used in the model include the pace of SBOM related policy adoption, open source dependency intensity in enterprise software builds, vulnerability disclosure volumes and remediation pressure, typical seat or application based pricing patterns, and cloud versus on premises deployment mix. When a vendor reports blended application security revenues, we handle the gap by applying validated splits based on product mix discussions and customer deployment patterns, and then we stress test the split against multiple sources.
Forecasts are built using scenario analysis so that optimistic and conservative adoption paths can be tested, followed by a base case that is anchored to what practitioners expect for budget cycles and rollout speed. Key drivers are projected using a mix of published policy timelines and consensus from interviews on renewal rates, pricing progression, and how quickly SCA shifts from point tools into platform bundles.
Data Validation & Update Cycle
Validation is done through several cross checks so the final number is not driven by a single assumption. We compare outputs with independent signals like security tooling budget direction, SBOM related compliance activity, and vendor revenue cues, and then anomalies are reviewed until the variance can be explained with a clear data trail.
Before sign-off, the model goes through multi step analyst reviews, and re-contacts are triggered when pricing, packaging, or deployment mix looks inconsistent with what we heard in interviews. Reports are refreshed annually, with interim updates when material events occur, and a final pre-delivery pass is completed so clients receive the latest updated view.
Mordor Intelligence's Software Composition Analysis Market Sizing Compared With Other Published Estimates
Published market values for software composition analysis can look far apart because the scope lines are drawn differently and the pricing logic is not always applied in the same way. The timing of currency conversion and how quickly assumptions are refreshed after product packaging changes also create visible gaps.
Key differences usually come from whether studies include only SCA tools or also add adjacent software supply chain security layers, and from how services revenue is counted when it is bundled with licenses. In addition, some models assume faster subscription price lift across the forecast, while others keep pricing flat even as SBOM workflows expand, which then pulls totals in opposite directions.
Benchmark comparison
| Source | Market Size | Gaps in Research Methodology |
|---|---|---|
| Mordor Intelligence | USD 430.12 B (2026) | |
| Industry Research Group A | USD 3.80 B (2025) | The estimate appears to treat SCA as a narrow tool-only category and likely excludes bundled application security revenue and related services, which compresses the total size versus a broader revenue capture. |
| Industry Research Group B | USD 0.25 B (2024) | The figure is anchored to a smaller demand pool and a longer horizon, and it likely uses conservative ASP assumptions and limited inclusion of enterprise platform packaging, which reduces the measured revenue base. |
The spread mainly reflects where the scope is cut and how pricing is normalized across subscription, usage, and services revenue. By updating currency timing and ASP assumptions during the latest refresh and then re-checking them with interview feedback, the model stays aligned to current buying and packaging realities, which is the approach applied by Mordor Intelligence.
Key Questions Answered in the Report
What is driving the rapid expansion of the Software Composition Analysis market?
The market grows at an 17.95% CAGR as mandatory SBOM regulations, escalating supply-chain attacks, and larger DevSecOps budgets elevate Software Composition Analysis from optional scanning to an enterprise-wide necessity.
How large will the Software Composition Analysis market be by 2031?
The Software Composition Analysis market size is projected to reach USD 981.62 billion by 2031, nearly 2.7 times its 2025 valuation.
Which deployment mode is expanding the fastest?
Cloud delivery leads both adoption and growth, holding 62.10% share in 2025 and advancing at a 19.05% CAGR because SaaS models align with agile CI/CD pipelines.
Why is healthcare the fastest-growing vertical for Software Composition Analysis?
FDA rules now require medical-device manufacturers to submit SBOMs and maintain continuous vulnerability management, fueling an 18.12% CAGR for Healthcare and Life Sciences through 2031.
What is the biggest operational challenge in rolling out Software Composition Analysis?
Organizations cite a shortage of skilled talent capable of interpreting scan findings and high false-positive volumes that erode developer trust, both of which restrain adoption momentum.