
Social Robots Market Size and Share
Market Overview
| Study Period | 2020 - 2031 |
|---|---|
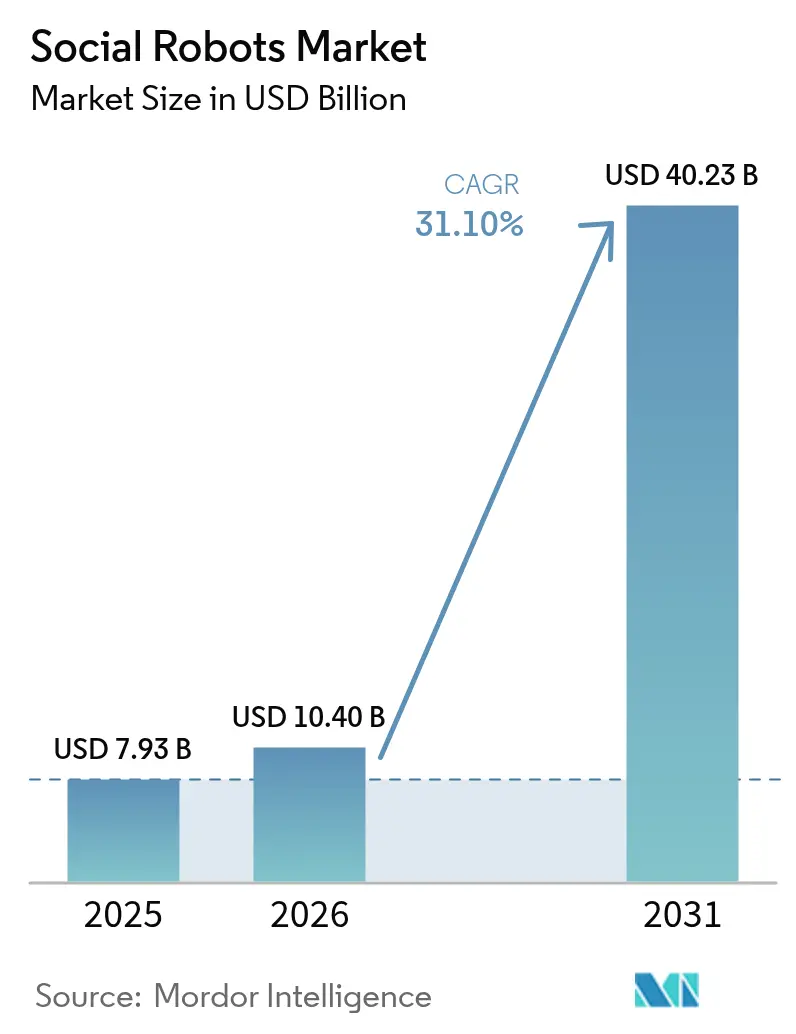
| Market Size (2026) | USD 10.4 Billion |
| Market Size (2031) | USD 40.23 Billion |
| Growth Rate (2026 - 2031) | 31.10% CAGR |
| Fastest Growing Market | Asia Pacific |
| Largest Market | North America |
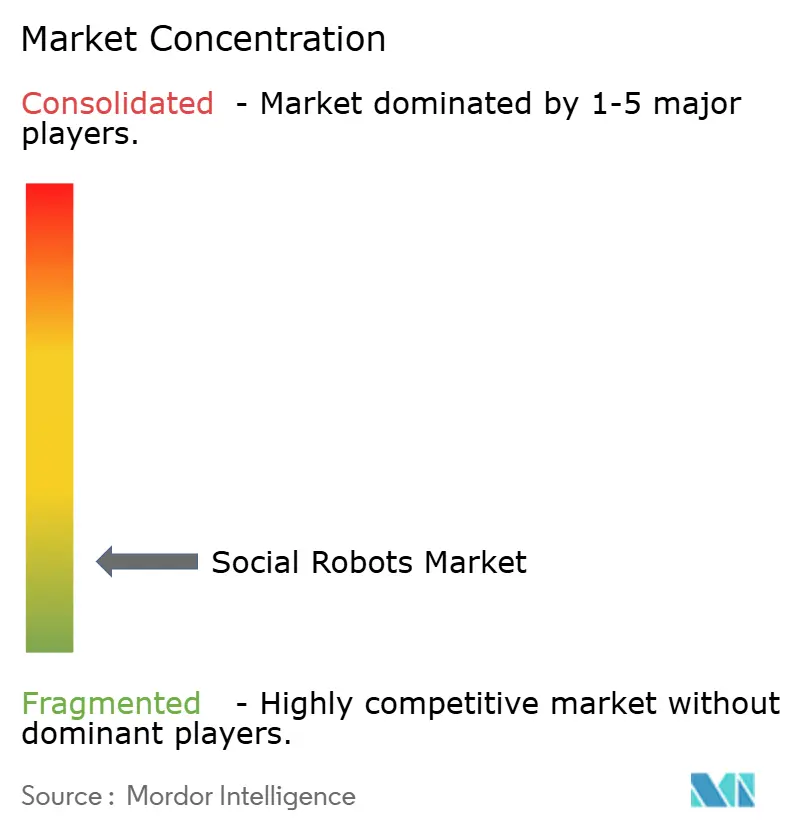
| Market Concentration | Low |
Major Players *Disclaimer: Major Players sorted in no particular order Image © Mordor Intelligence. Reuse requires attribution under CC BY 4.0. | |
Social Robots Market Analysis by Mordor Intelligence
The social robots market size is expected to grow from USD 7.93 billion in 2025 to USD 10.4 billion in 2026 and is forecast to reach USD 40.23 billion by 2031 at 31.1% CAGR over 2026-2031. Steep gains stem from the pairing of large-language-model (LLM) software layers with ever-cheaper sensing and actuation hardware, which together make empathetic, conversational machines commercially viable. Institutional buyers in elder-care, hospitality, and education are choosing turnkey robot-as-a-service contracts that flatten upfront costs and shorten payback periods. Rapid progress in multimodal sentiment analysis enables robots to read facial micro-expressions and voice tone, improving therapeutic outcomes in dementia, autism, and post-acute rehabilitation. Companies are redirecting R&D budgets from form-factor innovation to software frameworks so that a single hardware platform can serve multiple use cases through downloadable skill sets. Large public-sector procurement schemes in Japan, France, and several U.S. states add further momentum, widening the addressable base beyond early adopters.
Key Report Takeaways
- By product type, humanoid robots led with 48.30% revenue share of the social robots market in 2025, while animal-like and companion robots are projected to expand at a 33.55% CAGR through 2031.
- By component, hardware accounted for 57.10% of the social robots market size in 2025; software is forecast to record the fastest growth at 33.08% CAGR to 2031.
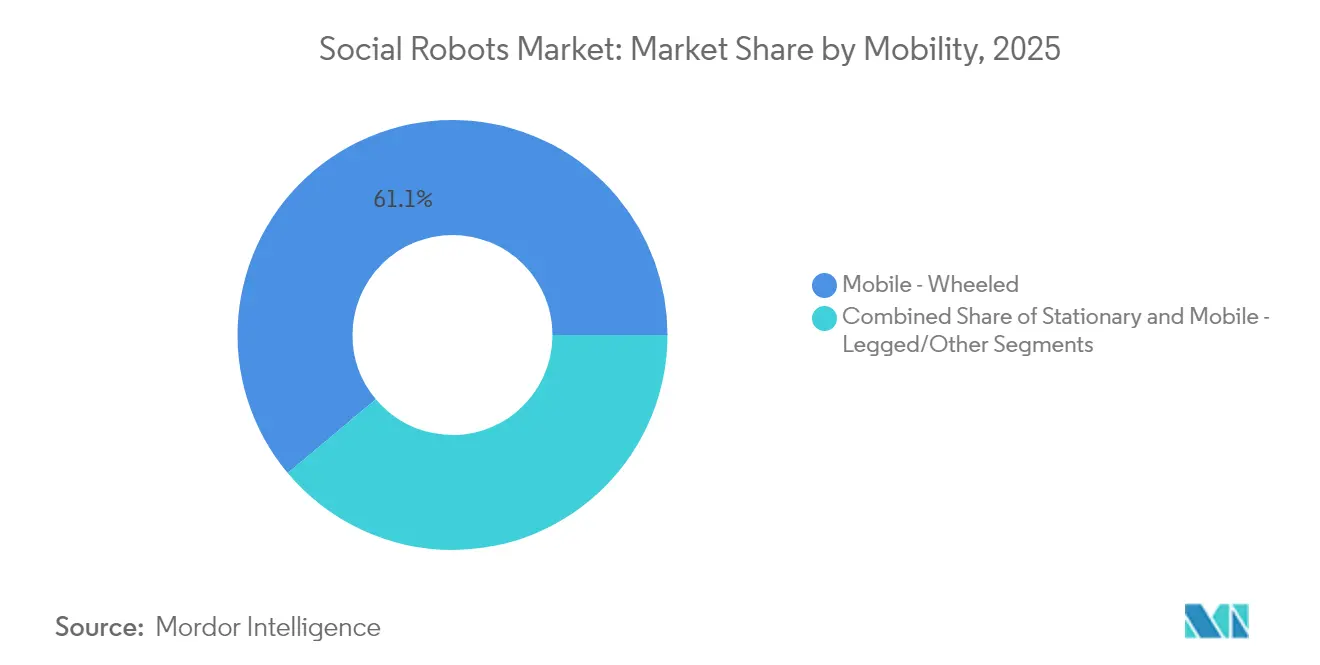
- By mobility, mobile-wheeled platforms held 61.10% share of the social robots market size in 2025, whereas mobile-legged and other advanced solutions are predicted to rise at a 33.30% CAGR.
- By end-user vertical, healthcare commanded 37.85% of the social robots market share in 2025; retail and hospitality applications are advancing at a 33.95% CAGR through 2031.
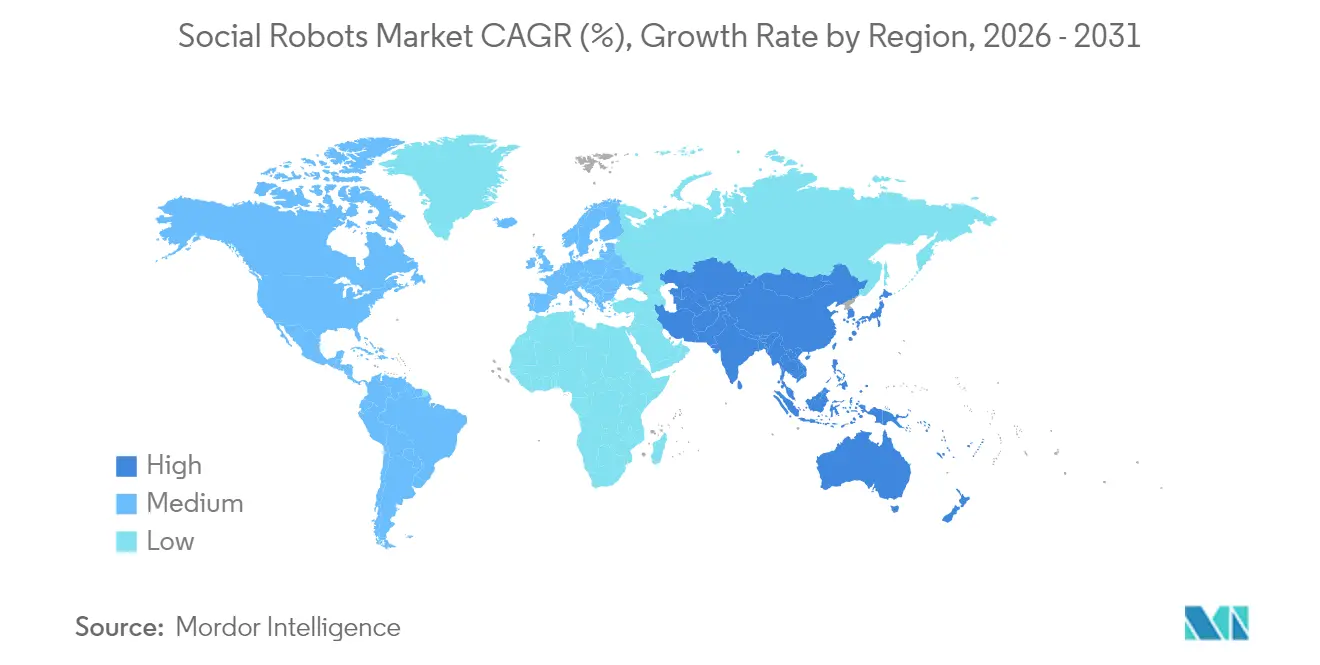
- By geography, North America captured 38.20% share of the social robots market in 2025; Asia-Pacific is the fastest-growing region, progressing at a 33.78% CAGR to 2031.
Note: Market size and forecast figures in this report are generated using Mordor Intelligence’s proprietary estimation framework, updated with the latest available data and insights as of 2026.
Global Social Robots Market Trends and Insights
Drivers Impact Analysis*
| Driver | (~) % Impact on CAGR Forecast | Geographic Relevance | Impact Timeline |
|---|---|---|---|
| AI and NLP breakthroughs | +8.2% | Global, early uptake in North America and Asia-Pacific | Medium term (2-4 years) |
| Rising elder-care demand | +7.8% | Japan, Germany, South Korea | Long term (≥ 4 years) |
| Service-sector labor shortages | +6.4% | North America, Europe, spill-over to Asia-Pacific | Short term (≤ 2 years) |
| Government innovation grants | +4.1% | Asia-Pacific, North America, selective EU states | Medium term (2-4 years) |
| Mental-health therapy integration | +3.7% | North America, Europe, emerging urban Asia-Pacific | Medium term (2-4 years) |
| Corporate ESG spending | +2.3% | Developed markets worldwide | Long term (≥ 4 years) |
| Source: Mordor Intelligence | |||


Accelerating AI and NLP Breakthroughs Enhancing Human-Robot Interaction
Transformer-based language models now sit on-device or on secure edge servers, allowing sub-400 millisecond response times that make conversation feel fluid and spontaneous. Multi-modal fusion engines combine verbal content with facial-action-coding data to gauge user sentiment, driving context-appropriate gestures, lighting cues, or posture adjustments. Field pilots of Intuition Robotics’ ElliQ platform average more than 30 daily interactions per user, demonstrating sustained engagement in older-adult populations.[1]Intuition Robotics, “The Impact of the State-Funded Program on Older New Yorkers’ Quality of Life,” intuitionrobotics.com Software-defined behaviour also slashes localization costs because new languages can be added through cloud-deployed speech-to-text modules rather than hardware swaps. These capabilities enlarge the social robots market by unlocking billable features such as real-time emotional coaching, fall-risk alerts, and family-caregiver dashboards.
Growing Elder-Care Demand Amid Global Ageing Demographics
Japan’s population aged 65 and older reached 36.25 million in 2024.[2]Statistics Bureau of Japan, “Population Estimates Time Series,” stat.go.jp Similar demographic curves unfold across Germany, Italy, and South Korea, stretching human caregiver supply and public health budgets. Government agencies now frame socially assistive robots as core infrastructure for “aging in place” programs that reduce skilled-nursing-facility admissions. A multi-prefecture initiative in Japan offers capital subsidies of up to JPY 500,000 (USD 3,350) per unit for approved elder-care robots, accelerating deployments in residential facilities. Pilot data show 95% of participants report lower loneliness scores after three months of robot companionship. These results reinforce policymakers' confidence and trigger follow-on orders, broadening the social robots market beyond urban centers to rural clinics and home-care networks.
Rising Labor Shortages and Wage Inflation in Service Sectors
Post-pandemic attrition pushed vacancy rates for U.S. front-of-house hospitality roles above 12%, making automation financially attractive. SoftBank Robotics and Sushimatic now co-package a wheeled greeting robot with sushi-making machinery, cutting guest-wait times during peak hours by 25% and trimming staffing costs.[3]SoftBank Robotics, “SoftBank Robotics Announces Its Partnership with Sushimatic,” softbankrobotics.com Blue Frog Robotics’ Buddy concierge platform at CIC Hospitality’s Aiden hotels manages check-in queues and local recommendations, improving Net Promoter Scores by 14 points over baseline. As wage inflation outpaces productivity, payback periods for subscription robots fall under 24 months, widening uptake among independent restaurants, malls, and amusement venues.
Government Innovation Grants and Subsidies for Robotics Adoption
France’s Ministry of National Education deployed 1,750 Buddy telepresence units under the TED-i program to connect homebound students with classrooms, covering hardware and service fees for three-year terms. U.S. state governments fund companion robots for Medicaid beneficiaries through technology-assistance line items, moving robots from pilot status to reimbursable durable-medical-equipment codes. Similar grant schemes in Singapore and South Korea offer 20%–40% capital rebates for certified social robots. These policies lower adoption risk, generate real-world performance data, and cultivate local integrator networks, collectively lifting demand across the social robots market.
Restraints Impact Analysis*
| Restraint | (~) % Impact on CAGR Forecast | Geographic Relevance | Impact Timeline |
|---|---|---|---|
| Algorithmic bias and ethical risk | –4.6% | Global, strictest in Europe under GDPR | Short term (≤ 2 years) |
| High capital cost vs uncertain ROI | –3.8% | Developing markets worldwide | Medium term (2-4 years) |
| Privacy and data-protection hurdles | –2.7% | Europe, North America, emerging APAC | Short term (≤ 2 years) |
| Limited long-term user engagement | –1.9% | Application-dependent | Long term (≥ 4 years) |
| Source: Mordor Intelligence | |||
Algorithmic Bias and Ethical Concerns Surrounding Anthropomorphic Interaction
Regulators note that speech-recognition accuracy can drop when robots engage users with accented English, potentially curbing access to health-advice modules. The European Commission’s AI Act adds risk-classification rules requiring proven safeguards for robots performing social-assistance roles. Developers now embed on-device differential-privacy filters and bias-auditing pipelines, but certification costs lengthen time-to-market. In healthcare settings, informed-consent directives mandate clear disclosures about data use and emotional profiling, leading hospitals to adopt opt-in interaction modes and periodic transparency reports. Compliance overhead tempers near-term expansion, though robust governance models may ultimately boost public trust.
High Capital Cost Versus Uncertain ROI for Small Enterprises
A ready-to-deploy Buddy Pro+ system lists at EUR 3,425.51 (USD 3,664), while multi-site hospitality rollouts add software seats, charging docks, and support packages that double the total cost of ownership. Subscription models help, yet small clinics still weigh monthly fees against unpredictable reimbursement flows. Industry associations now publish ROI calculators covering foot-traffic uplift, reduction in staff overtime, and falls-prevention savings. Transparent metrics will be central to sustained growth, pushing vendors to bundle impact dashboards with every deployment.
*Our forecasts treat driver/restraint impacts as directional, not additive. The impact forecasts reflect baseline growth, mix effects, and variable interactions.
Segment Analysis
By Product Type: Companion Designs Accelerate on Emotional Engagement Advantages
Humanoid platforms hold a 48.30% slice of the social robots market size, but the emotional resonance of pet-like form factors is steering demand toward companion designs growing at a 33.55% CAGR. Interaction studies in dementia care show animal-inspired robots elicit higher sustained attention, reducing agitation episodes by nearly 15%. Vendors exploit this finding by coupling soft-touch skins with adaptive voice-tone modulation, achieving richer affective cues without expensive servo-actuated facial arrays. Telepresence units fill remote-learning and corporate-collaboration niches where visual embodiment, not physical assistance, is the core value. The widening diversity of form factors lets integrators match robot personality to context, supporting wider penetration of the social robots market across customer-experience touchpoints.
Human-centric design shifts also influence procurement criteria. Elder-care administrators report easier resident acceptance of small, non-bipedal robots that pose no fall hazard. This acceptance reduces staff supervision time and drives repeat orders, while the open-source Buddy SDK encourages local app developers to add culturally relevant content. Collectively, these trends favor agile manufacturers whose design pipelines pivot quickly, underscoring how software modularity and cloud-update pathways now outweigh anthropomorphic fidelity when buyers evaluate options in the social robots market.


By Component: Software and Services Outpace Hardware in Value Capture
Hardware continues to generate 57.10% of the social robots market share, yet commoditized sensors and single-board computers compress margins annually. Vendors counter by introducing tiered software licenses that unlock higher-order cognitive skills such as memory-anchored conversations or autonomous navigation in crowded retail aisles. The social robots market size attributable to software subscriptions is forecast to swell rapidly, fueled by recurring revenue from syntax-update packs, language expansions, and specialized therapy modules. Meanwhile, professional services covering workflow mapping, cloud-security audits, and staff training gain prominence as mainstream customers require turnkey integration.
The migration resembles past shifts in the smartphone and industrial-robot fields: once standardized hardware stabilizes, differentiation moves to operating-system ecosystems and service wrappers. Pepper for Home 2.0 exemplifies this paradigm, embedding generative-AI chat functions behind safety guardrails to moderate content, then charging users a monthly fee for premium skill packs because software updates deliver visible functionality without physical retrofits, customer lifetime value rises, reinforcing vendor incentives to prioritize AI research over mechanical innovation.
By Mobility: Wheeled Dominance Persists While Legged Platforms Extend Reach
Wheeled robots own 61.10% of the social robots market size because smooth indoor flooring dominates healthcare, education, and retail spaces. These platforms balance energy efficiency with maintenance simplicity, ensuring 99% uptime in multi-shift service environments. Yet legged locomotion is gathering speed at a 33.30% CAGR as torque-dense actuators and real-time balance algorithms mature. Hospitals exploring in-room patient lifts or ward-round accompaniment require stair-climbing ability, an area where legged units excel. Early prototypes demonstrate sub-2-centimeter foot-placement accuracy, meeting safety norms for patient-interactive devices.
Stationary kiosks remain relevant in high-traffic transit hubs where physical mobility adds little value. For example, a fixed Buddy attendant at Paris-Orly Airport answers 600 daily passenger queries with 92% satisfaction ratings. Each mobility archetype, therefore, targets distinct situational needs, but advanced locomotion will broaden total addressable deployments and raise the technological entry bar for new entrants seeking to penetrate the social robots market.
By End-User Vertical: Healthcare Still Leads but Commercial Segments Race Ahead
Healthcare contributes 37.85% of 2025 revenue as insurers approve reimbursements for fall-detection alerts and medication-reminder conversations. Robots help clinicians run cognitive-stimulation sessions, freeing 8–10 minutes per patient per day. However, retail and hospitality deployments are rising at a 33.95% CAGR as managers automate greeting, shelf-stock inquiries, and queue management. A mid-sized supermarket chain in South Korea reported that customer-interaction robots cut wait times by 18% and boosted basket size by 5%, driving chain-wide rollouts.
Educational institutions leverage telepresence variants to include long-term sick students in classroom life, while entertainment venues use interactive dance and trivia features to deepen visitor immersion. Corporate lobbies adopt mobile guides that escort guests to meeting rooms, slashing manual reception workload by 40%. This diversification signals that commercial volumes may soon eclipse medical units, realigning competitive dynamics inside the social robots market.
Geography Analysis
North America controls 38.20% of current revenue thanks to venture-capital depth, state innovation grants, and fast-track FDA pathways for wellness devices. New York’s statewide companionship program recorded an average of 33 daily interactions per senior and a 95% satisfaction rate, prompting other U.S. states to issue similar RFPs. The region’s privacy statutes are less stringent than GDPR, letting vendors iterate software features more rapidly, though HIPAA obligations keep medical-record modules under strict encryption and audit trails. Canada mirrors U.S. demand drivers, with provincial health ministries funding pilot fleets in remote First Nations communities to counter caregiver scarcity.
Asia-Pacific is the growth engine with a 33.78% CAGR. The Tokyo metropolitan government funds caregiver-assistant pilots that bundle robot leases with caregiver-training curricula, aiming to cut institutional staffing gaps by 10% within five years. China’s robotics clusters in Shenzhen and Suzhou deliver cost-optimized components, enabling domestic brands to price units 25% below global averages without compromising AI capabilities. South Korean telecom carriers integrate 5G edge computing into mall and airport robots, offering robot-as-a-service bundles that include data analytics dashboards.
Europe shows steady uptake balanced by a rigorous compliance culture. Hospitals in Germany deploy companion units only after passing ethical committee reviews and data protection impact assessments, extending procurement cycles but ensuring robust governance. France’s TED-i education initiative, the largest publicly funded telepresence rollout to date, validates the cost-effectiveness of remote-presence robots in mainstream schooling. Nordic elder-care systems test mobile-legged robots for winter-terrain home visits, indicating climatic factors also shape regional adoption patterns.

Regulatory Landscape
Compliance requirements for social robots are tightening across major regions because these systems combine physical interaction with continuous collection of voice, image, and behavioral data. In the European Union, Regulation (EU) 2024/1689 (AI Act) adds risk-based obligations for AI systems, and robots covered by product safety rules also face parallel conformity requirements under machinery legislation. That dual compliance track increases the burden for documentation, transparency, and safety controls for human-facing robots.
China is moving toward more specific governance for anthropomorphic and emotionally interactive services. The Cyberspace Administration of China (CAC) and other departments issued the Interim Measures for the Administration of AI Anthropomorphic Interactive Services on April 10, 2026 (effective July 15, 2026), setting guardrails relevant to conversational and companion robot deployments. Standards and industry frameworks are also shaping global design baselines, with ISO 13482:2014 widely referenced for personal care robot safety and ISO 31101:2023 guiding safety management for service robot application services in unstructured environments. In the United States, proposed federal procurement restrictions (for example, S. 3275 in the 119th Congress) point to national security considerations alongside privacy and safety compliance.
Value Chain Analysis
The social robots value chain runs from upstream electromechanical components (sensors, actuators, compute modules, batteries, cameras, and microphones) to midstream robot OEMs and OS or framework providers (robot operating stacks, speech and vision models, and multimodal sentiment engines). Downstream, integrators and channel partners serve healthcare providers, hospitality operators, education programs, and telecom or cloud partners delivering robot-as-a-service. As software becomes a larger value-capture layer, vendors increasingly package recurring subscriptions for conversational skills, monitoring dashboards, and localization modules, supported by professional services such as workflow design, cybersecurity audits, staff training, and fleet management.
Standardization and scale manufacturing are also becoming more visible across the chain. In February 2026, IEEE approved IEEE 7014.1 for ethical design of empathic, partner-based AI, providing a reference point for interaction design and safeguards. China also advanced industrial coordination through a national humanoid robotics standard system unveiled in March 2026 by a MIIT-related technical committee, spanning areas such as safety, ethics, and components, which helps align upstream suppliers and assemblers toward more interoperable parts and compliance-ready designs. On the commercialization side, UBTECHs June 2026 launch of the UWORLD U1 Series, described as mass-produced full-size companion humanoids with reported order volume at launch, highlights how capacity, component sourcing, and after-sales service networks are becoming decisive differentiators for large deployments.
Competitive Landscape
No single vendor holds more than 10% share, leaving the social robots market moderately fragmented. Incumbents such as SoftBank Robotics focus on open-source ROS2 compatibility, inviting independent developers to add hospitality or retail skill sets that widen addressable use cases. Blue Frog Robotics cultivates a partner marketplace where agencies can resell Buddy-based concierge solutions under white-label agreements, expanding geographic reach without direct capital outlay. Intuition Robotics positions itself squarely in healthcare, layering HIPAA-compliant dashboards and predictive analytics modules that generate subscription revenue well after initial installation.
Start-ups that specialize in clinical therapy, speech-language rehabilitation, autism intervention, or post-stroke motor-skills retraining gain traction by securing peer-reviewed evidence and CE marks, raising entry barriers around domain knowledge. Hardware commoditization pressures pure-play manufacturers; success hinges on proprietary AI stacks, developer ecosystems, and service portfolios rather than electromechanical novelty. Strategic alliances between robotics firms and telecom carriers, cloud-service providers, or medical-device channels are multiplying as each participant seeks bundle economics and data-monetization upside.
Social Robots Industry Leaders
SoftBank Robotics Group Corp.
Blue Frog Robotics SAS
Intuition Robotics Ltd.
Furhat Robotics AB
Amy Robotics Co. Ltd.
- *Disclaimer: Major Players sorted in no particular order

Market Opportunities and Future Outlook
A whitespace is opening around software-defined capability layers that let one hardware platform serve multiple use cases through downloadable skill sets, particularly where buyers favor robot-as-a-service contracts that bundle updates, support, and security controls. This is reinforced by vendor moves toward centralized orchestration and reusable cognitive stacks across form factors, such as Pudu Robotics showcasing a Visual-Language-Model-based Physical Agent architecture ("One Brain, Multiple Embodiments") at WAIC 2026, and ASUS introducing its Maestro AI orchestration platform alongside service and in-home companion robot concepts at Computex 2026. These approaches expand the addressable ecosystem for third-party developers, integrators, and vertical application partners by shifting differentiation away from mechanics and toward software, data governance, and deployment tooling.
Public procurement and reimbursement-linked pathways remain a concrete avenue for scaling, especially in elder-care and education where programs already fund deployments, including Frances TED-i rollout of 1,750 Buddy telepresence units and U.S. state programs positioning companion robots within Medicaid-related technology assistance. At the same time, region-specific compliance regimes, such as Chinas CAC Interim Measures effective July 15, 2026 for AI anthropomorphic interactive services and the EUs AI Act obligations, are driving demand for privacy-by-design sensor packages, content guardrails, audit trails, and opt-in interaction modes that vendors can productize as premium compliance modules. Industrialization signals from mass-production claims in consumer-facing humanoids, such as UBTECHs June 2026 UWORLD U1 launch with disclosed RMB pricing and reported order counts at launch, also underscore opportunity for downstream financing, servicing, and fleet-operations partners that reduce total cost of ownership for institutions.
Recent Industry Developments
- May 2026: SoftBank Robotics debuted its autonomous cooking robots, STEAMA and FLAMA, at the National Restaurant Association Show 2026 in Chicago. The launch broadened the companys food-service automation portfolio beyond customer interaction, supporting bundled deployments that combine front-of-house engagement with back-of-house throughput.
- March 2026: Intuition Robotics announced that its ElliQ AI care device became available to eligible Washington Medicaid recipients. The move ties companion robotics more directly to public healthcare funding pathways, strengthening the case for scaled deployments that include caregiver dashboards and ongoing service subscriptions.
- June 2025: Aldebaran Robotics, known for the Pepper and NAO social robots, entered receivership. This created uncertainty for installed fleets and maintenance continuity, while also opening room for competitors and integrators to pursue replacement cycles and service takeovers.


Research Methodology Framework and Report Scope
Market Definition and Coverage
For this study, the social robots market covers robots designed to interact with people through conversation, gestures, and guidance, and to support social engagement in homes and public settings. The value is counted as revenues generated from sales and related offerings that make these robots usable for the end customer.
Scope exclusions: Industrial robots used mainly for factory automation and robots built only for warehouse picking or manufacturing tasks are excluded.
Segmentation Overview
- By Product Type
- Humanoid Robots
- Animal-like/Companion Robots
- Telepresence Robots
- Other Product Types
- By Component
- Hardware
- Software
- Services
- By Mobility
- Stationary
- Mobile – Wheeled
- Mobile – Legged/Other
- By End-User Vertical
- Healthcare
- Education
- Entertainment and Media
- Retail and Hospitality
- Corporate and Public Sector
- Other End-User Verticals
- By Geography
- North America
- United States
- Canada
- Mexico
- South America
- Brazil
- Argentina
- Chile
- Rest of South America
- Europe
- Germany
- United Kingdom
- France
- Italy
- Spain
- Rest of Europe
- Asia-Pacific
- China
- Japan
- South Korea
- India
- Singapore
- Australia
- Rest of Asia-Pacific
- Middle East and Africa
- Middle East
- Saudi Arabia
- United Arab Emirates
- Turkey
- Rest of Middle East
- Africa
- South Africa
- Nigeria
- Egypt
- Rest of Africa
- Middle East
- North America
Data Sources, Market Sizing, and Validation
Desk Research
We start by mapping what a social robot is in real deployments, and where it is actually bought and used, so the market boundary stays practical. Public sources are used to anchor the demand context and technology direction, such as International Federation of Robotics publications, OECD and World Bank indicators, US FDA device databases for relevant assistive and care adjacent deployments, Eurostat datasets, and patent publications from major patent offices.
After that, we pull structured signals that connect demand to spend, such as import and export patterns, public procurement notes, and adoption programs reported by ministries or municipal agencies. We also review company filings, investor presentations, product documentation, and reputed press to understand pricing and business models, including robot as a service, and to capture launch timing. For hard-to-collect company financial splits and patent landscaping, we selectively use paid subscriptions for company financials and intelligence, news and financials, and patent databases. The sources listed here are illustrative, and many other public and paid sources are also checked for data collection, validation, and clarification.
Primary Interviews and Surveys
Primary work is used to pressure-test what we see in documents, especially on what buyers count as a social robot, typical deal sizes, and the share of revenue coming from hardware versus software and services. We interview a mix of manufacturers, component suppliers, distributors, system integrators, and institutional buyers across healthcare, education, hospitality, and retail, then reconcile differences across regions so assumptions do not drift.
Distribution of primary research fieldwork respondents
| Company type | Respondent position | Region |
|---|---|---|
| Top tier: 37% | CXOs: 17% | APAC: 42% |
| Mid tier: 41% | Functional/Unit leaders: 26% | EMEA: 34% |
| Smaller Players: 22% | Managers: 57% | Americas: 24% |
Market-Sizing & Forecasting
Our sizing starts with a top-down demand pool build that links social-robot spending to where deployments happen, then splits by region and end use using adoption patterns we see in service-robot activity. We cross-check the model with selective bottom-up approximations, including sampled average selling price ranges multiplied by estimated unit deployments in a few priority use cases, and channel checks on how often robot as a service is chosen versus upfront purchase.
Key inputs in this market include robot shipment and installed base signals in service robotics, the share of institutional use in elder care and education settings, typical contract structures (subscription versus capital sale), hardware cost deflation for sensors and compute, and the pace of new capabilities in natural language interaction that unlock new deployments. When a bottom-up check is incomplete for smaller countries or smaller suppliers, we fill the gap using proxy adoption ratios tied to population age mix, hospital and care capacity, and education spending, then normalize the result back to the top-down envelope.
For forecasting, we mainly use scenario analysis because adoption can jump when procurement programs expand or when price points fall below buyer thresholds. Assumptions for penetration, pricing progression, and mix shift into services are reviewed with interview feedback, and then applied consistently year by year so the forecast is repeatable.
Data Validation & Update Cycle
We validate outputs by triangulating multiple checks, so the final number is not driven by one data stream alone. Model totals are compared with independent signals like service-robot shipment trends, procurement announcements, and revenue mix commentary, then unusual jumps are reworked until the drivers are clear.
Before sign-off, numbers pass through step-by-step analyst review where assumptions, currency conversions, and split logic are examined for variance against peers and historical patterns. If a major product launch, regulatory change, or demand shock is observed, respondents are re-contacted to confirm what changed and how it should be reflected. The report is refreshed annually, with interim updates for material events, and a final pre-delivery pass is done so clients receive the latest view.
Mordor Intelligence's Social Robots Market Estimate Compared With Other Published Estimates
Published market sizes for social robots can look far apart because each publisher draws the line differently on what counts as a social robot and what is treated as adjacent service robotics. Differences also come from how revenues are counted, especially when subscriptions, services, and pilot deployments are mixed with upfront robot sales.
The biggest gap drivers usually sit in scope and pricing logic. Some estimates bundle telepresence, rehabilitation, or toy-like products without a consistent rule for whether the product is mainly used for social interaction, and then apply aggressive price curves even when procurement budgets stay fixed. Timing choices matter too, since currency conversion dates and refresh cadence can change the current-year number when fast growth is underway.
Benchmark comparison
| Source | Market Size | Gaps in Research Methodology |
|---|---|---|
| Mordor Intelligence | USD 10.40 B (2026) | |
| Industry Tracker A | USD 7.66 B (2025) | Uses a different base year and tends to group components and end users more broadly, which can undercount service-heavy contracts when revenues are recognized over time. |
| Specialty Research House B | USD 7.40 B (2026) | Leans on a narrower included set of robot types and applies uniform average prices across regions, which can miss the higher institutional spend seen in care and education deployments. |
By tracking key deployment settings, pricing mix shifts, and refresh triggers, Mordor Intelligence keeps the social-robot boundary tied to interaction-led use cases and avoids blending in adjacent automation categories. The spread in the table mainly reflects base-year selection, what is included as a social robot, and how recurring revenues are treated, which are all choices that materially move the total.


Key Questions Answered in the Report
What revenue level does the social robots market reach by 2031?
Published forecasts show the social robots market size climbing to USD 40.23 billion by 2031 at a 31.1% CAGR.
Which region grows fastest in social robot deployments?
Asia-Pacific records the highest CAGR at 33.78% through 2031, propelled by Japan’s aging population and large public subsidies.
Which end-use segment currently generates the largest robot demand?
Healthcare leads with 37.85% of 2025 revenue thanks to wide uptake in elder-care, rehabilitation and mental-health programs.
How are vendors shifting their revenue models?
Providers now emphasize software subscriptions and professional services that add recurring income beyond the initial hardware sale.
What primary barrier slows adoption among small enterprises?
High total cost of ownership versus uncertain ROI remains the strongest deterrent, especially where upfront capital subsidies are absent.
Page last updated on:






