
Market Overview
| Study Period | 2020 - 2031 |
|---|---|
| Market Size (2026) | USD 118.89 Billion |
| Market Size (2031) | USD 254.31 Billion |
| Growth Rate (2026 - 2031) | 16.42 % |
| Fastest Growing Market | Asia Pacific |
| Largest Market | Asia Pacific |
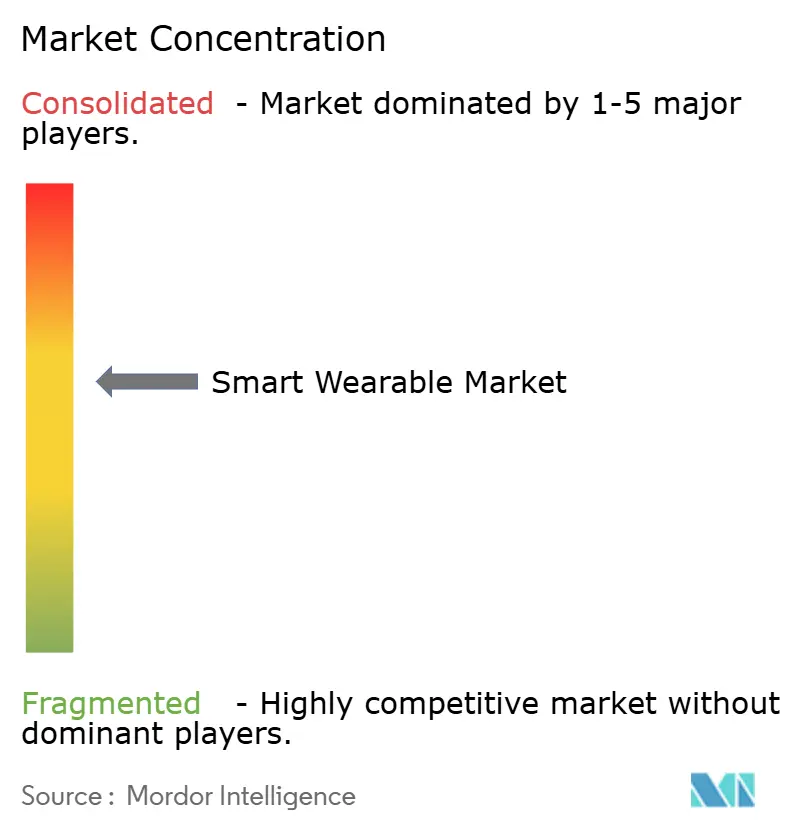
| Market Concentration | Medium |
Major Players *Disclaimer: Major Players sorted in no particular order Image © Mordor Intelligence. Reuse requires attribution under CC BY 4.0. | |
Smart Wearable Market Analysis by Mordor Intelligence
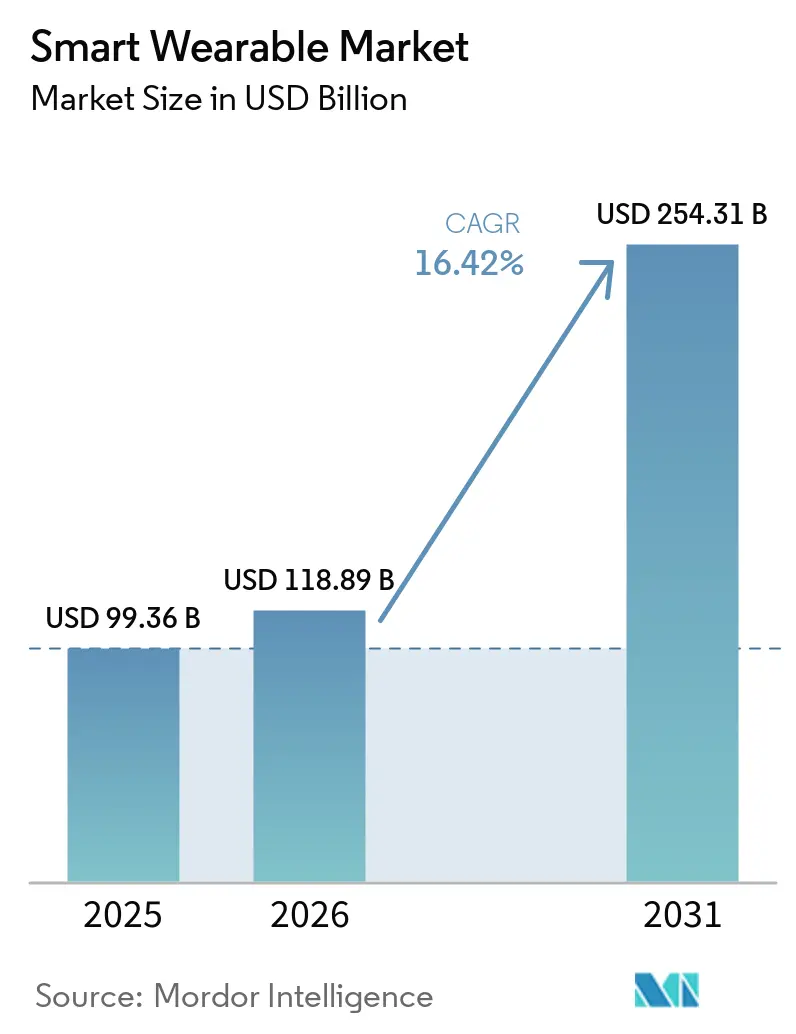
The Smart Wearable Market size is expected to grow from USD 99.36 billion in 2025 to USD 118.89 billion in 2026 and is forecast to reach USD 254.31 billion by 2031 at 16.42% CAGR over 2026-2031.
Rapid migration from discretionary gadgets toward clinically credible health infrastructure, widening reimbursement schedules from public insurers, and on-device artificial intelligence that removes cloud latency are accelerating adoption. Hardware innovation is converging with subscription software, allowing vendors to capture recurring revenue while users gain longitudinal coaching. Asia Pacific is outpacing every other region on the back of subsidy-led volumes in China, low-priced models in India, and 5G rollouts in South Korea. Meanwhile, the United States and Canada continue to monetize medical use cases under newly codified remote-monitoring codes. Competitive intensity remains high, yet defensible niches are forming in smart rings, non-invasive biosensing, and exoskeletons.
Key Report Takeaways
- By product, smartwatches commanded 60.39% of smart wearable market share in 2025, while smart rings and jewelry are advancing at a 17.05% CAGR through 2031.
- By component, hardware captured 71.22% of the smart wearable market size in 2025, but services and subscriptions represent the fastest trajectory at a 16.94% CAGR to 2031.
- By connectivity, Bluetooth and Bluetooth Low Energy dominated with 67.84% revenue share in 2025, whereas 5G stand-alone modules are forecast to grow at a 17.52% CAGR.
- By end-user, consumer lifestyle uses held 38.19% of revenue in 2025, yet healthcare and remote patient monitoring will accelerate at a 16.84% CAGR on the back of reimbursement frameworks.
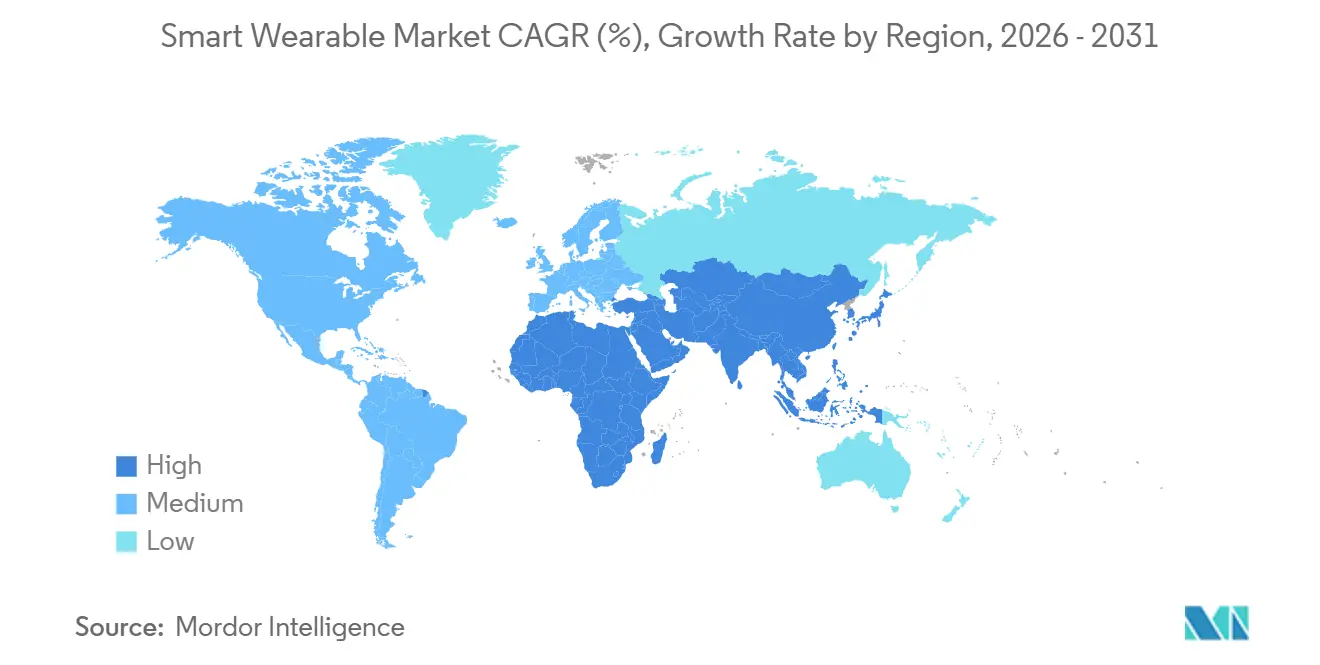
- By geography, Asia Pacific held 34.91% of 2025 revenue, and the region is projected to register the highest 17.31% CAGR through 2031.
Note: Market size and forecast figures in this report are generated using Mordor Intelligence’s proprietary estimation framework, updated with the latest available data and insights as of January 2026.
Market Trends and Insights
Drivers Impact Analysis of Smart Wearable Market*
| Driver | (~) % Impact on CAGR Forecast | Geographic Relevance | Impact Timeline |
|---|---|---|---|
| Rising Health-and-Fitness Consciousness Among Consumers | +2.80% | Global, with urban concentration in North America, Europe, Asia Pacific | Medium term (2-4 years) |
| Enterprise Digital-Wellness Programs Boosting Device Subsidies | +2.10% | North America and Europe, expanding to Asia Pacific multinational hubs | Medium term (2-4 years) |
| Insurance-Approved Wearables for Cardiac Remote Monitoring in North America | +3.20% | North America, with pilot expansions in United Kingdom and Germany | Short term (≤ 2 years) |
| China's Dual-Use (Consumer and Medical) Smartwatch Subsidies Through Healthy China 2030 | +2.90% | China, with spillover to Southeast Asia | Medium term (2-4 years) |
| Rise of AI-on-Chip Wearables Enabling Continuous Glucose Monitoring Without Needles | +3.50% | Global, led by North America and Europe regulatory approvals | Long term (≥ 4 years) |
| Defense Exoskeleton Procurements Under United States Soldier Lethality Program | +1.40% | United States, with allied-nation co-development in Australia and United Kingdom | Long term (≥ 4 years) |
| Source: Mordor Intelligence | |||
Rising Health and Fitness Consciousness Among Consumers
Daily step counts, heart-rate variability, and sleep-stage scores have become routine metrics, transforming wearables into accountability companions.[1] Apple disclosed that 70% of 2025 Watch Series 9 buyers ranked health tools as the main reason for purchase, up 12 percentage points from 2022. Garmin’s running and cycling portfolio expanded 18% year over year in 2025, boosted by links to Strava and Training Peaks that turn casual joggers into data-driven athletes.[2] Samsung added body-composition analysis to Galaxy Watch 6, offering muscle and body-fat insights previously confined to clinic scales.[3] These medical-grade sensors wrapped in gamified software are sustaining double-digit unit growth even as smartphone replacement cycles lengthen.
Insurance-Approved Wearables for Cardiac Remote Monitoring
Centers for Medicare and Medicaid Services began reimbursing clinician review of wearable-derived electrocardiogram data in 2024, paying USD 50-USD 65 per patient each month. Omron’s HeartGuide watch, the first FDA-cleared oscillometric blood-pressure wearable, gained coverage from UnitedHealthcare and Anthem in 2025, lowering member costs from USD 499 to under USD 100. Withings’ ScanWatch 2 earned FDA clearance for atrial-fibrillation detection, and more than 40 accountable-care organizations embedded its data into Epic and Cerner records by mid-2025. Reimbursement is therefore repositioning wearables from wellness extras to billable diagnostic endpoints.
China’s Dual-Use Smartwatch Subsidies Under Healthy China 2030
Beijing extended its Healthy China 2030 program in 2025, granting a 15% credit or up to CNY 500 (USD 71.4) for smartwatches that hold National Medical Products Administration dual certifications. Huawei’s Watch GT 5 Pro and Xiaomi’s Watch S3 both secured Class II clearances in 2025, enabling domestic brands to undercut imported competitors by 40% while meeting clinical requirements. The subsidy effectively socializes the cost of regulatory validation, accelerating time to market for local vendors and raising entry barriers for foreign brands navigating NMPA pathways.
AI-On-Chip Wearables Enable Needle-Free Glucose Monitoring
Non-invasive biosensing is nearing commercial reality. Know Labs entered pivotal trials in 2025 for its Bio-RFID sensor that reads interstitial glucose through skin using radio-frequency spectroscopy. Rockley Photonics shipped spectrophotometer-on-chip modules to smartwatch OEMs in late 2025, promising multichem analytes including glucose without needles. If successful, these sensors could transition 50 million finger-stick users to continuous monitoring, opening a USD 12 billion revenue pool currently locked in disposable test strips.
Restraints Impact Analysis of Smart Wearable Market*
| Restraint | (~) % Impact on CAGR Forecast | Geographic Relevance | Impact Timeline |
|---|---|---|---|
| Data-Residency Mandates Limiting Cloud Companion Apps in Europe | -1.80% | Europe, with stricter enforcement in Germany, France, Netherlands | Short term (≤ 2 years) |
| High-Density Battery Thermal Runaway Concerns in Ultra-Slim Smartwatches | -1.30% | Global, with heightened scrutiny in North America and Europe | Medium term (2-4 years) |
| Patent-Licensing Litigation Costs for Gesture-Based Smart Rings | -0.90% | Global, concentrated in United States and Europe jurisdictions | Medium term (2-4 years) |
| Low ARPU in South America Limiting 5G Stand-Alone Wearable Roll-outs | -0.70% | South America, particularly Brazil, Argentina, Colombia | Long term (≥ 4 years) |
| Source: Mordor Intelligence | |||
Data-Residency Mandates Limiting Cloud Companion Apps in Europe
Following the Schrems II judgment, EU regulators intensified enforcement in 2025, forcing vendors to host health data within European borders. Apple spent an estimated USD 200 million migrating iCloud Health workloads to German and Irish facilities. Fitbit was fined EUR 8 million for routing user data through U.S. servers without consent, highlighting the financial risk of non-compliance. Smaller brands lacking capital for localized infrastructure face exit decisions or margin-eroding partnerships with regional clouds, raising customer acquisition costs.
High-Density Battery Thermal Runaway Concerns
As manufacturers cram 700 Wh/L lithium-ion cells into sub-10 mm chassis, the margin for thermal error narrows. Samsung recalled 18,000 Galaxy Watch 5 units in March 2024 after swelling incidents, and Apple throttled charging speeds on Watch Ultra 2 models in August 2025 to avert separator degradation. UL revised its 2054 standard to include nail-penetration testing for wearables, adding USD 15,000-USD 25,000 per product to certification cycles. Insurers responded by lifting product-liability premiums 20%-30%, squeezing hardware margins for newcomers.
*Our forecasts treat driver/restraint impacts as directional, not additive. The impact forecasts reflect baseline growth, mix effects, and variable interactions.
Smart Wearable Market Segment Analysis
By Product:
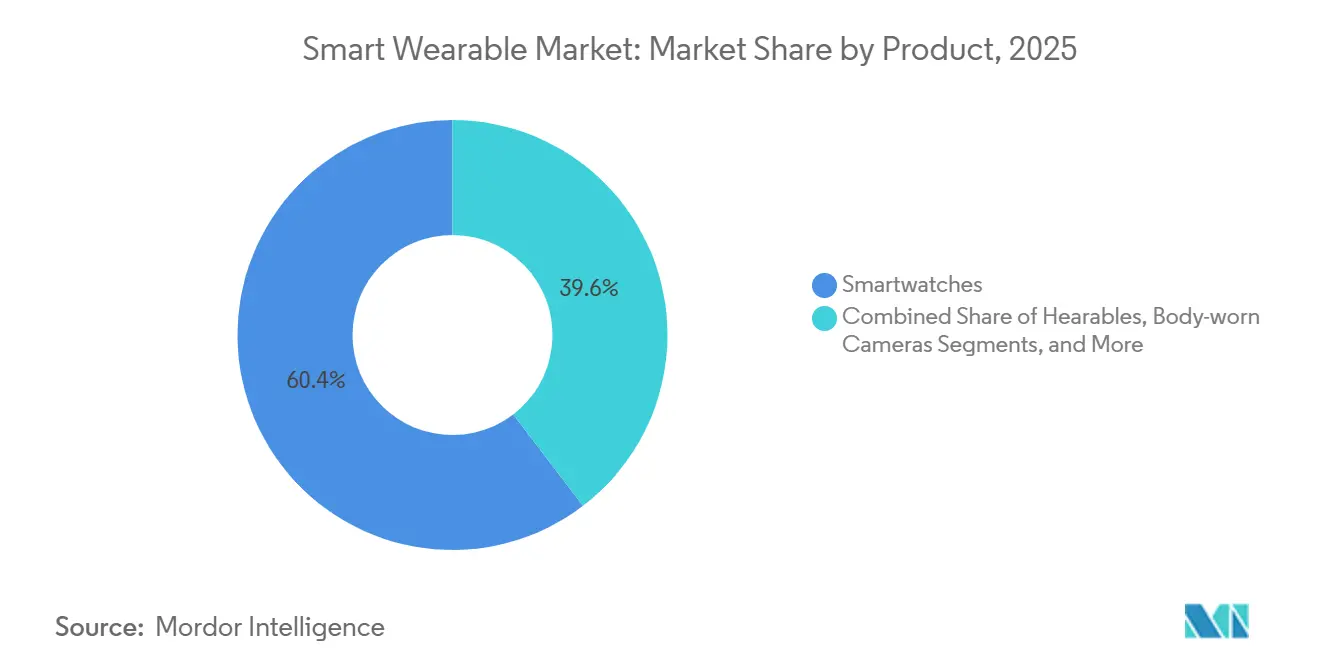
Smartwatches Anchor Revenue, Smart Rings AccelerateSmartwatches delivered 60.39% of 2025 revenue, placing the category at the center of the smart wearable market size, as Apple, Samsung, and Garmin leveraged ecosystem lock-ins and multisport GPS accuracy to defend share. Hearables supplied 18% of shipments, riding Apple AirPods Pro 2’s over-the-counter hearing-aid approval to serve 30 million Americans with mild hearing loss. Fitness bands tapered to 12% as consumers gravitated toward full-stack watches that fuse payments, cellular calls, and health dashboards.
Momentum is shifting toward discreet form factors. Smart rings, led by Oura’s USD 500 million annual subscription run rate and Samsung’s Galaxy Ring, are rising at a 17.05% CAGR, the fastest of any product line in the smart wearable market. Head-mounted displays held 5% share, but Meta’s Quest 3S price drop hints at future volume plays. Niche frontiers in smart clothing, medical patches, and powered exoskeletons contributed a combined 5% yet hold white-space potential, evidenced by Ekso Bionics shipping 120 EVO exoskeletons to the U.S. Army in fiscal 2025.

By Component:
Hardware Dominates, Services SurgeHardware retained 71.22% of 2025 revenue, but the services layer is expanding at a 16.94% CAGR to 2031, repositioning revenue streams inside the smart wearable market. Apple’s services unit topped USD 96 billion in fiscal 2025, with roughly 8% linked to Fitness Plus and iCloud Health storage. WHOOP’s no-upfront-hardware model achieved 1.2 million subscribers at USD 30 monthly, illustrating the valuation upside in annuity cash flows.
Software and companion apps, representing 8% share, underpin hardware utility and open developer ecosystems. Garmin processed more than 50 million Connect IQ downloads in 2025, while Xiaomi’s decision to open-source its HyperOS wearable SDK in March 2025 boosted third-party submissions 150% within six months. Consequently, subscription-centric vendors in the smart wearable industry now trade at 8-12× revenue multiples, compared with 2-4× for hardware-only peers.
By Connectivity Technology:
Bluetooth Leads, 5G Stand-Alone Gains TractionBluetooth and Bluetooth Low Energy accounted for 67.84% of 2025 connections, validating the technology’s low-power advantage and compatibility with smartphones. Cellular standards covering 3G to LTE-M formed a 15% residual base, while NFC claimed 8% through contactless payments. Wi-Fi and WLAN added a combined 6%, catering to bandwidth-hungry headsets.
The horizon, however, belongs to 5G. Stand-alone modules are forecast to expand at a 17.52% CAGR, propelled by Qualcomm’s Snapdragon W5 Plus Gen 2 that integrates a modem yet lowers power draw by 30%. Samsung’s Galaxy Watch 7 LTE already routes SOS calls without a paired phone, and carriers are crafting wearables-only tariffs to widen addressable demand. Bluetooth’s September 2024 launch of version 6.0 introduced centimeter-level ranging that Apple plans to integrate in Watch Ultra 3, reinforcing indoor-positioning use cases.
By End-Use:
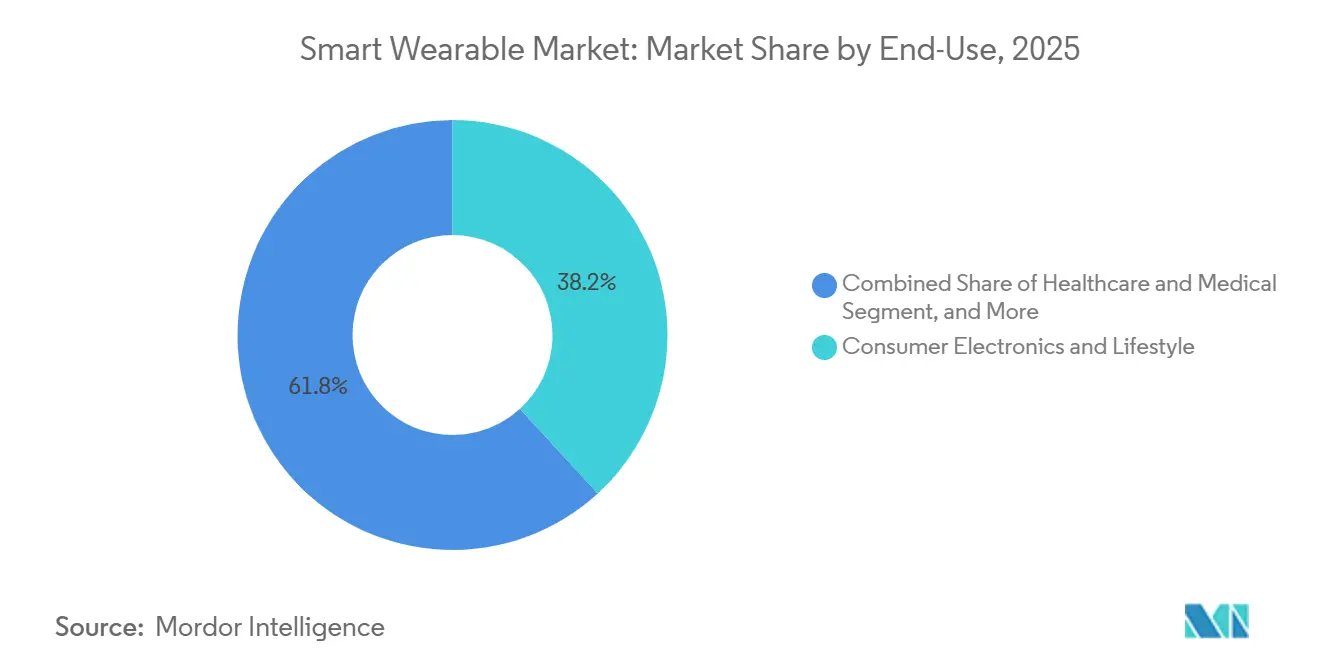
Consumer Lifestyle Dominates, Healthcare AcceleratesConsumer lifestyle remained the largest slice at 38.19% in 2025, reflecting demand for consumer smart wearables shaped by fashion cues, celebrity endorsements, and social media hooks. Yet healthcare and remote patient monitoring are the fastest movers at a 16.84% CAGR, buoyed by Medicare codes that reimburse USD 50-USD 65 monthly per monitored patient. Abbott’s FreeStyle Libre 3 gained 5 million active users by mid-2025, proving insurers will pay when clinical endpoints are clear.
Fitness and sports composed 28% of revenue, anchored by running watches and heart-rate sensors, while industrial safety wearables occupied 6%, with Honeywell’s Connected Worker platform cutting field-incident response times by 35%. Military programs using Microsoft’s Integrated Visual Augmentation System represented 3%, signaling a nascent but strategic channel for ruggedized optics and exoskeletons inside the smart wearable market.
By Distribution Channel:
Online Outpaces OfflineOnline storefronts comprised 55.35% of 2025 revenue and are expanding at a 17.12% CAGR, reflecting the convenience of direct fulfillment and richer customer data capture. Apple’s website accounted for 40% of Watch sales in fiscal 2025, and Amazon’s marketplace moved an estimated USD 8 billion in wearables gross merchandise value. Xiaomi’s Mi.com processed 12 million orders during Singles’ Day 2025 alone, aided by instalment payment options.
Offline retail still controls 44.65%, serving buyers who require hands-on trials or clinical oversight. Best Buy saw an 8% decline in in-store sales as showrooming behaviour intensified, whereas CVS Health piloted wearables-as-a-service bundles in 500 MinuteClinic sites, pairing devices with telehealth subscriptions. Clinics and pharmacies are thus evolving into hybrid channels that merge clinical credibility with subscription economics, underscoring multichannel complexity inside the smart wearable market.
Geography Analysis
APAC Smart Wearable Market
Asia Pacific led with 34.91% revenue in 2025 and is projected to register a 17.31% CAGR to 2031, the quickest regional pace. China’s regulator cleared 47 dual-use smartwatch models in 2025, a 56% jump from 2024, and subsidies of up to CNY 500 (USD 71.4) per unit fostered a volume surge for Huawei, Xiaomi, and Oppo. India’s unit shipments climbed 68%, allowing domestic brands Noise, Fire-Boltt, and boAt to command over 60% share via sub-USD 50 pricing and vernacular apps. Japan expanded reimbursement for wearable-sourced blood-pressure data in April 2025, lifting Omron’s HeartGuide volumes 34% in a single quarter.
North America Smart Wearable Market
North America generated 32% revenue in 2025, anchored by Medicare codes and enterprise wellness budgets. Apple Watch Series 10, released in September 2024 with FDA-cleared sleep-apnea detection, drew an 18% sales mix from users over 50. Provinces in Canada distributed 25,000 subsidized smartwatches for chronic-disease pilots, while Mexico’s market grew 41% on imported stock despite higher tariffs on Chinese devices.
EMEA and South America Smart Wearable Market
Europe supplied 22% revenue but faces the heaviest compliance drag. Germany’s Federal Office for Information Security now demands explicit consent for any cross-border transfer of biometric information, adding as much as three months to launch timelines. The United Kingdom integrated wearable data into the NHS App in 2025, enabling 12 million citizens to share metrics with doctors. South America and Middle East and Africa each represented 6% revenue, with Brazil driving volume yet limited by low ARPU and the United Arab Emirates propelling luxury smartwatch demand.
Regulatory Landscape
Regulatory Landscape: Regulation continues to bifurcate along the wellness versus medical boundary, with sharper compliance requirements once wearables carry diagnostic or treatment claims. In the United States, the FDA updated its General Wellness policy guidance in January 2026, signaling broader enforcement discretion for low-risk wellness wearables that estimate physiological parameters when they avoid disease claims. For medical-grade wearables, the FDA implemented the Quality Management System Regulation (QMSR) in February 2026, aligning quality-system expectations to ISO 13485:2016 and raising documentation and audit readiness requirements for vendors selling regulated patches, biosensors, and clinically positioned smartwatch features.
Europe is tightening traceability and software governance alongside privacy obligations. Under the EU MDR, mandatory EUDAMED UDI device registration became a concrete compliance gate in May 2026, adding operational requirements around registration, post-market surveillance, and traceability for wearable medical devices. The EU AI Act adds a high-risk layer for AI-enabled wearable medical functionality, with obligations applying from August 2026 for new products, pushing vendors to harmonize MDR conformity assessment, AI governance, and GDPR-aligned data handling within the product lifecycle.
Competitive Landscape
The smart wearable market is moderately concentrated. Apple and Samsung jointly held about 45% of 2025 smartwatch revenue, leveraging vertically integrated silicon, proprietary operating systems, and cross-device lock-in. Apple’s S9 SiP brings on-device machine learning that reduces dependence on cloud inference, while Samsung pairs Wear OS with its smartphone install base to cross-sell buds and rings.
Below the top tier, niche specialists are scaling subscription models and FDA-cleared claims. Oura’s Gen 3 ring runs a subscription retention rate above 80% after 12 months, creating annuity economics comparable to enterprise software. WHOOP serves professional sports and corporate wellness verticals, monetizing continuous recovery metrics. Garmin maintains a multisport stronghold by offering endurance athletes up to 60-hour GPS battery life, a feature mass-market brands lack.
White-space categories remain fragmented. Ekso Bionics secured USD 18 million from the U.S. Army for its EVO exoskeleton, reflecting defense appetite for load-bearing augmentation. Patent fights over ring gestures imposed USD 2-USD 5 million legal costs per defendant in 2025, slowing Ultrahuman and RingConn launches. Emerging technology houses such as Know Labs and Rockley Photonics are betting on miniaturized photonics and radio-frequency spectroscopy, aiming to displace glucometer strips and capture a USD 12 billion prize pool by 2030.
Smart Wearable Industry Leaders
-
Apple Inc.
-
Fossil Group Inc.
-
Samsung Electronics Co., Ltd.
-
Garmin Ltd.
-
Alphabet Inc.
- *Disclaimer: Major Players sorted in no particular order
Smart Wearable Market Companies Covered in this Report
- Apple Inc.
- Samsung Electronics Co. Ltd.
- Alphabet Inc. (Fitbit, Google Pixel)
- Garmin Ltd.
- Huawei Technologies Co. Ltd.
- Xiaomi Corporation
- Meta Platforms Inc. (Oculus)
- Sony Group Corporation
- Microsoft Corp.
- Withings SA
- Huami Corp. (Zepp Health)
- GoPro Inc.
- Fossil Group Inc.
- Omron Healthcare Inc.
- Ekso Bionics Holdings Inc.
- Cyberdyne Inc.
- Nuheara Ltd.
- Bragi GmbH
- Sensoria Inc.
- AIQ Smart Clothing Inc.
- Polar Electro Oy
- Coros Wearables Inc.
- Oura Health Ltd.
- WHOOP Inc.
Market Opportunities and Future Outlook
A key whitespace sits at the intersection of clinically credible monitoring and consumer-friendly form factors, where vendors can expand into reimbursable workflows and provider-integrated data streams. North America provides a visible commercialization path as Centers for Medicare and Medicaid Services began reimbursing clinician review of wearable-derived ECG data in 2024 at roughly USD 50 to USD 65 per patient per month, and payer coverage examples such as Omron HeartGuide in 2025 show how reimbursement can compress out-of-pocket price barriers.
Platform-led opportunities are expanding as regulations push clearer delineation of medical-grade quality and EU market access raises the bar on safety, traceability, and cybersecurity. The shift from FDA QSR to QMSR in February 2026 formalizes ISO 13485:2016 alignment for regulated wearable manufacturers, supporting vendors that invest in design controls and post-market processes to win hospital, insurer, and enterprise channels. In Europe, the May 2026 EUDAMED registration requirement and the May 2026 move to EN 62368-1:2026 for consumer electronics on the EU market encourage redesigns around battery safety and documentation rigor, while ETSI CYBER-EUSR activity from April 2026 around Cyber Resilience Act-related standards highlights an emerging compliance-driven opening for secure companion apps and device hardening. On the technology front, on-device AI and broader sensor interpretation models are becoming a differentiator for subscription services and longitudinal coaching, supported by initiatives such as Google Research work on SensorFM for generalizable wearable health data representations.
Recent Industry Developments in Smart Wearable Market
- July 2026: Samsung Electronics announced an upcoming Galaxy Unpacked event scheduled for July 22, 2026, highlighting new Galaxy Watch models positioned around advanced AI-driven health insights. The announcement reinforces competition around on-device intelligence and proactive health features, raising differentiation pressure on watch vendors that rely primarily on hardware refreshes.
- June 2026: Samsung Electronics announced a Samsung Health app update aimed at integrating AI-based proactive health features for an upcoming Galaxy Watch. The move strengthens the software and services layer around the device, aligning with the markets shift toward recurring subscription and coaching value rather than one-time hardware revenue.
- May 2026: Garmin released the Forerunner 70 and Forerunner 170 running smartwatches, adding AMOLED displays and integrated training tools to its sports-focused lineup. The launch underscores continued product segmentation in wearables, where performance athletes and training ecosystems provide defensible niches against mass-market smartwatch platforms.
Smart Wearable Market Report Scope and Research Methodology
Market Definition and Coverage
For this study, the smart wearables market is the revenue earned from connected devices worn on the body that use sensors and software to track, analyze, and share user or operational data, across consumer and enterprise use worldwide.
Scope exclusions: Implantable medical devices and stand-alone fitness equipment are excluded from this market sizing.
Segments Covered in This Report
- By Product
- Smartwatches
- Hearables (Ear-Worn, Smart Earbuds)
- Fitness and Activity Trackers
- Head-Mounted Displays (AR, VR, MR)
- Smart Clothing and Textiles
- Body-Worn Cameras
- Smart Rings and Jewelry
- Medical Wearable Patches and Biosensors
- Powered Exoskeletons
- By Component
- Hardware
- Software and Apps
- Services and Subscriptions
- By Connectivity Technology
- Bluetooth, BLE
- Cellular (3G, 4G, LTE-M)
- 5G Stand-Alone
- NFC, RFID
- Wi-Fi, WLAN
- Others Connectivity Technology (UWB, ANT+)
- By End-Use
- Consumer Electronics and Lifestyle
- Healthcare and Medical
- Fitness and Sports
- Industrial and Enterprise Safety
- Military and Defense
- By Distribution Channel
- Online (Brand E-Store, Marketplaces)
- Offline (Consumer Electronics Stores, Specialty, Clinics)
- By Geography
- North America
- United States
- Canada
- Mexico
- Europe
- Germany
- United Kingdom
- France
- Italy
- Spain
- Rest of Europe
- Asia Pacific
- China
- Japan
- South Korea
- India
- South-East Asia
- Rest of Asia Pacific
- South America
- Brazil
- Rest of South America
- Middle East
- United Arab Emirates
- Saudi Arabia
- Rest of Middle East
- Africa
- South Africa
- Rest of Africa
- North America
Data Sources, Market Sizing, and Validation
Desk Research
We start with desk research to pin down the measurable demand pool and to avoid mixing smart wearables with adjacent consumer electronics categories. Public sources are used to understand device shipment direction, trade flows, and pricing movement that later guide our assumptions.
In practice, this includes references such as ITU indicators for connected device penetration, U.S. International Trade Commission and UN Comtrade trade statistics for relevant electronics categories, and health technology publications indexed in PubMed for adoption patterns of medical-grade wearables. We also use sources such as USPTO and WIPO patent filings to track sensor and form-factor activity, plus company annual reports, investor presentations, and reputable press for product mix and regional commentary. Where needed, a paid subscription focused on company financials and news helps normalize reported revenue timing and currency. These desk research sources are illustrative, and many other public datasets and documents were also used for collection, cross-checking, and clarification.
Primary Interviews and Surveys
Primary work is used to pressure-test the model with people who track real selling prices, channel shifts, and product replacement cycles, and then to refine assumptions that are not visible in public data. We spoke with a mix of device makers, component ecosystem participants, distributors, and large buying organizations across APAC, EMEA, and the Americas so the final sizing reflects regional mix differences and not just one lead market.
Distribution of primary research fieldwork respondents
| Company type | Respondent position | Region |
|---|---|---|
| Top tier: 39% | CXOs: 12% | APAC: 43% |
| Mid tier: 46% | Functional/Unit leaders: 36% | EMEA: 37% |
| Smaller Players: 15% | Managers: 52% | Americas: 20% |
Market-Sizing & Forecasting
Sizing begins from the top down, where device adoption and replacement behavior are reconstructed using connected-device penetration indicators, shipment and trade direction, and the installed base implied by product lifecycles. Once that demand pool is built, it is converted into value using price bands that are aligned to observed retail and channel pricing and then adjusted for regional mix.
To keep the totals realistic, we corroborate the top-line outputs with selective bottom-up checks, such as sampled ASP multiplied by shipment volume for key device families, plus channel checks on how much revenue is captured through direct-to-consumer versus retail partners. When a bottom-up view is incomplete, gaps are handled with conservative proxies like using comparable device ASP curves and applying region-specific mix shares validated through interviews.
Forecasting is done using scenario analysis that is anchored on a few drivers that move this market in a visible way, including smartphone pairing rates, health-feature attach rates, average selling price progression, replacement cycles, and the pace of enterprise adoption in use cases like safety and productivity. Those drivers are stress-tested with expert inputs, and the chosen scenario is the one that best matches near-term shipment momentum and pricing expectations.
Data Validation & Update Cycle
Outputs are validated through multiple checks so we do not rely on one data series or one viewpoint. We compare model totals against independent signals like regional electronics shipment patterns, trade direction, and publicly visible pricing movement, and then investigate outliers before the numbers are finalized.
A second analyst review is completed to re-check assumptions, units, and conversions, followed by re-contact triggers when the variance looks material or when a new product cycle changes mix. Reports are refreshed annually, with interim updates when major events affect pricing, supply, or demand, and a final pre-delivery pass is done so clients receive the most current view.
Mordor Intelligence's Smart Wearables Market Size Versus Other Published Estimates
Published market sizes for smart wearables often vary because the counted device set is not consistent, and because prices and channels are treated differently across models. Differences also come from the base year chosen, the currency timing used for conversion, and whether forecasts assume conservative or aggressive ASP declines.
The table shows a noticeable spread, and in Mordor Intelligence's model the market is limited to connected body-worn devices such as smartwatches, hearables, head-mounted displays, smart clothing, smart rings, and medical-grade patches, while implantables and stand-alone fitness equipment are kept out. When other estimates fold in a wider consumer electronics basket or apply faster growth to premium ASP bands without the same channel and mix checks, the reported market size can land materially higher or lower.
Benchmark comparison
| Source | Market Size | Gaps in Research Methodology |
|---|---|---|
| Mordor Intelligence | USD 118.89 B (2026) | |
| Industry Publisher A | USD 86.65 B (2025) | Uses an earlier base year and a different scope mix that can shift totals, especially when pricing and channel mix are not normalized across regions. |
| Industry Publisher B | USD 66.04 B (2024) | Anchors the estimate on a lower starting-year value and applies a slower growth path, which can understate the impact of faster replacement cycles and premium-feature attach rates. |
Taken together, the comparison points to scope and starting-year choices as the main sources of variation, followed by how ASP trends and regional mix are applied. Our approach stays traceable because each step ties back to observable adoption signals, practical pricing bands, and interview-checked assumptions that can be repeated when the market is updated.
Key Questions Answered in the Report
What is the current value of the smart wearable market?
The smart wearable market size reached USD 118.89 billion in 2026 and is projected to climb to USD 254.31 billion by 2031.
Which product category leads revenue?
Smartwatches generated 60.39% of 2025 revenue, the largest share within the smart wearable market.
Which region is expanding the fastest?
Asia Pacific is forecast to grow at a 17.31% CAGR through 2031, propelled by subsidy-backed demand in China and value-priced models in India.
How big is the services opportunity?
Services and subscriptions, while only 28.78% of 2025 revenue, are expanding at a 16.94% CAGR as vendors shift from one-time sales to recurring fees.
What connectivity trend will reshape wearables?
5G stand-alone modules are expected to record a 17.52% CAGR, enabling untethered video calls and real-time telemedicine without a paired smartphone.
How concentrated is competition?
The market scores 7 on a 10-point concentration scale, with Apple and Samsung commanding 45% of smartwatch revenue but niche players retaining room to grow.