
Smart Water Meter Market Size and Share
Market Overview
| Study Period | 2020 - 2031 |
|---|---|
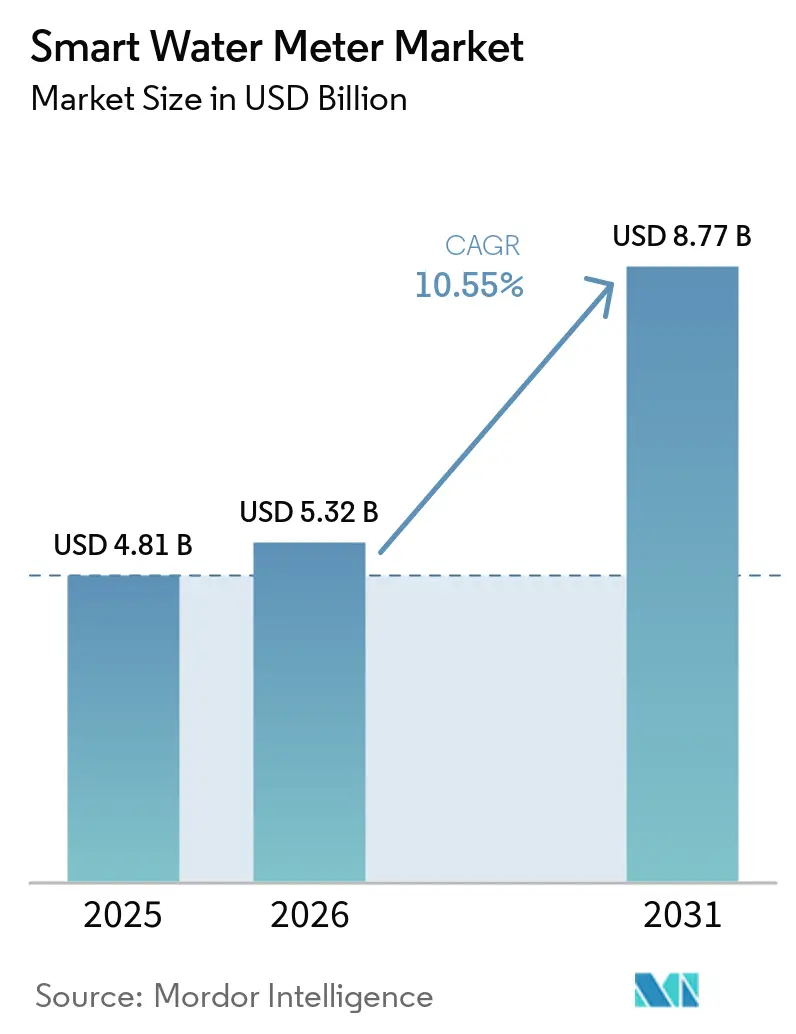
| Market Size (2026) | USD 5.32 Billion |
| Market Size (2031) | USD 8.77 Billion |
| Growth Rate (2026 - 2031) | 10.55 % |
| Fastest Growing Market | Asia Pacific |
| Largest Market | Europe |
| Market Concentration | Medium |
Major Players *Disclaimer: Major Players sorted in no particular order Image © Mordor Intelligence. Reuse requires attribution under CC BY 4.0. | |
Smart Water Meter Market Analysis by Mordor Intelligence
The Smart Water Meter market size was valued at USD 4.81 billion in 2025 and estimated to grow from USD 5.32 billion in 2026 to reach USD 8.77 billion by 2031, at a CAGR of 10.55% during the forecast period (2026-2031). Utilities continue to migrate from mechanical meters to connected devices that enable real-time monitoring, automated billing, and data-driven leak detection. Regulatory mandates for conservation, mounting pressure to replace aging distribution assets, and the expansion of Internet of Things platforms combine to accelerate adoption across utility classes. Vendor competition centers on integrating analytics and two-way communications while maintaining a favorable total cost of ownership. Expanding financing options, such as pay-as-you-save models, and performance-based regulation that rewards verified water-loss reduction, further strengthen demand pipelines in developed and emerging economies.
Key Report Takeaways
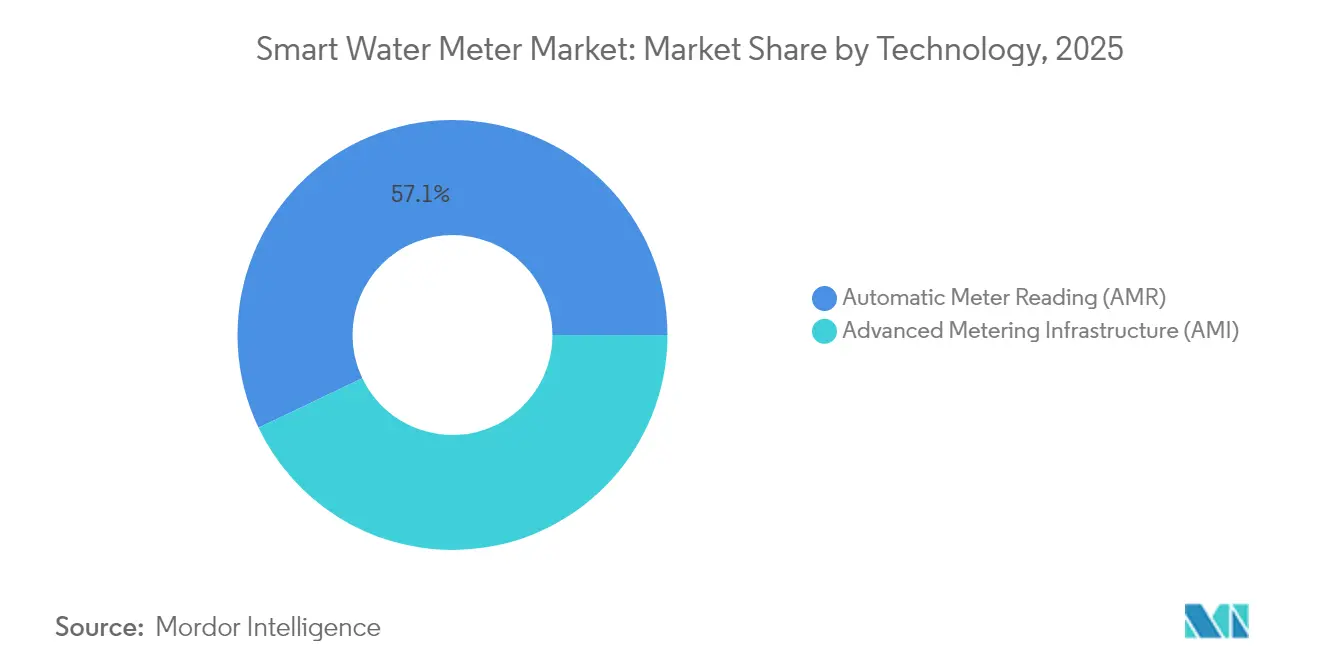
- By technology, Automatic Meter Reading captured 57.10% of the Smart Water Meter market share in 2025, while Advanced Metering Infrastructure is forecast to expand at an 11.55% CAGR through 2031.
- By application, residential deployments held 58.00% of the Smart Water Meter market size in 2025; commercial deployments are advancing at a 11.85% CAGR to 2031.
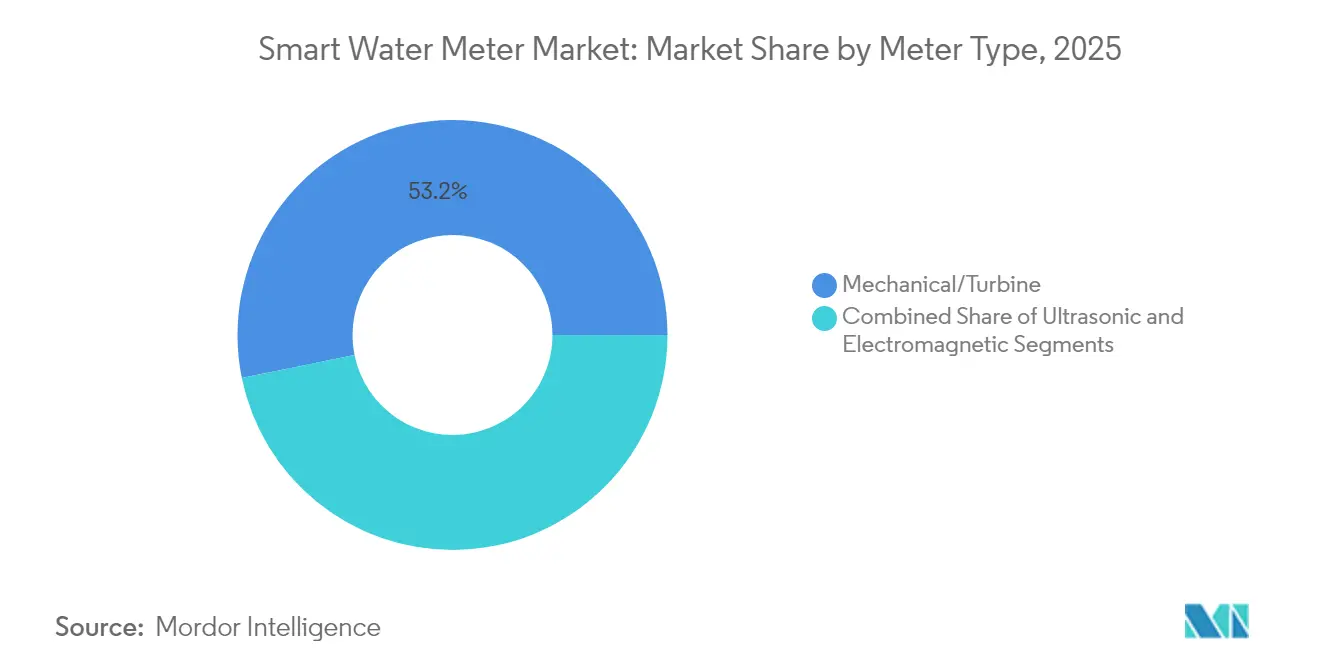
- By meter type, mechanical and turbine units accounted for 53.20% of the Smart Water Meter market share in 2025, yet ultrasonic meters are growing at a 11.95% CAGR over the same period.
- By communication technology, proprietary RF systems led with 48.50% revenue share of the Smart Water Meter market in 2025, while cellular protocols record the highest projected CAGR at 12.15% through 2031.
- By component, hardware represented 60.10% of the Smart Water Meter market size in 2025, whereas the software and analytics segments register a 11.60% CAGR to 2031.
- By deployment, retrofit programs held a 63.40% share of the Smart Water Meter market in 2025; new installations are set to increase at an 11.35% CAGR to 2031.
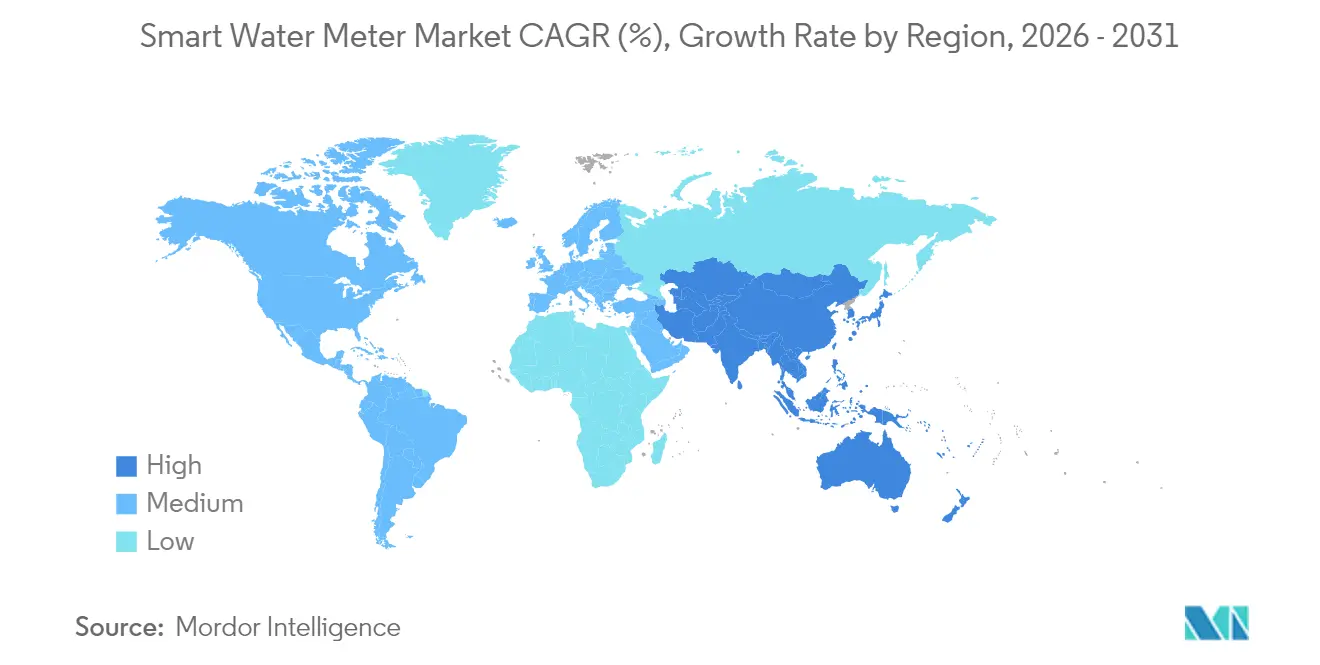
- By geography, Europe commanded 36.10% revenue share of the Smart Water Meter market in 2025; Asia-Pacific is the fastest-growing region at a 12.05% CAGR through 2031.
Note: Market size and forecast figures in this report are generated using Mordor Intelligence’s proprietary estimation framework, updated with the latest available data and insights as of 2026.
Market Trends and Insights
Drivers Impact Analysis of Smart Water Meter Market*
| Driver | (~) % Impact on CAGR Forecast | Geographic Relevance | Impact Timeline |
|---|---|---|---|
| Supportive government regulations | +2.8% | Global, with strongest influence in Europe and North America | Medium term (2-4 years) |
| Need to improve water-use efficiency | +2.4% | Global, with acute impact in water-stressed regions like MENA and Australia | Long term (≥ 4 years) |
| Reducing non-revenue water (NRW) losses | +2.1% | Global, with highest impact in developing markets across Asia-Pacific and Latin America | Medium term (2-4 years) |
| Smart-city and IoT platform integration | +1.9% | APAC core markets, spill-over to Europe and North America | Long term (≥ 4 years) |
| Pay-as-you-save financing models | +1.2% | North America and Europe, expanding to emerging markets | Short term (≤ 2 years) |
| Drought-driven conservation mandates | +1.6% | Regional focus on California, Australia, South Africa, and Mediterranean Europe | Short term (≤ 2 years) |
| Source: Mordor Intelligence | |||
Supportive Government Regulations
Mandatory deployment timelines and water-efficiency standards push utilities toward advanced metering solutions that satisfy compliance and reporting needs. The EU Drinking Water Directive requires end-to-end monitoring, prompting Germany and France to stipulate smart meters in all new constructions and major renovations. [1] California’s permanent water-use rules demand granular data for enforcement, making AMI rollouts a prerequisite for funding eligibility. [2] Utilities gain cost recovery mechanisms when they document water-loss cuts and customer engagement improvements, which lowers investment risk and supports full-territory deployments. Vendors benefit from volume orders that reduce per-unit costs, while policymakers secure transparent performance metrics to track conservation progress. Across municipal, regional, and national levels, regulation underwrites the long-term certainty needed for widespread Smart Water Meter market adoption.
Need to Improve Water-Use Efficiency
Utilities in water-scarce regions adopt connected meters to identify high-consumption patterns and empower customers with hourly data that supports behavioral changes. Industrial facilities using continuous telemetry report 20–30% consumption cuts after pinpointing leaks and optimizing processes. [3] Agricultural pilots that combine soil-moisture sensing with weather-based scheduling record up to 28% savings, demonstrating cross-sector utility. Efficiency gains also yield energy savings because water production and pumping constitute large operational expenses. Analytics applications forecast demand, allowing utilities to flatten peaks and defer capacity expansion. As utilities tie conservation to revenue decoupling, efficiency gains translate into stable financial performance and propel the Smart Water Meter market forward.
Reducing Non-Revenue Water Losses
Smart meters feed distribution-network models that balance inflows and billed volumes, exposing hidden leaks, theft, and meter tampering. Yorkshire Water’s LoRaWAN deployment covering 1.3 million endpoints posted measurable drops in real-loss volumes and boosted customer experience. Predictive algorithms flag anomalies, enabling utilities to reduce non-revenue water by 10–15% through rapid leak response. Cost reductions extend to lower treatment volumes and energy use, improving the economic case for large-scale rollouts. Data integration with GIS and mobile workforce software helps prioritize repairs by financial impact, streamlining crew assignments, and shortening outage windows. Performance improvements feed into regulatory scorecards, reinforcing the business case for the Smart Water Meter market.
Smart-City and IoT Platform Integration
Urban digitization programs in China, Singapore, and Western Europe are embedding water metering within broader IoT architectures that also oversee energy, traffic, and environment. Low-power wide-area protocols such as NB-IoT and LoRaWAN support battery-operated meters, delivering near-real-time data without costly site power. Edge computing at the endpoint enables local decision-making, including automated shut-off when catastrophic leaks occur. Customer portals merge water and energy dashboards, improving transparency and bill accuracy. Open-standard architectures limit vendor lock-in and encourage scalable, interoperable networks. As smart-city funding pools grow, water utilities gain access to new capital sources, further expanding the Smart Water Meter market.
Restraints Impact Analysis of Smart Water Meter Market*
| Restraint | (~) % Impact on CAGR Forecast | Geographic Relevance | Impact Timeline |
|---|---|---|---|
| High upfront costs and cybersecurity risks | -1.8% | Global, with acute impact in developing markets and small utilities | Short term (≤ 2 years) |
| Systems-integration complexity | -1.4% | North America and Europe, where legacy infrastructure is prevalent | Medium term (2-4 years) |
| Shortage of utility data-analytics talent | -0.9% | Global, with particular challenges in rural and developing regions | Long term (≥ 4 years) |
| Battery-life limits in ultrasonic units | -0.7% | Regional impact in extreme climate zones and remote deployment areas | Medium term (2-4 years) |
| Source: Mordor Intelligence | |||
High Upfront Costs and Cybersecurity Risks
Full AMI rollouts cost USD 200–400 per endpoint, challenging utilities with tight capital budgets. Rate-case approvals can stretch over several years, delaying project start dates. Cybersecurity countermeasures, encryption, intrusion detection, and 24-hour monitoring raise the total project expense by an additional 15–25%. [4] Smaller systems, especially in developing economies, often defer investments without concessional finance. High-profile cyber incidents intensify regulatory scrutiny, further elevating compliance costs. These factors collectively weigh on Smart Water Meter market growth until financing mechanisms mature and security frameworks standardize.
Systems-Integration Complexity
Legacy billing and customer information platforms frequently lack the interfaces needed to ingest 15-minute interval data. Utilities report 20–40% budget overruns when middleware upgrades and workforce training are underestimated. Inconsistent communication standards add interoperability headaches, forcing utilities to lock into single-vendor ecosystems or fund costly custom development. Change-management burdens slow deployment velocity and temporarily distract operational staff from core service delivery, constraining Smart Water Meter market momentum in mature regions.
*Our forecasts treat driver/restraint impacts as directional, not additive. The impact forecasts reflect baseline growth, mix effects, and variable interactions.
Smart Water Meter Market Segment Analysis
By Technology:
AMI Gains Ground Despite AMR DominanceAutomatic Meter Reading systems accounted for 57.10% of Smart Water Meter market share in 2025, reflecting their entrenched base and cost-efficient one-way data transmission. Many utilities adopt AMR during early modernization phases because drive-by collection sharply reduces manual labor without extensive network build-out. The Smart Water Meter market size attached to AMR remains large, yet its growth moderates as second-generation rollouts favor two-way architectures.
Advanced Metering Infrastructure records an 11.55% CAGR to 2031 as utilities seek real-time leak alerts, remote disconnect, and time-variant pricing schemes. Cellular, NB-IoT, and LoRaWAN modules drop in cost, erasing a key barrier to AMI adoption. Service providers package meters, analytics, and software subscriptions, distributing capital costs over operating budgets. Data-rich AMI platforms integrate easily with conservation programs, accelerating regional penetration and widening the Smart Water Meter market.

By Application:
Commercial Sector Drives InnovationResidential deployments formed 58.00% of the Smart Water Meter market size in 2025 after multiple European and North American mandates required smart meters for new housing. Consumers benefit from usage portals that connect conservation goals to tangible savings, sustaining stable replacement cycles.
Commercial buildings show the fastest uptake at a 11.85% CAGR, propelled by facility-management software that pairs water, energy, and HVAC data. Public-sector users, which include municipal utilities and government facilities, held 41.83% of smart water management market size in 2025 by virtue of capital access and policy mandates. High-rise real-estate owners justify investment through lower operating expenses and green-building certifications. Retail chains and hospitality groups apply analytics to benchmark sites, uncover concealed leaks, and optimize irrigation. As sustainability reporting frameworks tighten, enterprise users expand deployments, bolstering overall Smart Water Meter market growth.
By Meter Type:
Ultrasonic Technology Gains MomentumMechanical and turbine devices held 53.20% Smart Water Meter market share in 2025, owing to mature supply chains and lower acquisition prices. Utilities value their familiarity and proven durability in broad service environments.
Ultrasonic meters are projected to grow 11.95% per year as accuracy at low flow rates improves billing fidelity and customer trust. With no moving parts, ultrasonic models reduce maintenance truck rolls and extend service life, important factors in remote networks. Enhanced battery chemistry mitigates earlier life-span concerns, making the technology more viable for mass deployment. These benefits expand addressable opportunity and contribute to Smart Water Meter market advancement.
By Communication Technology:
Cellular Protocols Lead GrowthProprietary radio networks retained a 48.50% revenue share in 2025 because many AMR systems employ fixed or drive-by RF. Utilities appreciate predictable performance and long-range capabilities in rural settings.
Cellular NB-IoT and LTE-M solutions post a 12.15% CAGR due to global coverage, managed security layers, and standards-based hardware. Operators offer utility-focused data plans that lower lifetime connectivity costs. Over-the-air firmware updates and robust encryption simplify operations and harden security posture, pushing utilities to favor cellular in fresh bids. LoRaWAN continues to gain ground in low-density regions that lack reliable cellular footprints, ensuring multiple paths for Smart Water Meter market expansion.
By Component:
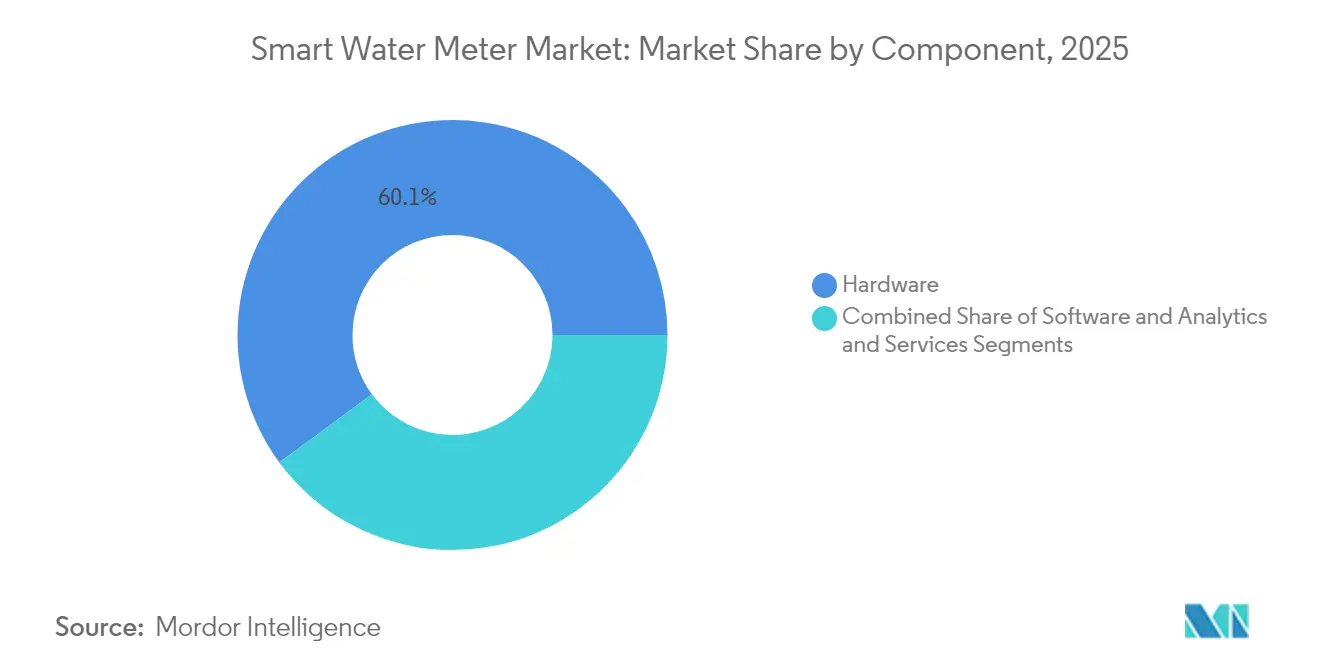
Software Analytics Drive Value CreationHardware still represents 60.10% of the Smart Water Meter market size, covering meters, antennas, and installation kits. Tight supply chains and ongoing replacement programs sustain stable shipment volumes.
Software and analytics climb at a 11.60% CAGR to 2031 as utilities monetize data through leak alarms, personalized alerts, and predictive maintenance. Subscription-based dashboards generate recurring revenues that offset initial capital outlays. Artificial-intelligence algorithms surfacing within cloud platforms now flag anomalous consumption and recommend proactive asset interventions, positioning analytics as the critical differentiator in vendor portfolios and spurring Smart Water Meter market momentum.
By Deployment:
New Installations AccelerateRetrofit projects accounted for 63.40% of the Smart Water Meter market in 2025, driven by mandated replacements of aging mechanical infrastructure across OECD countries. Upgrade programs often bundle meters with ancillary pressure and quality sensors for holistic asset insights.
New installations grow at 11.35% annually as greenfield developments in Asia-Pacific and the Middle East specify smart infrastructure from day one. Developers capitalize on bundled energy-water packages to meet sustainability codes and enhance property values. In Latin America, concession models fund complete network rollouts, bypassing legacy systems entirely. These dynamics broaden the Smart Water Meter market scope beyond replacement cycles.
Geography Analysis
Europe Smart Water Meter Market
Europe dominated the Smart Water Meter market with 36.10% revenue share in 2025, anchored by EU directives that compel water-loss tracking and transparent billing. National implementation roadmaps guarantee steady tender pipelines, and long-term vendor frameworks streamline procurement. Utilities also tap recovery funds targeting climate resilience, accelerating district-wide AMI deployments that underpin stable regional demand.
APAC Smart Water Meter Market
Asia-Pacific registers the fastest expansion, clocking a 12.05% CAGR to 2031. China’s extensive smart-city pilots embed metering within neighborhood digital twins, while India’s Jal Jeevan Mission finances rural connections that include smart endpoints. Southeast Asian economies such as Indonesia and Vietnam upgrade legacy assets concurrently with rapid urbanization, avoiding sunk costs tied to older technologies. Government grants, multilateral loans, and public-private partnerships combine to scale installations and enlarge the Smart Water Meter market.
North America, LATAM and MEA Smart Water Meter Market
North America benefits from aging infrastructure replacement and statewide conservation mandates. California utilities deploy AMI to enforce per-capita usage limits and to support wildfire resilience through remote shut-off capabilities. Canada advances province-level modernization programs focusing on non-revenue water recovery, adding incremental growth. Latin America’s concession tenders in Brazil signal sizable upcoming opportunities, while Middle East and Africa utilities leverage smart meters to address scarcity and reduce theft, though deployment progress varies by funding availability and communication-network readiness.
Regulatory Landscape
Regulation for smart water metering continues to broaden from classic legal metrology (accuracy and verification) into cybersecurity, consumer transparency, and device interoperability. In Europe, work around the Measuring Instruments Directive (MID 2014/32/EU) is being updated through EU Directive 2026/706, while WELMEC Guide 13.1 (Version 2025) provides harmonized guidance for MID application and aligns utility meter practice with OIML R 49:2024 and ISO 4064:2024, tightening conformity expectations for smart-enabled meters used for billing.
Outside Europe, state and national actions are adding smart-meter specific requirements that shape procurement specifications. In the United States, Vermont Senate Bill S.0213 (2026) sets cybersecurity requirements for public water systems using smart meters, with a compliance deadline anchored to July 1, 2027, and Maryland House Bill 220 (signed in 2026) regulates individual unit submeters, including leak detection monitoring and state-defined accuracy and testing provisions. At the standards level, the DLMS UA Water Smart Meter Global Companion Profile (WSM GCP) release (February 2026) and China standard T/SMA 0082-2025 (effective January 15, 2026) reflect more prescriptive technical and operational requirements for smart water meter selection, operation, and maintenance across larger meter size ranges.
Value Chain Analysis
The smart water meter value chain spans meter and sensor component suppliers (measurement elements, batteries, enclosures, radio modules), water meter OEMs, connectivity and network providers (proprietary RF, LoRaWAN/LPWAN, and cellular NB-IoT/LTE-M), headend and meter data management software providers, analytics and applications (leak detection, customer portals, NRW management), and system integrators and installation contractors that execute deployments and connect telemetry to utility CIS, GIS, and SCADA environments. Procurement is increasingly organized around multi-party ecosystems where OEMs, network operators, and software platforms deliver an end-to-end AMI stack, shifting differentiation toward interoperability, cybersecurity controls, remote firmware management, and analytics performance.
Delivery models are also moving from product sales toward service-led contracting, including Network-as-a-Service and Metering-as-a-Service constructs that convert CAPEX-heavy rollouts into OPEX programs for utilities. This is visible in large AMI network selections such as Netmore Group being chosen for Yorkshire Water to exchange 1.3 million meters under a LoRaWAN-based deployment (September 2024) and Severn Trent selecting Netmore to deploy and manage AMI network services for 1 million smart meters using dual LoRaWAN and NB-IoT (September 2025). Connectivity partnerships are expanding alongside these rollouts, including SUEZ signing a global partnership with Vodafone to accelerate NB-IoT remote reading of new-generation smart water meters with a stated target of 2 million meters by 2030 (April 2024), reinforcing the role of telecom operators and managed connectivity in de-risking large-scale deployments.
Competitive Landscape
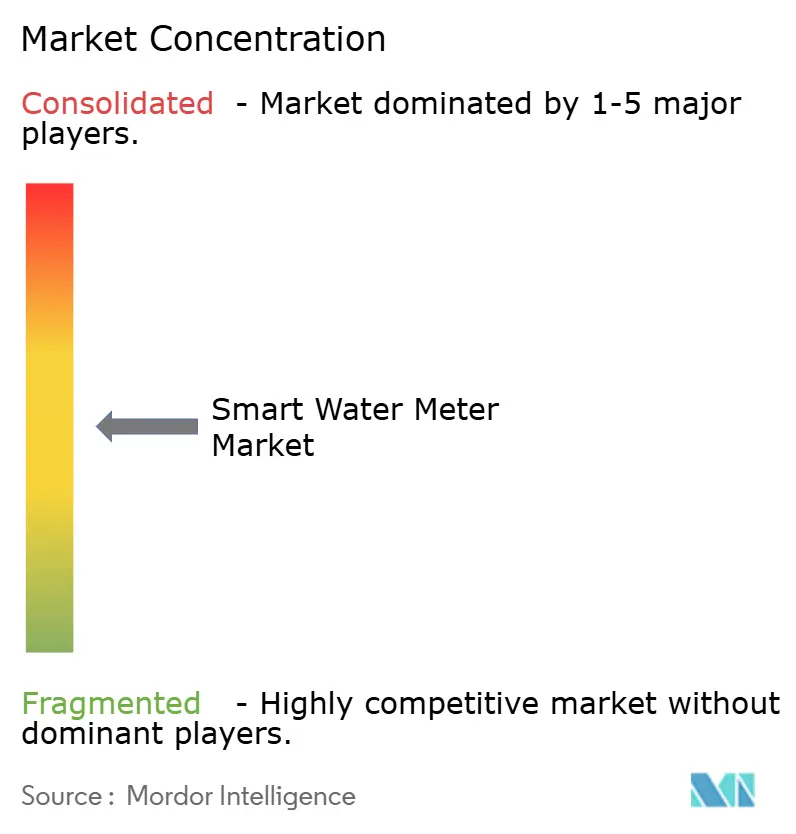
The Smart Water Meter market remains moderately fragmented, with leading firms such as Itron, Badger Meter, and Xylem-Sensus vying alongside regional manufacturers and IoT specialists. Top players deliver complete stacks of hardware, communications, and cloud analytics that reduce integration risk for utilities. Recent consolidation illustrates a pivot toward data-centric offerings: Badger Meter’s USD 185 million SmartCover buy injected advanced leak-detection software into its portfolio, while Xylem folded Idrica’s analytics platform into Sensus to deepen predictive insights.
Competitive focus now lies in artificial-intelligence algorithms that convert meter telemetry into actionable maintenance and customer engagement outputs. Companies highlight time-to-value metrics, showcasing pilot projects where utilities recovered double-digit non-revenue water percentages or shaved peak-hour treatment energy. Component miniaturization and battery innovations serve as additional differentiators, especially in remote deployments without easy service access.
Regional entrants carve niches by customizing low-cost ultrasonic units or localized cloud dashboards to specific tariff structures. Interoperability certifications gain importance as utilities insist on open standards to avoid vendor lock-in. Market positioning also hinges on financing support; vendors offering pay-as-you-save or outcome-based contracts penetrate small-to-mid-size utilities that previously lacked capital for full AMI rollouts. These competitive dynamics continue to broaden the overall Smart Water Meter market.
Smart Water Meter Industry Leaders
-
Arad Ltd.
-
Badger Meter Inc.
-
Itron Inc.
-
Sensus USA Inc. (Xylem Inc.)
-
Kamstrup A/S
- *Disclaimer: Major Players sorted in no particular order
Smart Water Meter Market Companies Covered in this Report
- Arad Ltd.
- Badger Meter Inc.
- Itron Inc.
- Sensus USA Inc. (Xylem Inc.)
- Kamstrup A/S
- Diehl Stiftung and Co. KG
- Zenner International GmbH and Co. KG
- Landis+Gyr Group AG
- Honeywell International Inc.
- Neptune Technology Group Inc. (Roper)
- Aclara Technologies LLC (Hubbell)
- Apator SA
- Axioma Metering
- B Meters Srl
- Datamatic Inc.
- Maddalena S.p.A.
- Suntront Tech Co., Ltd.
- Mueller Systems LLC
- Waviot
- Watertech S.p.A. (Arad)
- Jiangxi Sanchuan Water Meter Co. Ltd.
- Ningbo Water Meter Co. Ltd.
- BETAR Company
- Integra Metering AG
- IESLab Electronic Co. Ltd.
Market Opportunities and Future Outlook
Opportunities are emerging as utilities and public buyers bundle meters, communications networks, and headend platforms into multi-year frameworks, which accelerates adoption and raises requirements for delivery capability and interoperability. In the United Kingdom, Scottish Water awarded a GBP 50 million framework (May 2026) to Elster Water Metering (Honeywell) covering smart water meters, headend systems, and communications networks for a rollout aimed at 135,000 non-household customers, highlighting whitespace for vendors that can package hardware, connectivity, and data platforms into a single procurement-ready offer. In France, Pays de Montbeliard Agglomeration and SEPM (Veolia) launched a three-year AMI rollout covering 48,740 smart meters across 62 communes (July 2026), pointing to municipal-scale demand for multi-commune standardization and centralized operations.
A second opportunity area is compliance-driven modernization that raises secure-by-design expectations and strengthens demand for certified, standards-aligned devices and platforms. Australia moved to AS4747:2025 as the operative requirement for non-urban water supply meters in 2026, which shapes demand for validated installation practices and defensible meter data in telemetry contexts, while U.S. state actions such as Vermont S.0213 (2026) embed cybersecurity controls into the adoption pathway for smart meters in public water systems. Beyond regulation, implementation momentum in mature and new markets is supported by contract structures and program delivery capacity, including Ameresco executing AMI contracts for Baytown and Shenandoah, Texas (June 2026) for solid-state AMI replacements and retrofits, showing room for integrators and service providers that can deliver turnkey deployments and ongoing operational support.
Recent Industry Developments in Smart Water Meter Market
- June 2026: Itron collaborated with Watercare Services in New Zealand to upgrade mechanical meters with 100,000 Itron Intelis wSource digital water meters. The program anchors a large-scale shift toward solid-state, digitally enabled metering and provides a reference deployment for utilities evaluating accelerated replacement of legacy assets with modern endpoints and supporting systems.
- May 2026: Xylem announced completion of the sale of Sensus International, its water and heat metering operations outside North America, to AURELIUS. The divestiture reshapes competitive coverage and channel strategy for Sensus-branded metering in multiple regions, while Xylem concentrates its metering footprint and resource allocation more heavily on North America and adjacent digital water offerings.
- November 2024: Itron upgraded 25,000 meters in Tennessee to ultrasonic smart devices. The project reinforced the operational case for smart metering through improved billing accuracy and utility revenue protection, and it added to the installed base that supports ongoing software, analytics, and services pull-through.
Smart Water Meter Market Report Scope and Research Methodology
Market Definition and Coverage
For this study, the smart water meter market covers revenue earned from connected water meters and the related systems needed to read, transmit, and manage usage data for billing, monitoring, and leak detection across end users.
Scope exclusions: The sizing excludes broader smart city software that is not tied to metering, and it also excludes general pipe networks, pumps, and water treatment equipment.
Segments Covered in This Report
- By Technology
- Automatic Meter Reading (AMR)
- Advanced Metering Infrastructure (AMI)
- By Application
- Residential
- Commercial
- Industrial
- Agricultural
- By Meter Type
- Mechanical / Turbine
- Ultrasonic
- Electromagnetic
- By Communication Technology
- Radio-frequency (Proprietary RF)
- LoRaWAN / Other LPWAN
- Cellular (NB-IoT/LTE-M)
- Wired (M-Bus/Ethernet)
- By Component
- Hardware
- Software and Analytics
- Services
- By Deployment
- New Installations
- Retrofit / Replacement
- By Geography
- North America
- United States
- Canada
- Mexico
- South America
- Brazil
- Argentina
- Chile
- Rest of South America
- Europe
- Germany
- United Kingdom
- France
- Italy
- Spain
- Rest of Europe
- Asia-Pacific
- China
- India
- Japan
- South Korea
- Malaysia
- Singapore
- Australia
- Rest of Asia-Pacific
- Middle East and Africa
- Middle East
- United Arab Emirates
- Saudi Arabia
- Turkey
- Rest of Middle East
- Africa
- South Africa
- Nigeria
- Rest of Africa
- Middle East
- North America
Data Sources, Market Sizing, and Validation
Desk Research
Desk work started with public information on how much water is being supplied, where losses occur, and what utilities are upgrading. We referred to sources such as the US EPA, USGS water-use datasets, World Bank water indicators, UN Water and WHO/UNICEF JMP materials, and ISO or IEC references that clarify metering and communications basics.
To translate these context signals into a workable market model, we also reviewed company annual reports, investor decks, tender portals, utility project releases, and reputed press coverage of metering rollouts. In a few cases, paid subscriptions were used only to standardize company financials, check patent activity around metering communications, and cross-check shipment and trade patterns where public customs summaries were not detailed enough. These desk sources are illustrative, and many other public references were used during data collection, validation, and clarification.
Primary Interviews and Surveys
Primary discussions were completed with utility procurement and metering teams, system integrators, and product leaders from meter and communications suppliers, since each group views pricing and adoption through a different lens. We used these inputs to confirm rollout timing, typical meter replacement cycles, AMI versus AMR preferences, and how software and services get bundled, then we checked the assumptions across major regions to limit the influence of any single geography.
Table heading is the distribution of the primary research fieldwork respondents.
Distribution of primary research fieldwork respondents
| Company type | Respondent position | Region |
|---|---|---|
| Top tier: 26% | CXOs: 19% | APAC: 49% |
| Mid tier: 55% | Functional/Unit leaders: 35% | EMEA: 29% |
| Smaller Players: 19% | Managers: 46% | Americas: 22% |
Market-Sizing & Forecasting
Market sizing is built using top-down and bottom-up logic. The top-down side is anchored in the addressable utility metering base and the pace of smart upgrade activity by region. In practice, adoption rates are applied to the installed meter population and planned replacements, and then the value is reconstructed using typical meter ASPs plus attach rates for communications modules, software, and services.
To make the model behave like the real market, inputs are adjusted using field feedback on the AMI versus AMR mix, the share of retrofit versus new installation projects, utility capex cycles, and pricing movement by meter type and communication choice (for example, cellular versus RF mesh). Where a clean volume input is not available for a country, we use proxy indicators such as non-revenue water focus, tender frequency, and urban utility coverage, and then we narrow the range using supplier channel checks. For forecasting, scenario analysis is used around replacement cadence and funding intensity, and the trend lines are smoothed using recent shipment and project timing patterns validated by interviews.
Data Validation & Update Cycle
Outputs are validated by comparing the modeled totals with independent signals such as utility deployment announcements, tender award values, and supplier revenue exposure to metering and related services. If a region shows an unusual jump, the assumptions are re-checked, the arithmetic is reviewed, and follow-up calls are triggered to confirm whether a one-time project or a pricing change is driving the variance.
Before sign-off, the work is reviewed in steps so definitions, unit economics, and adoption rates stay consistent across chapters. The report is refreshed each year, and interim updates are added when major policy changes, large utility programs, or supply constraints materially affect demand. Right before delivery, we do a final scan so the numbers reflect the latest available public releases and validated expert inputs.
Mordor Intelligence's Smart Water Meter Market Size Compared Against Other Published Estimates
Published market sizes for smart water meters often vary because the boundary of what is counted can shift, and that changes the total quickly. Differences usually come from whether software and services are included, how retrofit programs are treated, and which years and exchange rates are used.
By tracking meter shipment signals, refresh timing of utility rollout pipelines, and service attach rates, Mordor Intelligence keeps the 2026 value tied to actual deployment cadence, while some estimates lean more on broader IoT infrastructure spend or longer-dated forecast assumptions.
Benchmark comparison
| Source | Market Size | Gaps in Research Methodology |
|---|---|---|
| Mordor Intelligence | USD 5.32 B (2026) | |
| Global Consultancy A | USD 9.94 B (2025) | Uses a different base year and tends to include a wider revenue perimeter that can fold in broader smart utility platforms and adjacent digital infrastructure, which lifts the starting value versus a meter-led demand pool. |
| Industry Publisher B | USD 5.38 B (2025) | Shows a similar starting level but applies different timing on when projects are recognized, and it may assume a faster ASP progression across deployments without separating retrofit-heavy tenders from new-build programs. |
The spread in the table is mostly explained by scope and timing choices rather than arithmetic errors. When the counted revenue is limited to metering-led hardware, software, and services that are actually deployed, and when upgrade cadence is checked against utility plans, the final number becomes easier to trace and repeat year after year.
Key Questions Answered in the Report
How large is the Smart Water Meter market in 2026?
The Smart Water Meter market size stands at USD 5.32 billion in 2026 with a 10.55% growth trajectory to 2031.
Which region grows fastest in smart water metering?
Asia-Pacific leads growth at a 12.05% CAGR thanks to smart-city investments in China and rural expansion programs in India.
What technology segment is expanding most rapidly?
Advanced Metering Infrastructure posts the highest growth, rising at 11.55% per year as utilities seek two-way communications.
Why are utilities adopting ultrasonic meters?
Ultrasonic units provide higher low-flow accuracy and lower maintenance, enabling utilities to improve billing precision and cut service costs.
What is a key barrier to wider deployment?
Up-front capital and added cybersecurity expenses pose the biggest challenges, especially for small or resource-constrained utilities.