Market Overview
| Study Period | 2020 - 2031 |
|---|---|
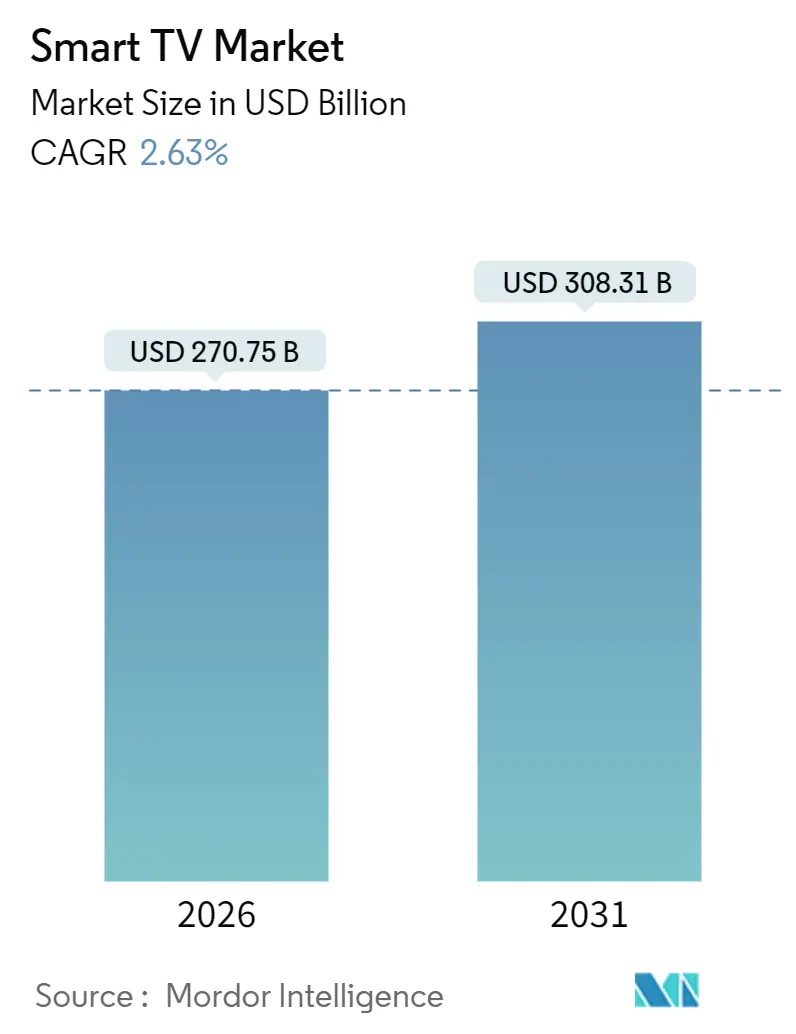
| Market Size (2026) | USD 270.75 Billion |
| Market Size (2031) | USD 308.31 Billion |
| Growth Rate (2026 - 2031) | 2.63% CAGR |
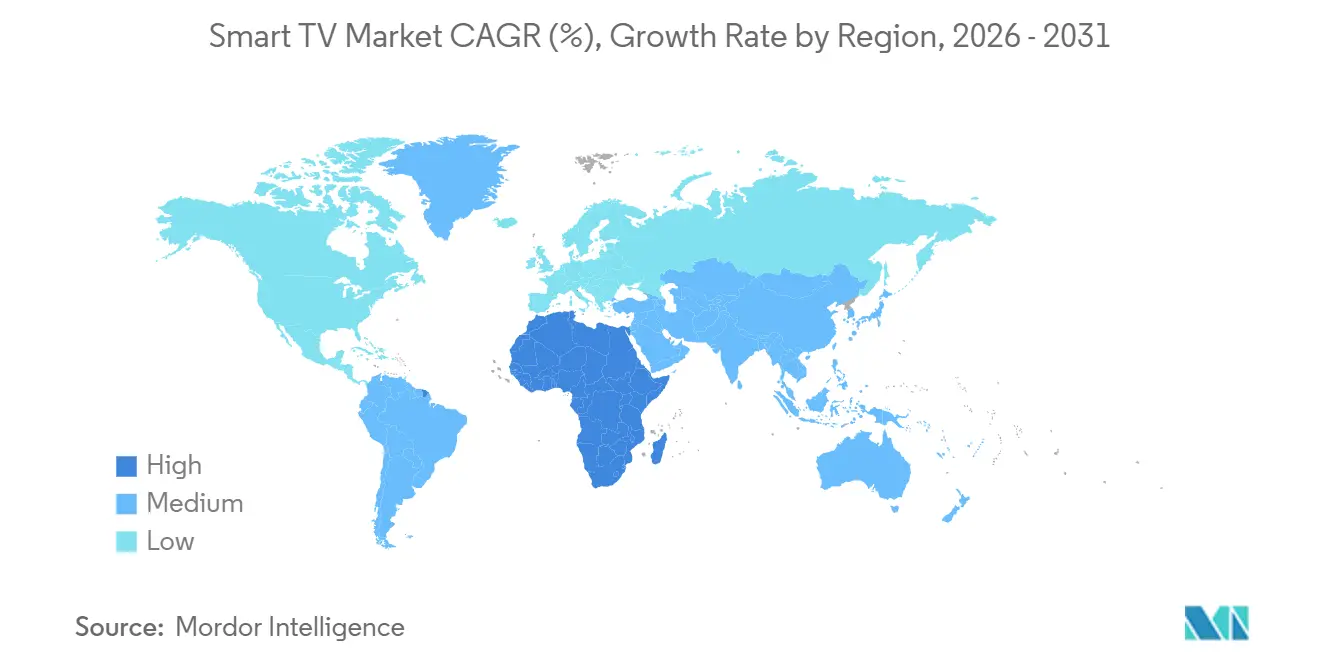
| Fastest Growing Market | Africa |
| Largest Market | Asia Pacific |
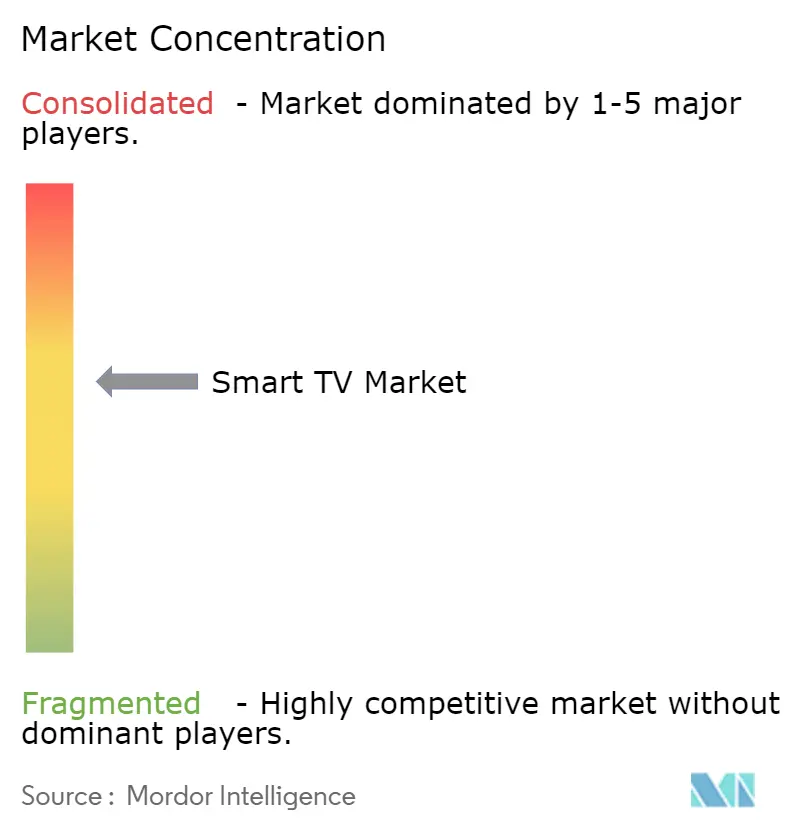
| Market Concentration | Medium |
Major Players*Disclaimer: Major Players sorted in no particular order Image © Mordor Intelligence. Reuse requires attribution under CC BY 4.0. | |
Smart TV Market Analysis by Mordor Intelligence
The smart TV market size stands at USD 270.75 billion in 2026 and is projected to reach USD 308.31 billion by 2031, reflecting a 2.63% CAGR over the period. Sustained fiber-to-the-home roll-outs, price erosion in 55- to 65-inch 4K sets, and the uptake of ad-supported FAST channels are expanding the installed base even as average selling prices decline. Partnerships with Xbox Cloud Gaming and NVIDIA GeForce NOW are normalizing 120 Hz refresh rates in mid-tier models, while Mini-LED backlights narrow the performance gap with OLED and spur premium upgrades. Asia Pacific keeps its lead through China’s vertically integrated panel ecosystem and India’s production-linked incentives, whereas Africa delivers the fastest growth as mobile-money financing unlocks first-time buyers. In North America and Europe, low-cost streaming dongles prolong replacement cycles, yet demand for 65-inch-plus OLED and Mini-LED units mitigates volume softness.
Key Report Takeaways
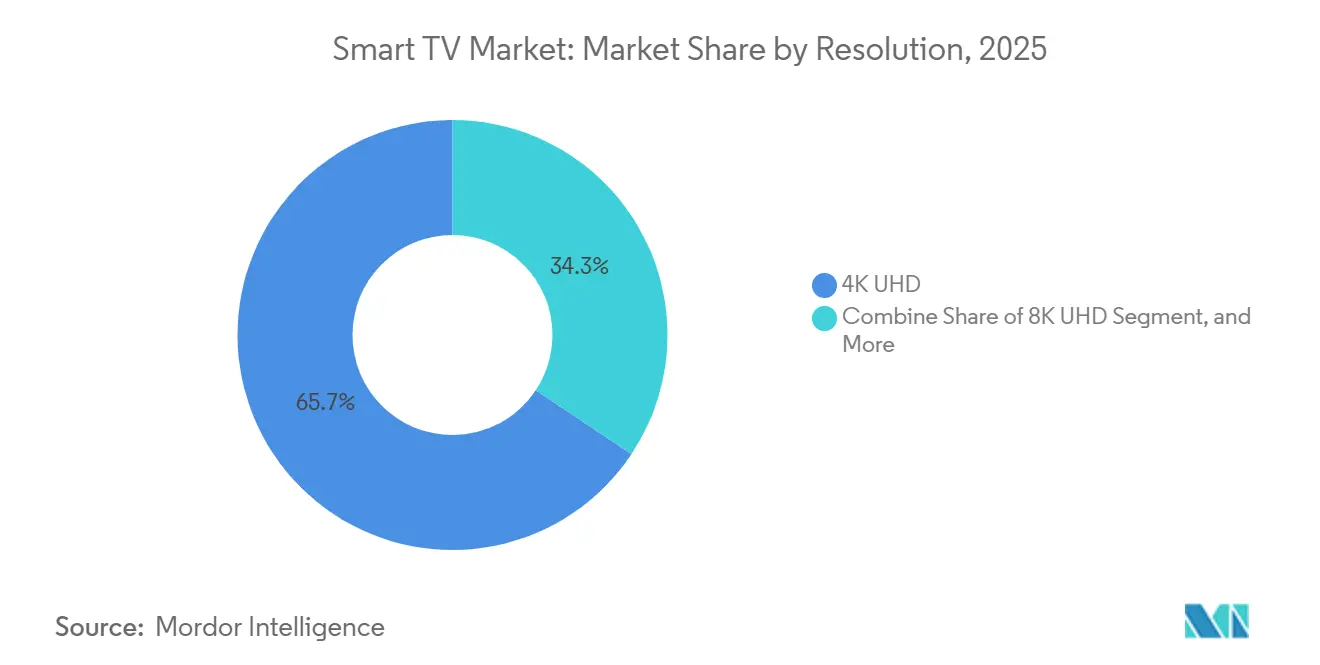
- By resolution, 4K UHD led with 65.66% revenue share in 2025, while 8K UHD is forecast to expand at a 4.56% CAGR to 2031.
- By screen size, the 46–55 inch bracket captured 36.78% of 2025 revenue, whereas sets above 65 inches are advancing at a 2.92% CAGR through 2031.
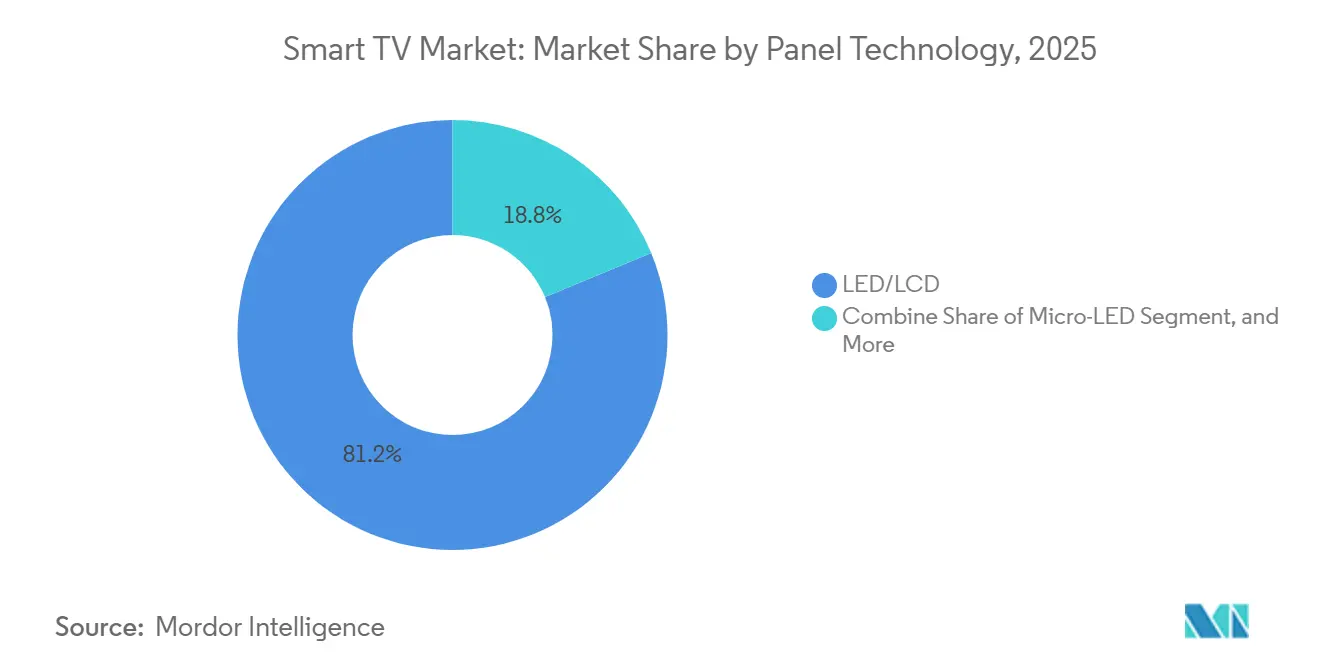
- By panel technology, LED/LCD retained 81.22% share in 2025, and Mini-LED is the fastest-growing at 3.22% CAGR.
- By screen shape, flat panels held 94.24% share in 2025 and continue to rise at a 4.16% CAGR.
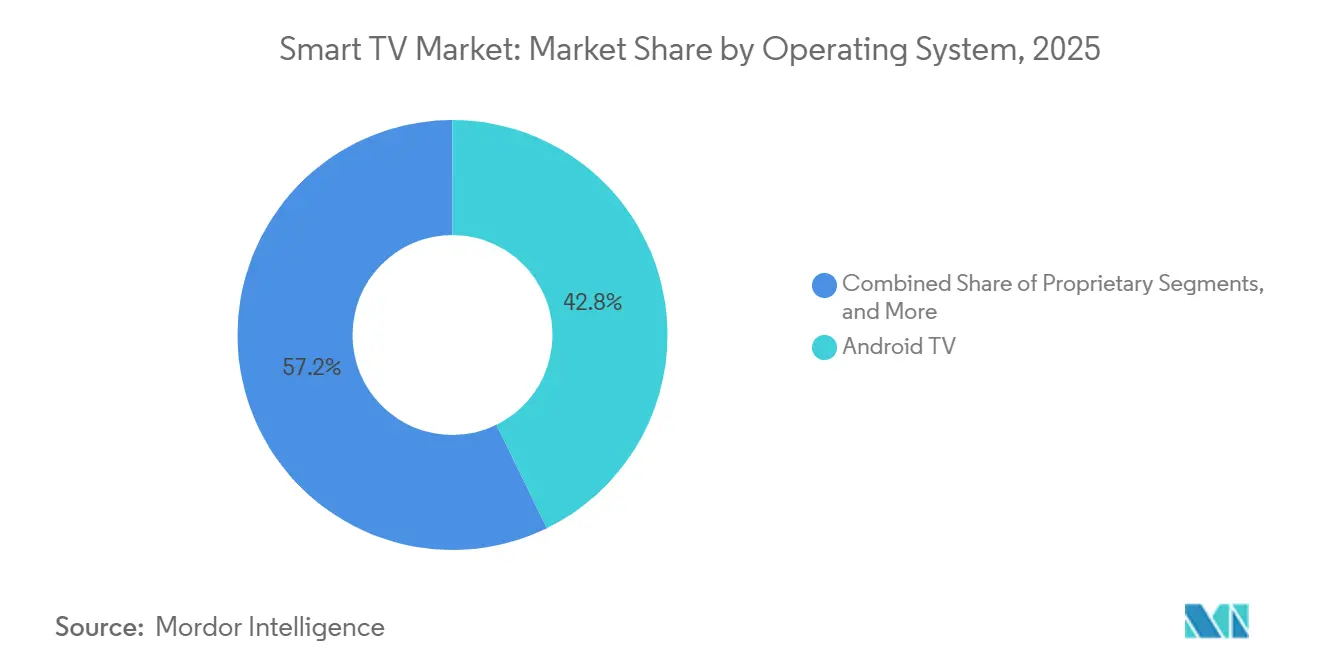
- By operating system, Android TV commanded 42.76% share in 2025, while proprietary Tizen and webOS platforms are expanding at 4.89% CAGR.
- By distribution channel, offline retail delivered 58.88% of 2025 sales, yet online platforms are outpacing at a 3.56% CAGR to 2031.
- By geography, Asia Pacific contributed 47.32% of 2025 revenue, whereas Africa is the fastest-growing region at 3.12% CAGR.
Note: Market size and forecast figures in this report are generated using Mordor Intelligence’s proprietary estimation framework, updated with the latest available data and insights as of January 2026.
Global Smart TV Market Trends and Insights
Drivers Impact Analysis*
| Driver | (~) % Impact on CAGR Forecast | Geographic Relevance | Impact Timeline |
|---|---|---|---|
| Price erosion of 55–65 inch 4K sets | +0.6% | Global, acute in Asia Pacific and South America | Short term (≤ 2 years) |
| Telecom-led fiber roll-outs | +0.5% | Europe, North America, urban Asia Pacific corridors | Medium term (2–4 years) |
| Integration of FAST channels | +0.4% | North America and Europe, expanding to Latin America | Medium term (2–4 years) |
| Cloud-gaming partnerships driving 120 Hz TVs | +0.3% | North America, Europe, and Japan | Medium term (2–4 years) |
| Government localization incentives in India | +0.3% | India, with spillover to Southeast Asia | Long term (≥ 4 years) |
| Matter-certified interoperability | +0.2% | Global, led by North America and Europe early adopters | Long term (≥ 4 years) |
| Source: Mordor Intelligence | |||
Price Erosion of 55–65 inch 4K Sets
Gen 10.5 and Gen 11 Chinese fabs drove 55-inch 4K LCD panel prices below USD 100 in Q2 2025, letting retailers price finished sets under USD 300 in India and Brazil. First-time buyers in tier-2 cities now cross the USD 5,000 household-income threshold and opt for entry-level smart TVs instead of smaller mobile screens. TCL and Hisense, backed by captive CSOT and BOE capacity, protect margins despite falling ASPs, whereas Samsung and LG steer shoppers toward OLED and Mini-LED lines to hold operating margins above 8%.[1]Samsung Electronics, “Q4 2025 Earnings Call Transcript,” samsung.com Unit growth clusters in 46- to 55-inch models, yet revenue gains migrate to 65-inch-plus premium tiers supported by cloud gaming and sports streaming. Replacement cycles in mature markets lengthen to eight years as incrementally better picture quality no longer compels an immediate upgrade.
Telecom-Led Fiber Roll-outs
Global fiber-to-the-home subscriptions reached 520 million by end-2025, propelled by 18 million EU connections under the Gigabit Infrastructure Act and 12 million U.S. lines through the Broadband Equity program.[2]OECD, “Broadband Statistics Update Q4 2025,” oecd.org Symmetrical gigabit speeds eliminate buffering on 4K streams and allow simultaneous multi-device usage, repositioning the television as each household’s entertainment anchor. Operators bundle subsidized smart TVs with 24-month contracts, trading hardware discounts for predictable ARPU growth, a tactic that works best in low pay-TV markets. Cable incumbents answer with Android TV or Roku-based boxes that unify broadcast and IP streams, but the value proposition favors integrated smart sets. As fiber overlaps expand, streaming platforms secure direct device access and shorten onboarding funnels, reinforcing the hardware–content flywheel.
Integration of FAST Channels
More than 1,800 FAST linear channels shipped natively on Samsung TV Plus, LG Channels, and Vizio WatchFree+ in 2025, redirecting ad budgets from shrinking cable audiences toward addressable TV inventory. Programmatic buying cuts cost-per-acquisition by up to 40% compared with traditional spots, so manufacturers monetize via revenue-sharing agreements that return 2–3% of gross ad spend. This recurring stream encourages aggressive pricing, effectively subsidizing hardware to grow future ad-impression volumes. Regulators in the European Union are weighing local-content quotas under the Audiovisual Media Services Directive, potentially hiking compliance costs for multi-jurisdiction product lines. Even so, FAST proliferation remains a central lever for raising lifetime value per unit and mitigating margin pressure.
Cloud-Gaming Partnerships Driving 120 Hz TVs
Native Xbox Cloud Gaming apps launched on LG and Samsung TVs in 2024, eliminating console ownership barriers and streaming AAA titles at 1080p/60 fps over 50 Mbps links. NVIDIA GeForce NOW followed on Sony Bravia and TCL sets, supporting 4K/120 Hz for latency-sensitive esports. These alliances pull 120 Hz panels into the USD 500–800 range, transforming mid-tier SKUs into viable gaming displays. HDMI 2.1 compliance with variable refresh rate and auto low-latency mode now differentiates mainstream models, while panel vendors scale driver IC output to meet rising demand. The trend forces console makers to double down on exclusive content, as hardware alone no longer anchors the ecosystem.
Restraints Impact Analysis*
| Restraint | (~) % Impact on CAGR Forecast | Geographic Relevance | Impact Timeline |
|---|---|---|---|
| Semiconductor tightness for Mini-LED backlights | -0.3% | Global, acute in North America and Europe premium segments | Short term (≤ 2 years) |
| Fragmented operating-system ecosystem | -0.2% | Global, with higher friction in emerging markets | Medium term (2–4 years) |
| EU Tier-2 energy-efficiency rules on 8K sets | -0.1% | Europe, with potential spillover to the UK and Australia | Long term (≥ 4 years) |
| Low-cost streaming dongles extending replacement cycles | -0.4% | North America and Europe mature markets | Medium term (2–4 years) |
| Source: Mordor Intelligence | |||
Semiconductor Tightness for Mini-LED Backlights
Mini-LED TVs pack 10,000–20,000 diodes, each requiring a driver IC produced mainly on TSMC’s 28 nm nodes that also serve automotive and industrial clients. Lead times hit 18 weeks in H1 2025, forcing TCL and Hisense to pare Mini-LED output to 9% of shipments. Quantum-dot films face similar constraints because annual capacity is capped at 15 million m² until new lines start after 2027. Brands pre-order panels nine months ahead, locking capital and curbing flexibility when demand shifts. Shortages primarily depress premium inventory in North America and Europe, where Mini-LED competes directly with OLED for high-ARPU buyers.
Low-Cost Streaming Dongles Extending Replacement Cycles
Amazon Fire TV Stick, Roku Express, and Google Chromecast shipped 180 million units in 2025 at USD 25–50 retail prices, refreshing legacy HD sets without full replacement. In North America and Europe, where eight-year-old panels still satisfy 1080p viewing, annual smart TV market demand loses around 12 million units. Manufacturers respond by emphasizing OLED and Mini-LED benefits, yet bandwidth-limited streaming masks picture-quality gains. Dongles also bypass built-in platforms, reducing FAST ad revenue and eroding incentives for hardware subsidies. Consequently, brands re-evaluate entry-level portfolios, trimming SKUs with gross margins below 5%.
*Our forecasts treat driver/restraint impacts as directional, not additive. The impact forecasts reflect baseline growth, mix effects, and variable interactions.
Segment Analysis
By Resolution: 8K Gains Traction Despite Content Gaps
4K UHD panels captured 65.66% revenue in 2025, anchoring the smart TV market share in mainstream screen sizes, whereas 8K UHD is forecast to log a 4.56% CAGR through 2031 as early adopters in Japan and South Korea embrace broadcasts of the 2026 FIFA World Cup qualifiers. The smart TV market size for 8K models remains small, yet AI upscaling and promotional tie-ins with next-gen consoles elevate perceived value. EU Tier-2 energy rules add USD 30–40 to bill-of-materials costs, but premium buyers accept higher prices for future-proofing.
Gen 10.5 fabs optimized for 4K cutting now face lower yields when producing 8K panels, so suppliers confine 8K to 75-inch-plus formats where higher ASPs offset utilization losses. Streaming platforms have not prioritized native 8K because subscriber willingness-to-pay does not match the bandwidth premium, leaving upscaling engines as stopgaps. Even so, tech-savvy households see 8K TVs as long-lived centerpieces, sustaining modest but steady demand.


By Screen Size: -65-Inch Segment Captures Premium Demand
The 46–55 inch bracket led 2025 revenue at 36.78%, yet units above 65 inches are pacing ahead at a 2.92% CAGR, driven by open-plan North American homes with 12-foot viewing distances. Samsung’s 98-inch Neo QLED and LG’s 97-inch OLED models, priced beyond USD 25,000, promise projector-class immersion without blackout curtains.
Panel makers tilt Gen 10.5 glass toward 75- and 85-inch cuts, elevating yield efficiency from 35% in 2023 to 48% in 2025. Retail prices for 75-inch 4K sets dropped below USD 800 in 2025, accelerating migration from mid-sizes. Sets below 32 inches continue a 2.1% CAGR decline as tablets address casual viewing needs.
By Panel Technology: Mini-LED Closes Gap with OLED
LED/LCD retained 81.22% share in 2025, yet Mini-LED units are climbing at 3.22% CAGR, offering 2,000-nit peaks and local dimming exceeding 1,000 zones. The smart TV market size for OLED remains strong in above-55-inch tiers but is capped by burn-in concerns among gamers. Mini-LED’s cost advantage lets TCL and Hisense undercut OLED by USD 500 per comparable size, inviting value-oriented upgraders.
Micro-LED stays below 0.5% share because 110-inch sets cost more than USD 50,000, although roadmaps target 70% cost reductions by 2028. Meanwhile, QLED holds a mid-tier role, trading infinite contrast for wider color volume at mainstream prices. Competitive dynamics hinge on driver-IC allocation; a sustained supply crunch could slow Mini-LED momentum and reopen headroom for OLED.
By Screen Shape: Flat Panels Dominate on Versatility
Flat displays owned 94.24% of 2025 shipments and are set to grow at 4.16% CAGR to 2031, reflecting wall-mounting trends in multi-viewer households. Curved designs linger at 5.76% share, appealing mainly to single-viewer gaming rigs. Manufacturers ended most sub-65-inch curved SKUs because specialized molds reduce fab throughput by 15–20%.
Retailers allocate minimal floor space to curved models, cutting consumer exposure, and online reviews highlight off-axis distortions in shared settings. The consolidation behind a single form factor simplifies inventory and channels R&D into brightness, contrast, and refresh-rate improvements rather than shape novelty.
By Operating System: Proprietary Platforms Gain Ground
Android TV led with 42.76% share in 2025, but Tizen and webOS are expanding at 4.89% CAGR as brands prioritize first-party data and lower royalties. Roku OS secures 18.3% share in North America, monetizing home-screen ads, yet international growth lags under 5%. Matter certification may dilute ecosystem lock-in by allowing seamless control across platforms.
Proprietary stacks capture FAST ad revenue and upsell subscription bundles, so Samsung harvested USD 1.2 billion from Samsung TV Plus in 2025. Google counters by integrating YouTube shorts and Assistant voice search, while Amazon leverages Prime memberships to seed Fire TV OS globally.
By Distribution Channel: Online Gains Share on Service Bundling
Offline retail still produced 58.88% of 2025 sales, yet e-commerce is climbing at 3.56% CAGR as Amazon and Flipkart offer free installation and extended warranties. Flipkart’s 8,000-technician network enables same-day setup across 450 cities, reducing damage rates below 2%.
Brands like Xiaomi and OnePlus exploit direct-to-consumer webstores to bypass retail margins, focusing on aggressive social-media campaigns. Brick-and-mortar chains convert showrooms into experience centers that spotlight OLED and Mini-LED demos, but capital outlays squeeze small dealers. Negotiation power tilts toward online platforms that demand co-marketing funds for homepage placement.
Geography Analysis
Asia Pacific delivered 47.32% of 2025 revenue, underpinned by China’s 52 million unit shipments and India’s 18 million units. China’s household penetration nears saturation at 98%, so growth skews toward 65-inch-plus sets sold to tier-1 urban users. India benefits from localization incentives and rising mid-income households, reducing import reliance to 34%. Southeast Asian exports from Indian plants now fill price gaps below USD 400, spreading the region’s influence.
Africa is the fastest-growing region with a 3.12% CAGR through 2031, led by Nigeria’s 12 million new fiber connections and Egypt’s duty-free panel imports.[3]Nigerian Communications Commission, “National Broadband Plan 2025 Progress,” ncc.gov.ng Mobile-money credit schemes let first-time buyers finance 32- to 43-inch smart TVs over 18 months, enlarging addressable demand. Brands partner with fintech lenders to cap default risk below 2%, unlocking recurring data-recharge bundles that raise overall ARPU.
North America accounted for 22.4% share in 2025, growing at a modest 2.1% CAGR, constrained by streaming-dongle life-extension and an eight-year replacement cycle. However, 65-inch-plus OLED and Mini-LED sales remain brisk among high-income households seeking immersive sports and gaming experiences. Europe’s 18.6% share faces similar maturity, and Tier-2 energy-efficiency rules raise compliance costs on 8K sets. South America (6.8% share) capitalizes on Mercosur tariff reductions, while the Middle East (4.9%) sees above-65-inch OLED demand in Gulf Cooperation Council states where disposable income exceeds USD 40,000.

Competitive Landscape
The top five brands, Samsung, LG, TCL, Hisense, and Xiaomi controlled 62% of 2025 unit shipments, indicating a moderately concentrated field. Samsung and LG exit sub-USD 400 tiers to protect margins, doubling down on OLED, Mini-LED, and Micro-LED R&D. TCL and Hisense close the feature gap by purchasing panel fabs and investing USD 2.8 billion in Mini-LED lines from 2023-25. Xiaomi, OnePlus, and Realme gain traction in India and Southeast Asia through direct online channels, but reliance on spot-market panels exposes them to price volatility.
White-space segments include above-85-inch displays, where shipments were only 1.2 million units in 2025 but are projected to grow at a 6.8% CAGR as panel costs fall below USD 2,000 at retail. Brands are shifting from set-top boxes to IP-based smart screens with remote diagnostics, giving Philips and Panasonic commercial footholds. Patent filings for quantum-dot electroluminescent displays reached 342 in 2025, with Samsung Display and BOE holding 68% of applications, hinting at a potential leapfrog technology by 2028.
Semiconductor bottlenecks remain a strategic risk; Mini-LED driver-IC allocation shapes product roadmaps nine months in advance. Matter certification introduces interoperability but requires re-engineering legacy lines, so brands roll out modules first on flagship series. Supply-chain localization in Mexico (Hisense-Foxconn JV) hedges against North American tariffs and slashes shipping time to big-box retailers.
Smart TV Industry Leaders
LG Electronics Inc.
Samsung Electronics Co. Ltd
TCL Electronics Holdings Limited
Xiaomi Corporation
Hisense Group Co., Ltd.
- *Disclaimer: Major Players sorted in no particular order

Recent Industry Developments
- January 2026: LG Display committed USD 3.2 billion to expand its Paju OLED fab, adding 90,000 m² of Gen 8.5 capacity and targeting 18% cost savings.
- December 2025: TCL acquired Sharp’s Sakai Gen 10 LCD fab for USD 1.8 billion, unlocking 240,000 m² monthly output for 60- and 70-inch panels.
- November 2025: Samsung introduced the Neo QLED 8K QN900D with 2,048 dimming zones and neural upscaling, pricing the 85-inch model at USD 6,499.
- October 2025: Hisense and Foxconn formed a USD 450 million JV to build a 5 million-unit TV plant in Nuevo León, Mexico, for the U.S. and Canadian markets.


Research Methodology Framework and Report Scope
Market Definitions and Key Coverage
Our study defines the smart TV market as revenues generated from factory-built televisions that embed an operating system, integrate Wi-Fi / Ethernet connectivity, and allow direct access to streaming, web, and smart-home applications without external dongles or set-top boxes. Legacy flat-panel sets that require an add-on device, hospitality displays, and commercial signage panels are left outside this boundary to keep our totals tightly linked to consumer living-room demand.
Scope exclusion: units retro-fitted with streaming sticks or external media boxes are not counted.
Segmentation Overview
- By Resolution
- HD / Full HD
- 4K UHD
- 8K UHD
- By Screen Size (Inches)
- Up to 32
- 33-45
- 46-55
- 56-65
- Above 65
- By Panel / Display Technology
- LED / LCD
- OLED
- QLED
- Mini-LED
- Micro-LED
- By Screen Shape
- Flat
- Curved
- By Operating System
- Android TV
- Proprietary and Other
- By Distribution Channel
- Offline Retail
- Online
- By Geography
- North America
- United States
- Canada
- Mexico
- Europe
- Germany
- United Kingdom
- France
- Nordics
- Rest of Europe
- South America
- Brazil
- Rest of South America
- Asia Pacific
- China
- Japan
- India
- South-East Asia
- Rest of Asia Pacific
- Middle East
- Gulf Cooperation Council Countries
- Turkey
- Rest of Middle East
- Africa
- South Africa
- Nigeria
- Egypt
- Rest of Africa
- North America
Detailed Research Methodology and Data Validation
Primary Research
Mordor analysts held structured calls with panel manufacturers, white-label assemblers, multi-brand retailers, and telecom bundle managers across Asia-Pacific, Europe, North America, and Latin America. These discussions clarified conversion rates from flat-panel output to smart-enabled sets, mapped regional ASP dispersion, and stress-tested forecast drivers such as replacement cycles and bundled fiber offerings.
Desk Research
We begin with public datasets on television production and trade from UN Comtrade, International Telecommunication Union broadband statistics, and the Consumer Technology Association shipment tracker, which provide volume anchors. Company 10-K filings, investor decks, and earnings calls supply realized average selling prices and regional mix. Trend insights on panel technology and capacity come from Display Supply Chain Association papers, while BloombergNEF and Statista dashboards help benchmark retail price swings. D&B Hoovers gives us revenue splits for leading OEMs. The sources mentioned illustrate our approach; many additional records were consulted during verification.
Market-Sizing & Forecasting
A top-down reconstruction converts global LCD/OLED TV shipments into smart-TV volumes using region-specific penetration ratios, which are then valued with weighted ASPs. Selected bottom-up checks, supplier roll-ups, and sampled retail audits tighten totals. Key model variables include household broadband subscriptions, panel cost curves, streaming-subscription penetration, GDP per capita, refresh-cycle length, and the shift toward larger screen sizes. Forecasts employ multivariate regression supplemented by scenario analysis to reflect income sensitivity and technology adoption curves, and gaps in localized bottom-up data are bridged with controlled interpolation from adjacent geographies.
Data Validation & Update Cycle
Outputs pass multi-step variance checks against historical shipment trends and independent retail indices; material anomalies trigger re-contact with interviewees before senior review sign-off. Reports refresh yearly, and any major industry event (e.g. tariff change, panel shortage) prompts an interim update so clients receive our latest vetted view.
Why Mordor's Smart TV Baseline Commands Reliability
Published estimates often diverge because firms pick different inclusion rules, pricing assumptions, and refresh rhythms. According to Mordor Intelligence, we align scope first, and then adjust for local ASP reality before applying disciplined forecast logic.
Key gap drivers include rival studies counting hybrid connected displays, rolling forward list prices rather than realized ASPs, or extrapolating one region's growth to all others without broadband or income controls, whereas our model nails region-level factors and benefits from an annual refresh cadence.
Benchmark comparison
| Market Size | Anonymized source | Primary gap driver |
|---|---|---|
| USD 263.7 Bn (2025) | Mordor Intelligence | |
| USD 227.5 Bn (2024) | Global Consultancy A | Includes streaming devices and applies uniform 4K premium across regions |
| USD 231.3 Bn (2024) | Industry Association B | Excludes platform-ad revenues; uses single shipment data source without ASP triangulation |
These comparisons show that Mordor's carefully bounded scope, region-tuned variables, and frequent updates yield a balanced baseline that decision-makers can trace, replicate, and trust.


Key Questions Answered in the Report
How large is the smart TV market in 2026?
The smart TV market size is USD 270.75 billion in 2026 and is projected to grow at a 2.63% CAGR to USD 308.31 billion by 2031.
Which resolution dominates recent shipments?
4K UHD leads with 65.66% revenue share in 2025, while 8K UHD is the fastest-growing at a 4.56% CAGR through 2031.
What factors are driving premium TV upgrades?
Fiber gigabit roll-outs, cloud-gaming integrations, and Mini-LED’s higher peak brightness are pushing many buyers toward 65-inch-plus models with 120 Hz refresh rates.
Why are replacement cycles lengthening in the United States?
Affordable streaming dongles extend the utility of older HD sets, stretching average replacement intervals to eight years.
Which region is expanding fastest?
Africa leads with a 3.12% CAGR through 2031, supported by mobile-money financing and increasing fiber penetration.
How concentrated is the supplier landscape?
The five largest brands control 62% of global shipments, reflecting moderate concentration but leaving room for emerging challengers.
Page last updated on:


