
Smart Trash Bins Market Size and Share
Market Overview
| Study Period | 2020 - 2031 |
|---|---|
| Market Size (2026) | USD 110.94 Billion |
| Market Size (2031) | USD 218.69 Billion |
| Growth Rate (2026 - 2031) | 14.55% CAGR |
| Fastest Growing Market | Asia-Pacific |
| Largest Market | North America |
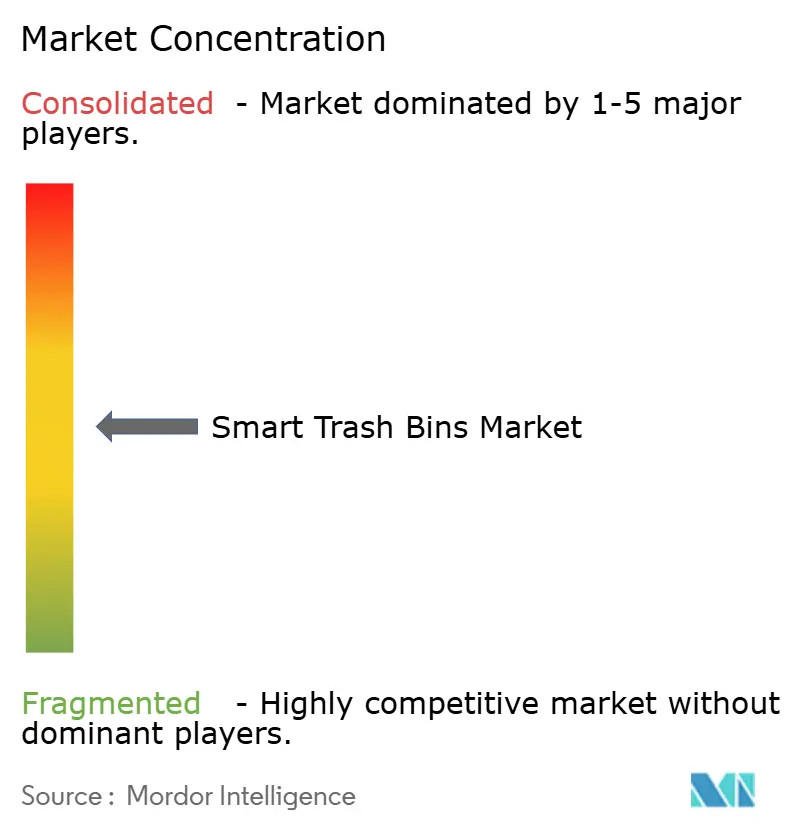
| Market Concentration | Medium |
Major Players.webp) *Disclaimer: Major Players sorted in no particular order Image © Mordor Intelligence. Reuse requires attribution under CC BY 4.0. | |
Smart Trash Bins Market Analysis by Mordor Intelligence
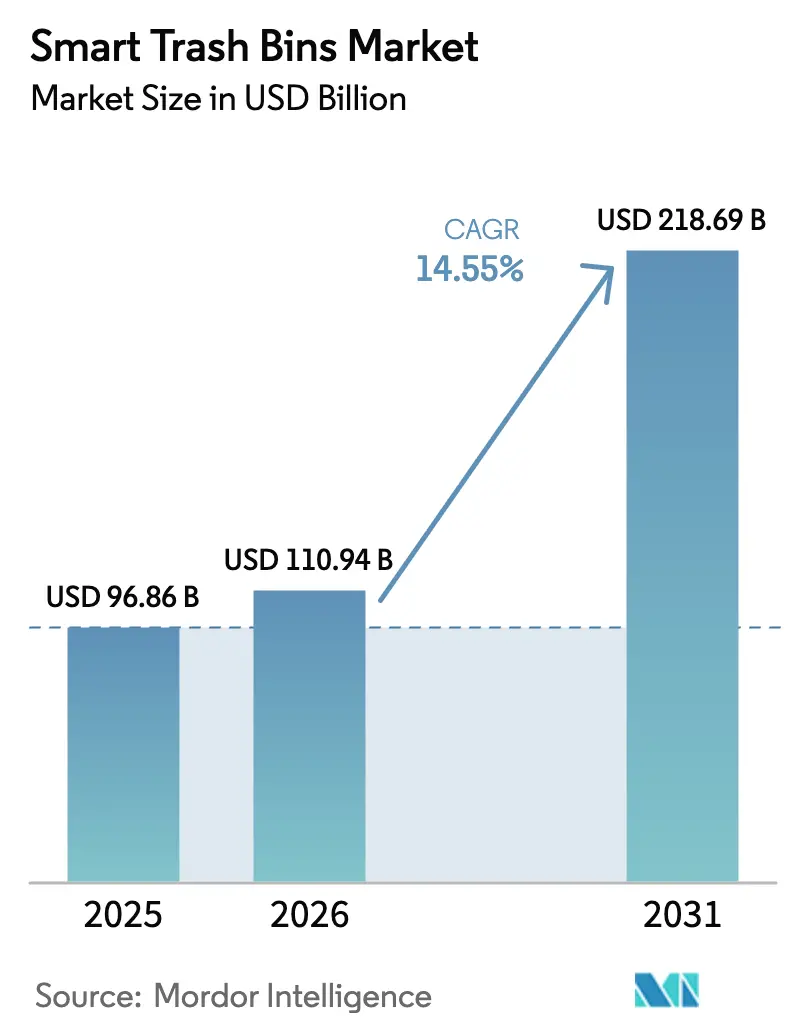
The smart trash bins market size was valued at USD 96.86 million in 2025 and estimated to grow from USD 110.94 million in 2026 to reach USD 218.69 million by 2031, at a CAGR of 14.55% during the forecast period (2026-2031). Solid waste authorities and commercial facilities are adopting intelligent collection systems because municipal digitization mandates, rapid sensor price erosion, and circular-economy regulations are now converging. North American cities adopted the technology first, demonstrating that optimized routes can cut collection costs by up to 50% while shrinking fleet-related emissions. Hardware remains the largest revenue contributor, yet demand is quickly shifting toward analytics platforms that monetize fill-level data for predictive planning. Market momentum is strongest in regions that pair smart-city grants with landfill-diversion targets, ensuring long-term budget allocations for connected bins.
Key Report Takeaways
- By solution type, hardware held 63.25% of 2025 revenue, while software and analytics are set to grow at 15.78% CAGR through 2031.
- By waste type, municipal solid waste led with 56.40% of the smart trash bins market share in 2025; organics collection is projected to expand at 15.02% CAGR to 2031.
- By end user, commercial sites captured 51.55% revenue in 2025, whereas municipal deployments are expected to progress at a 15.44% CAGR over the forecast.
- By sales channel, offline distribution controlled 57.35% of 2025 revenue; online channels are poised for a 15.61% CAGR to 2031.
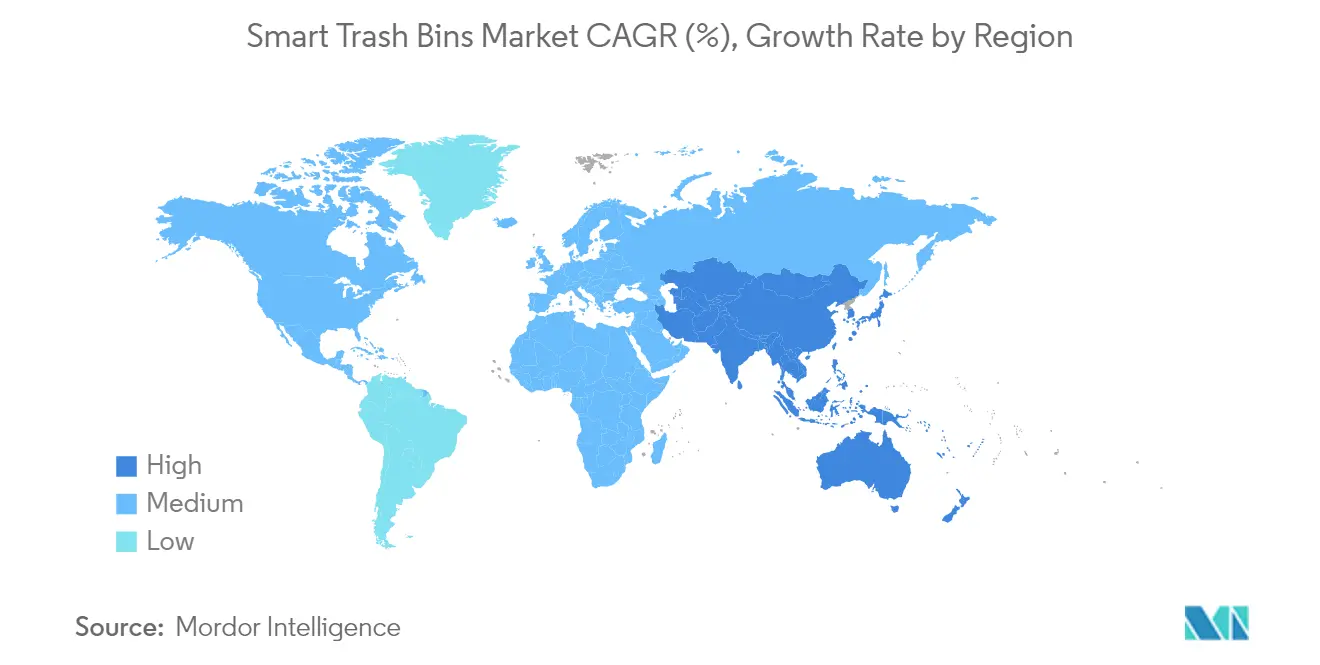
- By geography, North America accounted for 37.05% revenue in 2025; Asia-Pacific is set for the fastest 15.92% CAGR through 2031.
Note: Market size and forecast figures in this report are generated using Mordor Intelligence’s proprietary estimation framework, updated with the latest available data and insights as of 2026.
Global Smart Trash Bins Market Trends and Insights
Drivers Impact Analysis*
| Driver | (~) % Impact on CAGR Forecast | Geographic Relevance | Impact Timeline |
|---|---|---|---|
| Smart-city funding and mandates | +3.2% | North America, EU | Medium term (2-4 years) |
| IoT sensor cost decline | +2.8% | Asia-Pacific core | Short term (≤2 years) |
| Circular-economy landfill diversion rules | +2.1% | EU expanding to North America | Long term (≥4 years) |
| Edge-AI contamination detection | +1.9% | Developed markets | Medium term (2-4 years) |
| Urban population growth | +1.7% | Asia-Pacific, MEA | Long term (≥4 years) |
| Carbon-credit monetization | +1.4% | North America, EU | Long term (≥4 years) |
| Source: Mordor Intelligence | |||
Increasing Smart-City Funding and Mandate
Growing municipal budgets now earmark connected-waste infrastructure as a foundational data layer for wider urban analytics programs. Phoenix transitioned 418,000 collection points to digital monitoring that synchronizes route optimization with sustainability dashboards. Similar allocations appear in European and Canadian grant frameworks that treat sensorized bins as core utilities. Because city planners can overlay waste-generation data on traffic and demographic maps, funding streams have become recurrent. Suppliers benefit from predictable multi-year contracts that improve return on investment calculations, and the model is replicating in mid-tier US counties and Nordic municipalities.
Rapid IoT Sensor Cost Decline and Connectivity Rollout
Average fill-level sensor prices fell by more than 35% between 2023 and 2025, enabling large deployments in budget-constrained jurisdictions. Energy-efficient nodes now run 70 days on small batteries, while LPWAN backhaul eliminates the need for cellular subscriptions. Asian smart city pilots increasingly bundle LoRaWAN gateways with street-lighting upgrades, accelerating rollouts in Vietnam and Indonesia. The resulting network effect commoditizes basic telemetry and shifts competitive leverage to analytics brands that interpret bin-level data into preventive maintenance schedules.
Circular-Economy Regulations on Landfill Diversion
The EU Circular Economy Action Plan compels cities to verify diversion rates, and ISO 59000 provides measurement guidance that real-time bin telemetry can satisfy.[1]European Commission, “Circular Economy Action Plan,” European Commission, ec.europa.eu Early adopters in Belgium and the Netherlands now integrate bin data into compliance dashboards, reducing manual audit costs. North American provinces are drafting comparable landfill-levy rules, setting the stage for mandatory adoption of contamination-detection lids and blockchain traceability modules. Vendors that bundle compliance reporting into subscription tiers are securing premium margins.
Edge-AI-Enabled Contamination Detection Boosts ROI
AETECH’s battery-efficient neural networks identify recyclables with 99.3% precision, preventing costly processing of tainted loads while maintaining minimal power draw.[2]AETECH, “Edge-AI Sorting Solution Launch,” AETECH, aetech.ai The capability allows route adjustments in real time, sending contaminated bins to specialized facilities and raising tip-fee savings. The higher ROI shortens payback periods from four years to less than two in high-volume commercial districts. Competitive bids now score higher if platforms embed AI inference at the edge rather than the cloud.
Restraints Impact Analysis*
| Restraint | (~) % Impact on CAGR Forecast | Geographic Relevance | Impact Timeline |
|---|---|---|---|
| High CAPEX and uncertain payback | -2.3% | Smaller municipalities worldwide | Short term (≤2 years) |
| Fragmented procurement and long bid cycles | -1.8% | North America, EU | Medium term (2-4 years) |
| Lack of interoperability standards | -1.2% | Global | Medium term (2-4 years) |
| Labor-union resistance | -0.9% | Unionized markets | Long term (≥4 years) |
| Source: Mordor Intelligence | |||
High Upfront CAPEX and Payback Uncertainty
Connected bins cost USD 500–2,000 per unit depending on compaction and AI functions, straining budgets in towns under 100,000 residents. Although route optimization can cut fleet mileage by 25–50%, decision makers struggle to quantify secondary benefits such as reduced litter or methane avoidance. Budget cycles extend two to five years, creating mismatches with rapid hardware iteration. Vendors respond by offering lease-to-own models and performance-based contracts that tie monthly fees to verified diversion gains.
Fragmented Municipal Procurement and Long Bid Cycles
US Environmental Protection Agency guidelines recommend starting waste-service tenders years before award to align divergent objectives, prolonging sales funnels.[3]U.S. Environmental Protection Agency, “Sustainable Materials Management Procurement Guidelines,” U.S. Environmental Protection Agency, epa.gov Differing technical specs and privacy rules require vendors to customize proposals city by city, inflating pursuit costs. Smaller suppliers exit bids prematurely, reducing competitive intensity and slowing innovation. Cloud-native platforms that offer configurable APIs mitigate the fragmentation but need common data schemas to scale across borders.
*Our forecasts treat driver/restraint impacts as directional, not additive. The impact forecasts reflect baseline growth, mix effects, and variable interactions.
Segment Analysis
By Solution Type: Hardware Dominance Faces Software Disruption
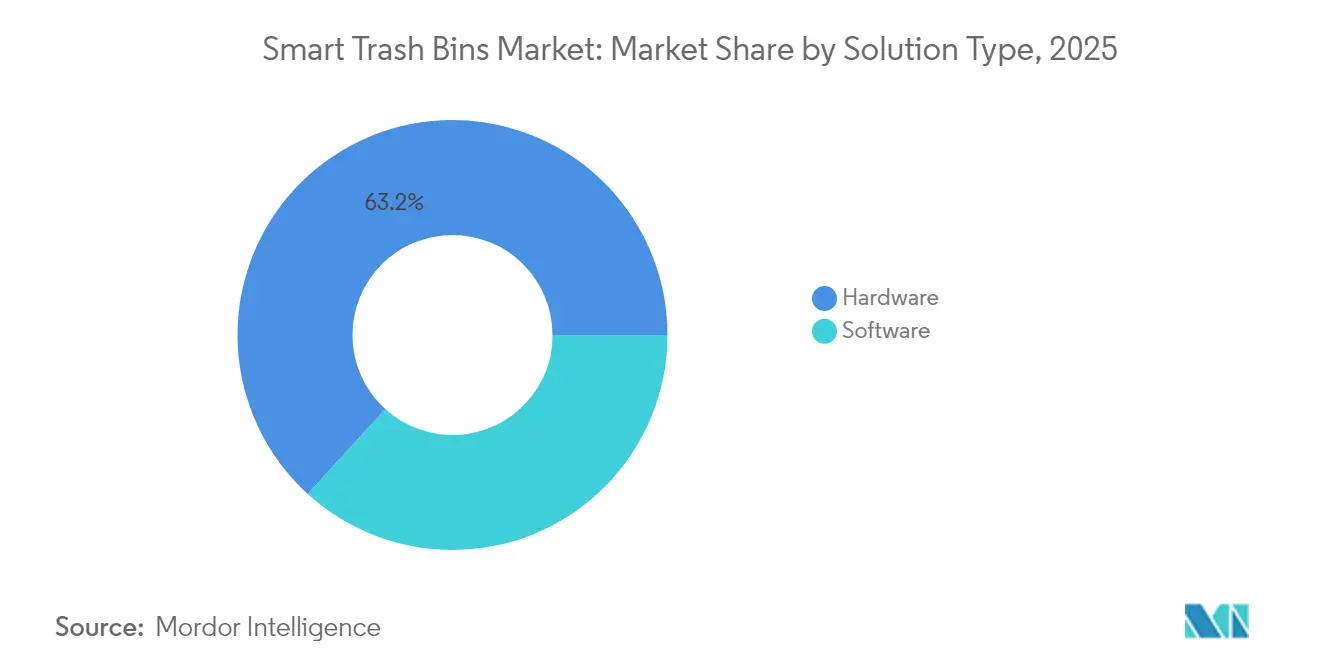
Hardware solutions still generate the bulk of smart trash bins market revenue, accounting for 63.25% in 2025. The segment includes fill-level sensors, solar compactors, RFID tags, and ruggedized communication modules that serve as the physical interface between waste streams and data clouds. Hardware sales formed the initial growth engine because municipalities required tangible assets to unlock grant disbursements, and procurement teams favored capital expenditure models that allocate devices to asset registers. Standardization is narrowing performance gaps among vendors, making price parity the norm for sensor payloads.
Software and analytics platforms now represent the fastest-growing revenue component at 15.78% CAGR to 2031. The shift repositions data rather than devices as the primary value driver, enabling suppliers to upsell predictive algorithms, dashboard subscriptions, and application-programming-interface access to third-party planners. As a result, recurring revenue share is expected to exceed 40% of the smart trash bins market size for leading vendors by 2028. Edge-AI upgrades further reduce haulage costs, securing budget approvals even in CAPEX-constrained municipalities. Service providers that combine firmware over-the-air updates with business-intelligence tools enjoy higher renewal rates and lower churn.


By Sales Channel: Digital Transformation Accelerates Online Growth
Offline integrators captured 57.35% of 2025 revenue because city engineering teams still rely on incumbents for installation, training, and multiyear maintenance. Local distributors navigate building codes, zoning rules, and collective-bargaining agreements that often dictate bin footprint and servicing schedules. Their field technicians also perform warranty repairs that safeguard service-level agreements.
Online platforms, however, are expanding fast at 15.61% CAGR as standardized, smaller-scale smart trash bins enter catalogues on industrial-procurement portals. Municipalities use e-tendering portals for pilot orders that evaluate proof-of-concept metrics before issuing citywide RFPs. Vendors leverage direct-to-customer storefronts to bypass distribution margins and to gather fleet-wide telemetry into centralized clouds without data-handoff delays. Over the forecast horizon, digital channels will likely claim double-digit revenue share increases, particularly for compact indoor units bought by private campuses.
By Waste Type: Organics Drive Specialized Collection Innovation
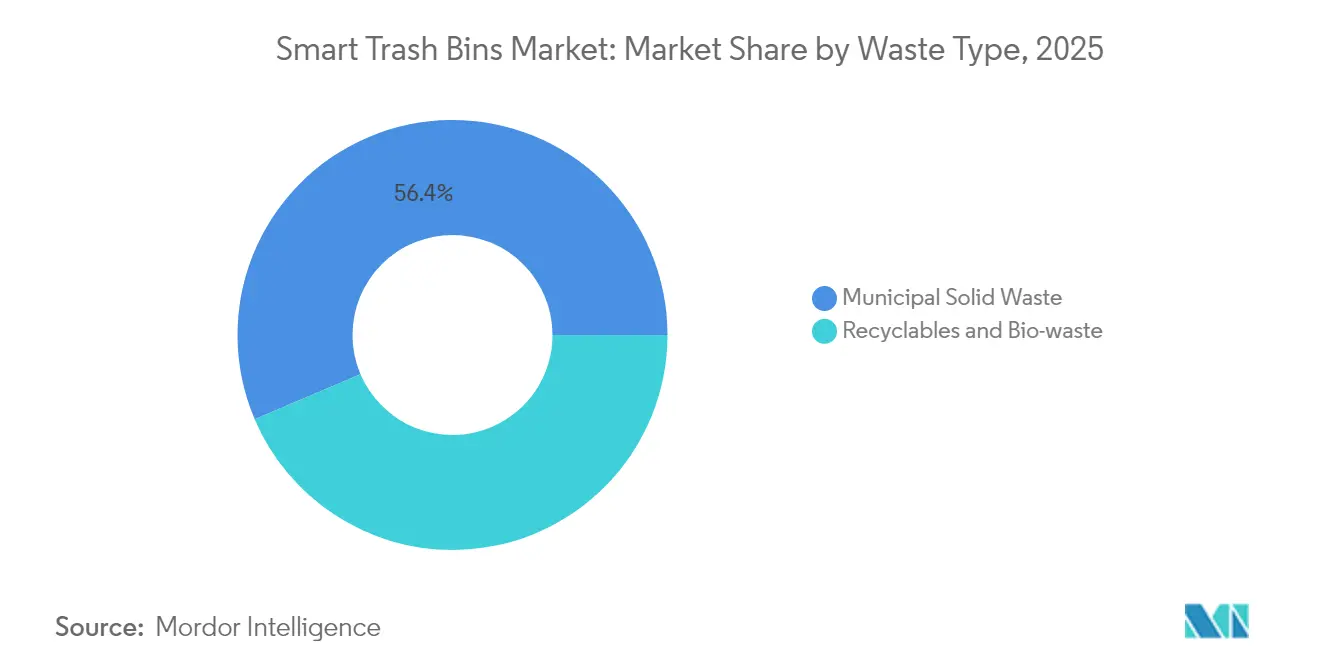
Municipal solid waste remains the dominant stream, holding 56.40% of 2025 revenue because every urban zone requires frequent residual collection. Smart lids that report fill status every two hours allow fleet dispatchers to reconfigure routes dynamically, avoiding half-empty pickups and lowering overtime expenses. The discipline of constant volume measurement also discourages illegal dumping, cutting cleanup budgets in central business districts.
Organics and bio-waste represent the most dynamic opportunity with a projected 15.02% CAGR. Composting mandates in Canada and Western Europe pay tipping-fee rebates for verified diversion tonnage, making sensorized organics carts financially attractive. Smart trash bins fitted with temperature probes and odor sensors prevent contamination that downgrades compost quality. Verified data streams qualify for carbon-credit issuance, creating an extra revenue lever for municipal treasuries. Recyclables remain a mature yet stable sub-segment; the addition of AI vision modules that achieve 99% material-type accuracy protects bale purity and sustains commodity prices.
By End User: Municipal Adoption Accelerates Sustainability Goals
Commercial facilities such as shopping malls, corporate campuses, and hotels led adoption, producing 51.55% of smart trash bins market revenue in 2025. Their condensed waste volumes magnify savings from compaction and real-time scheduling, and corporate ESG scorecards elevate visible technology investments. Private buyers also face fewer procurement barriers, shortening decision cycles to months rather than years.
Municipal deployments, however, are positioned to grow fastest at 15.44% CAGR because climate-neutrality pledges require verifiable diversion data. Cities are installing sensorized bins in parks and transit corridors to capture real-time litter trends, supporting public cleanliness indices that influence tourism and downtown revitalization budgets. Residential curbside pilots in the United Kingdom illustrate how neighborhood-level analytics can inform fleet right-sizing and capital-equipment deferrals. The public sector’s scale advantage will expand its share of the smart trash bins market through 2031.
Geography Analysis
North America held 37.05% of global revenue in 2025, reflecting early grant programs, robust IoT infrastructure, and established vendor ecosystems. Phoenix digitized weekly pickups across 418,000 locations, linking fill-level APIs to its climate dashboard for transparent performance monitoring. New York City’s plan for stationary curbside units underscores how dense urban footprints catalyze compactor adoption. Cloud-based platforms integrate seamlessly with 4G and low-power networks prevalent across US and Canadian metro areas, ensuring high uptime and rapid firmware updates.
Asia-Pacific will register a 15.92% CAGR through 2031, the swiftest worldwide. Rapid urbanization forces local governments to leapfrog legacy fleet models and invest directly in AI-enabled waste infrastructure. South Korea’s AETECH robots sort 96 items per minute, boosting recycling centers’ throughput without expanding labor rosters. Governments in Thailand, Vietnam, and Indonesia embed waste-data requirements in smart-city masterplans, triggering competitive tenders valued at tens of millions of USD. LPWAN coverage grows as utilities deploy network backbones, lowering operating costs compared with cellular telemetry.
Europe maintains steady expansion underpinned by rigorous diversion quotas in the EU Circular Economy Action Plan. Member states must record contamination incidents and recycling output, driving purchase orders for bins equipped with optical sensors and barcode scanners. The European Environment Agency validates technology pilots that demonstrate 30% reductions in residual collections after smart-bin rollout. Nordic cities capitalize on 0G networks from Heliot Europe to monitor rural containers where cellular signals are scarce. As ISO 59000 gains adoption, municipalities employ standardized APIs to transmit diversion metrics directly into environmental-audit platforms, cementing software-as-a-service renewals.

Regulatory Landscape
Smart trash bin deployments are increasingly influenced by performance, data-security, and monitoring requirements built into municipal solid-waste standards. In China, GB/T 42767-2023 sets general design and management requirements for municipal solid waste collection installations, while provincial and city-level rules add operational controls that affect connected-bin specifications and data handling.
Several local standards in China explicitly reference digital monitoring and cybersecurity expectations that flow into supplier requirements for sensors, gateways, and platforms. Jiangsu Province DB32/T 4801-2024 for intelligent collection facilities for classified domestic waste includes data-security provisions such as AES-256 encryption and use of government-specific network transmission. Huzhou (Zhejiang) DB3305/T 333-2024 mandates items including 15-day video storage for monitoring and dynamic weighing deviation limits of plus or minus 3% for collection vehicles. In parallel, a national standard project (20253481-T-333, posted 2025-06-12 in the State Administration for Market Regulation database) for intelligent bin technical requirements under development by the National Urban Environment Sanitation Standardization Technical Committee points to continued movement toward codified, interoperable technical baselines that vendors must design to and municipalities can procure against.
Value Chain Analysis
The smart trash bins value chain starts with component suppliers such as sensors, cameras or optics, connectivity modules, and power systems including solar and batteries. OEMs then assemble smart bins and containers, with some providers also addressing compaction and AI-enabled sorting at disposal points. The chain further extends to software and IoT solution providers that ingest telemetry (fill level, contamination events, temperature or odor, location), manage device fleets, and deliver analytics for route optimization and service scheduling. Enevo, for example, reflects this platform layer by converting bin-level data into operational plans for municipalities and commercial facility operators.
Downstream, system integrators and waste service operators install, commission, and maintain assets, linking connected bins to municipal operations centers and compliance dashboards. Value capture is moving from one-time hardware sales toward recurring software subscriptions, firmware or OTA services, and data products such as dashboards, APIs, and digital twins. These outputs support audits, service-level reporting, and resilience planning. Cybersecurity, monitoring retention, and weighing-tolerance requirements also reinforce the need for certified hardware, secure communications, and auditable data pipelines across the ecosystem.
Competitive Landscape
The smart trash bins market is moderately fragmented. The top five suppliers collectively control an estimated 45% of 2025 revenue, while many regional start-ups concentrate on niche applications. Bigbelly remains the benchmark incumbent with more than 1,800 municipal and private clients in 60 nations, bundling hardware leasing with its CLEAN cloud that automates route sequences.[4]Bigbelly, “CLEAN Software Subscription Guide,” Bigbelly, bigbelly.com Its scale advantages include a global maintenance network and component purchasing power that sustains gross-margin leadership.
Disruptors differentiate through edge-AI capabilities that improve sorting accuracy and energy efficiency. AETECH raised 8.6 billion KRW in 2025 to commercialize compact robots that retrofit onto existing conveyor lines, delivering 99.3% purity even in mixed-material streams. SusGlobal monetizes verified organics diversion by selling carbon credits worth CAD 5-10 per ton, illustrating a revenue model that transcends hardware sales. Start-ups are also integrating blockchain ledgers that timestamp fill events, offering immutable audit trails for extended-producer-responsibility schemes.
Strategic moves center on vertical integration, with sensor makers acquiring data-analytics studios to secure full-stack portfolios. Partnerships between antenna specialists and bin manufacturers improve signal reliability in sub-basements and alleyways, unlocking new indoor applications. Suppliers are also exploring product-as-a-service contracts that shift CAPEX to operating budgets, addressing procurement hurdles in smaller jurisdictions. Because interoperability standards remain fluid, ecosystem control is emerging as a key battleground over the next five years.
Smart Trash Bins Industry Leaders
CleanRobotics
Ausko Pte Ltd
Evreka
Enevo Inc.
iTouchless Housewares and Products Inc.
- *Disclaimer: Major Players sorted in no particular order

Market Opportunities and Future Outlook
Compliance-grade data and auditability are creating whitespace for suppliers that bundle secure telemetry, monitoring retention, and reporting into an integrated offer. Provincial and city rules in China already set anchors such as AES-256 encryption for intelligent classified-waste facilities (DB32/T 4801-2024) and requirements including 15-day video storage and plus or minus 3% dynamic weighing deviation limits for collection vehicles (DB3305/T 333-2024). These provisions broaden opportunities for platform vendors selling configuration templates, compliance dashboards, and managed connectivity that reduce customization burden across fragmented municipal procurements.
A second opportunity is in end-to-end digital ecosystems that connect waste generators, haulers, recyclers, and public agencies using tools such as digital twins, predictive analytics, and traceability modules to support circular-economy reporting. Operational evidence cited in the report context, including route optimization cutting collection costs by up to 50% in early North American city rollouts, supports demand for analytics-first packages where savings are tied to subscription value. Industry programs and guidance focused on digitalizing waste operations, including practical playbooks from development finance bodies such as IFC, also expand implementation services and platformization opportunities. This is especially relevant where municipalities want standardized data exchange across smart-city dashboards rather than standalone bin telemetry.
Recent Industry Developments
- July 2026: Evreka published a technical update on its Digital Twin waste management platform for predictive intelligence in operational planning. The release strengthens Evreka's end-to-end software proposition and enhances predictive planning for municipal and commercial deployments.
- July 2026: Evreka published a technical update on its Digital Twin waste management platform for predictive intelligence in operational planning. The update reinforces Evreka's software stack and supports more accurate routing and scheduling for smart waste programs.
- April 2026: Ausko Pte Ltd published a guide regarding Singapore’s Beverage Container Return Scheme, noting a 10-cent deposit-refund model for plastic bottles and metal cans. The guide positions Ausko as a regulatory-adjacent enabler and expands a reference framework for deployments in regulated systems.


Research Methodology Framework and Report Scope
Market Definition and Coverage
For this methodology, the smart trash bins market includes connected waste bins that use sensors and connectivity to track fill level and related status, plus the supporting software used to monitor and manage them across residential, commercial, and municipal settings.
Scope exclusions: We exclude conventional non-connected bins and general city waste services that are not directly tied to smart-bin hardware or its monitoring software.
Segmentation Overview
- By Solution Type (Value)
- Hardware (Fill-level sensors, RFID, optical, compaction)
- Software / Analytics Platforms
- By Sales Channel (Value)
- Offline (Distributors, System Integrators)
- Online (Direct, E-commerce)
- By Waste Type (Value)
- Municipal Solid Waste
- Recyclables
- Bio-waste / Organics
- By End User (Value)
- Residential
- Commercial
- Municipal / Public Spaces
- By Geography
- North America
- United States
- Canada
- Mexico
- South America
- Brazil
- Argentina
- Rest of South America
- Europe
- Germany
- United Kingdom
- France
- Rest of Europe
- Asia Pacific
- China
- Japan
- India
- South Korea
- Rest of Asia Pacific
- Middle East and Africa
- United Arab Emirates
- Saudi Arabia
- South Africa
- Rest of Middle East and Africa
- North America
Data Sources, Market Sizing, and Validation
Desk Research
Desk research starts with public signals that explain where demand for connected bins tends to form, and how quickly deployments can scale. We reviewed sources such as municipal solid waste statistics from the World Bank, city and national open data portals for waste collection KPIs, and OECD or EPA-style datasets that indicate waste generation and diversion trends.
To avoid sizing the market on publicity alone, we also used evidence that links projects to purchasing, such as smart-city procurement notices, published tenders, and standards or guidance notes from waste and recycling associations. Company filings, investor decks, and reputable press were used to map product positioning and typical pricing logic, and then those were cross-checked with paid subscriptions that help with company financials, contract tracking, and patent activity. The desk sources listed here are illustrative, and many additional public and paid references were used to validate data points and clarify assumptions.
Primary Interviews and Surveys
Primary work focused on confirming what gets bought in real deployments, and how value is split between bin hardware and monitoring software. We spoke with municipal waste decision-makers, facility operators, system integrators, and component and solution suppliers across major regions, so adoption pace, replacement cycles, and price ranges could be stress-tested before finalizing the model.
Distribution of primary research fieldwork respondents
| Company type | Respondent position | Region |
|---|---|---|
| Top tier: 39% | CXOs: 15% | APAC: 41% |
| Mid tier: 40% | Functional/Unit leaders: 42% | EMEA: 36% |
| Smaller Players: 21% | Managers: 43% | Americas: 23% |
Market-Sizing & Forecasting
Sizing is built using a top-down approach where municipal waste activity, smart-city rollout intensity, and procurement behavior are used to reconstruct the addressable demand pool for connected bins, and then translated into value using typical system configurations. The totals are corroborated with selective bottom-up approximations, such as sampling average selling prices by bin type and rolling up a set of visible deployments and channel checks, which helps correct for over-counting and under-counting.
Key inputs that shape the model include the number of bins deployed per site type (parks, streets, campuses, malls), expected replacement and maintenance cycles, the share of deployments that include software subscriptions, regional public spending signals for smart-city or sanitation programs, and the split by waste streams (municipal solid waste, recyclables, and organics), which influences sensor needs and pricing. Where primary feedback shows gaps in reported deployment volumes, we handle it with scenario-based penetration rates tied to city size tiers and observed procurement frequency.
For forecasting, we rely on scenario analysis supported by expert consensus on sensor price trends, connectivity cost progression, and the timing of municipal digitization programs. Short-term assumptions are adjusted for project lead times, and longer-range growth is kept realistic by checking adoption against waste generation growth and budget capacity trends.
Data Validation & Update Cycle
Validation is done through multiple checks so the final values do not depend on a single dataset. We compare model outputs against independent signals such as publicly announced deployments, tender volumes, and typical unit economics from interviews, and then investigate any large variances before sign-off.
Anomalies are reviewed in analyst-to-analyst checks, followed by targeted re-contact of sources when a pricing point or adoption assumption looks out of line for a region or end user. The report is refreshed annually, and interim updates are triggered when material events shift demand expectations, such as policy changes, large municipal programs, or supply constraints. Before delivery, a final pass is completed so clients receive the most current view of the market.
Mordor Intelligence's Smart Trash Bins Market Size Compared With Other Published Estimates
Published estimates for smart trash bins can look far apart, even when they discuss similar adoption drivers, because the counted product scope and the value components are not always the same. Differences in whether software is included, how deployments are annualized, and which end users are counted usually create most of the spread.
The main gap comes from whether software subscriptions and analytics fees are counted alongside connected-bin hardware, where Mordor Intelligence includes both only when they are directly tied to installed smart-bin monitoring use and active deployments. Another driver is the base year and currency timing, since some sources anchor on an earlier year or mix list prices with discounted public tenders, which shifts the value even when unit volumes are similar.
Benchmark comparison
| Source | Market Size | Gaps in Research Methodology |
|---|---|---|
| Mordor Intelligence | USD 96.86 M (2025) | |
| Trade Journal A | USD 84.19 M (2024) | Uses an earlier base year and appears to emphasize bin hardware value, which can understate totals in markets where monitoring platforms are sold as recurring subscriptions. |
| Regional Consultancy B | USD 120.64 M (2026) | Anchors on a later year and can reflect aggressive rollout assumptions for municipal programs, and it may not consistently adjust for project lead times and procurement delays. |
Taken together, the table shows that the biggest swings usually come from what gets counted and when it gets counted, not from a completely different view of adoption. Our approach keeps the estimate traceable to deployments, price logic, and a few repeatable checks, so decision-makers can map the total back to clear drivers and update it as conditions change.


Key Questions Answered in the Report
What is the current size of the smart trash bins market?
The market stands at USD 110.94 million in 2026 and is projected to reach USD 218.69 million by 2031.
How fast is the marke growing?
It is expanding at a 14.55% compound annual growth rate (CAGR) during 2026-2031.
Which region holds the largest market share?
North America leads with 37.05% revenue share in 2025, reflecting early smart-city funding and mature IoT infrastructure.
Which region will grow the fastest through 2031?
Asia-Pacific is forecast to post the highest 15.92% CAGR, driven by rapid urbanization and government-backed smart-city programs.
What segment is growing more quickly—hardware or software?
Software and analytics platforms are advancing at a 15.78% CAGR, outpacing hardware as municipalities seek data-driven optimization.
What is the biggest barrier to adoption?
High upfront capital expenditure (USD 500–2,000 per unit) and uncertain payback periods remain the key obstacles for smaller municipalities.
Page last updated on:






