
Smart Television And Set-Top Box Market Size and Share
Market Overview
| Study Period | 2020 - 2031 |
|---|---|
| Market Size (2026) | USD 334.82 Billion |
| Market Size (2031) | USD 375.74 Billion |
| Growth Rate (2026 - 2031) | 2.32% CAGR |
| Fastest Growing Market | Asia-Pacific |
| Largest Market | North America |
| Market Concentration | Medium |
Major Players *Disclaimer: Major Players sorted in no particular order Image © Mordor Intelligence. Reuse requires attribution under CC BY 4.0. | |
Smart Television And Set-Top Box Market Analysis by Mordor Intelligence
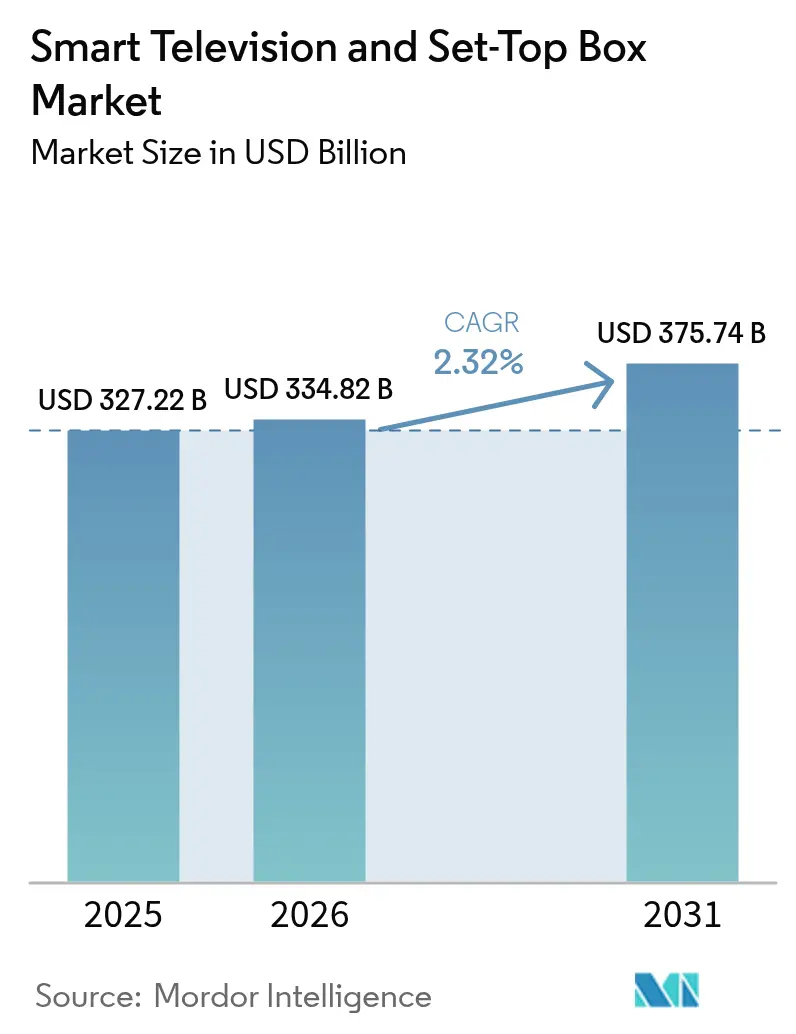
The smart television and set-top box market size is expected to grow from USD 327.22 billion in 2025 to USD 334.82 billion in 2026 and is forecast to reach USD 375.74 billion by 2031 at 2.32% CAGR over 2026-2031. The market advances on the back of sustained consumer demand for 4K screens, AI-enhanced picture processing, and integrated streaming platforms that lift average selling prices even as competitive pricing from Chinese brands tempers revenue growth. Streaming now claims more viewing hours than broadcast or cable, prompting device makers to load fuller operating systems, pursue advertising income, and shorten product refresh cycles. 4K UHD dominates shipments, retailer-owned ad platforms subsidize hardware, and government digital-switchover programs in emerging nations lock in baseline demand for low-cost digital STBs. Meanwhile, privacy statutes such as GDPR and CCPA restrict data-monetization levers, pressing vendors to balance compliance with revenue optimization.
Key Report Takeaways
- By technology, hybrid and OTT-capable boxes led the category with 38.00% of smart television and set-top box market share in 2025 while posting the fastest expected 3.96% CAGR to 2031.
- By resolution, 4K UHD captured 45.02% revenue share in 2025; the 8K segment is projected to advance at the highest 3.05% CAGR through 2031.
- By display size, 55-65-inch models held 41.05% of the smart television and set-top box market size in 2025, whereas screens 66 inches and larger are poised for a 3.55% CAGR to 2031.
- By display technology, LED and LCD panels commanded 59.68% share in 2025, yet Micro-LED exhibits the fastest 2.76% CAGR across the forecast window.
- By operating system, Android and Google TV controlled 23.85% of shipments in 2025; Roku TV OS is set to achieve a 3.09% CAGR after licensing gains with second-tier brands.
- By end user, residential customers accounted for 81.74% of 2025 volume, while commercial and hospitality installations show the quickest 2.84% CAGR to 2031.
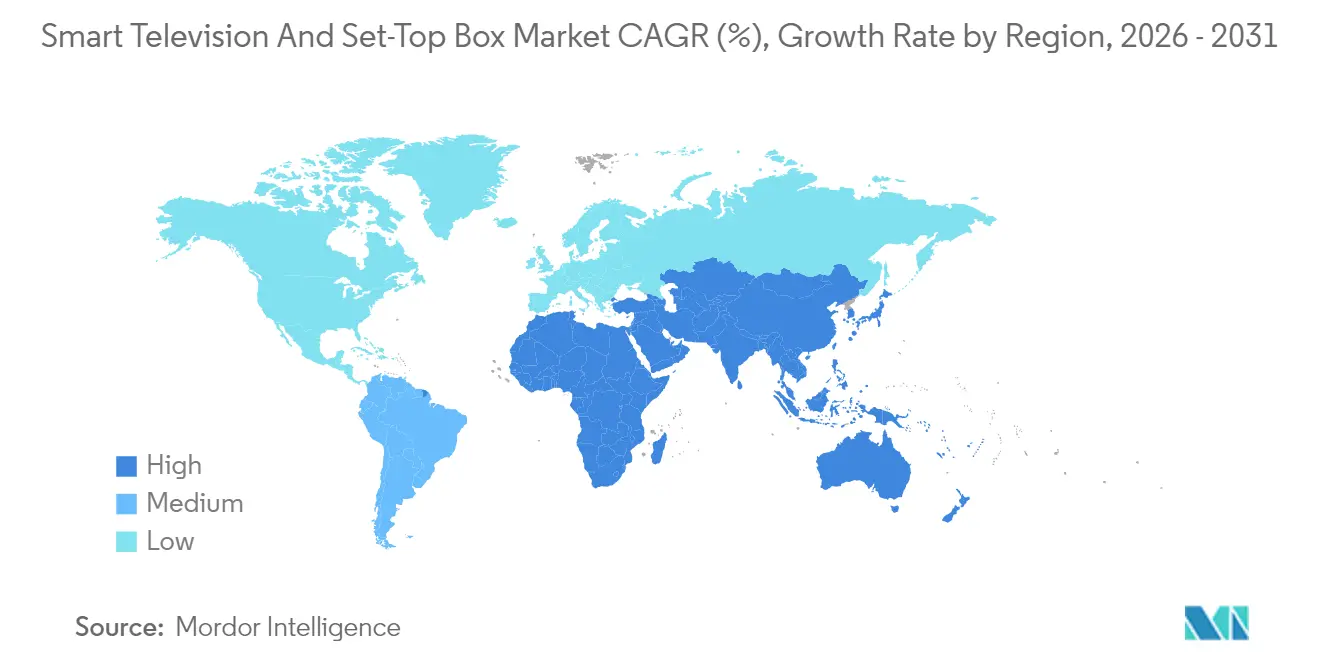
- By geography, Asia Pacific accounted for the largest share with 38.26% in 2025, while Asia Pacific is expected to grow at the fastest CAGR of 3.33%.
Note: Market size and forecast figures in this report are generated using Mordor Intelligence’s proprietary estimation framework, updated with the latest available data and insights as of 2026.
Global Smart Television And Set-Top Box Market Trends and Insights
Drivers Impact Analysis*
| Driver | (~) % Impact on CAGR Forecast | Geographic Relevance | Impact Timeline |
|---|---|---|---|
| Surging Streaming Platform Subscriptions Driving Device Refresh | +0.60% | Global, with concentration in North America, Europe, and Asia Pacific urban centers | Medium term (2-4 years) |
| Transition to High-Definition, 4K and 8K Broadcasting Standards | +0.50% | Asia Pacific (Japan, South Korea), Europe (select markets), North America | Long term (≥ 4 years) |
| Government Digital Switchover Mandates in Emerging Nations | +0.40% | Africa (South Africa, Kenya, Nigeria), Southeast Asia (Cambodia, Myanmar), Latin America (select markets) | Short term (≤ 2 years) |
| AI-Based Upscaling Enhancing Value of Legacy Content | +0.30% | Global, with early adoption in premium segments across North America, Europe, and Asia Pacific | Medium term (2-4 years) |
| Retailer-Owned Smart-TV Ad Platforms Expanding OEM Revenue Streams | +0.20% | North America, with spillover to Europe and select Asia Pacific markets | Medium term (2-4 years) |
| Domestic Manufacturing Incentives Reducing STB Production Costs | +0.20% | India, Southeast Asia (Vietnam, Thailand), Latin America (Mexico, Brazil) | Short term (≤ 2 years) |
| Source: Mordor Intelligence | |||


Surging Streaming Platform Subscriptions Driving Device Refresh
Streaming took a majority share of total viewing in June 2024, and the milestone has accelerated household upgrades from legacy flat panels to connected 4K units that support bandwidth-intensive apps. Operators in Europe and Asia bundle smart televisions with fiber packages to curb churn, extending the trend beyond North America. Manufacturers answer with faster processors and extra memory, but legacy STB vendors struggle because older chipsets cannot decode modern codecs such as AV1. The refresh wave propagates along urban broadband corridors where 100 Mbps service is common, shortening replacement cycles to five years or less. Brands positioned with wide app ecosystems and voice assistants capture the uplift in unit value even as hardware margins thin.
Transition to High-Definition, 4K and 8K Broadcasting Standards
Japan’s NHK scaled its 8K satellite feeds for the 2024 sporting calendar, and South Korean broadcasters committed to 4K over-air rollouts via ATSC 3.0 by 2026. These moves align with European directives that phase out SD signals by 2030, creating mandatory demand for tuners embedded in next-generation panels. As 4K panel lines already account for most global LCD capacity, per-unit costs fall, letting mid-tier brands ship native-4K sets at historical full-HD prices. Consumers consequently perceive 4K as the new baseline, while early adopters gravitate to 8K for large-screen home theaters and commercial signage.
Government Digital Switchover Mandates in Emerging Nations
South Africa switched off analog broadcasting in March 2024, Cambodia and Kenya followed suit, and more than 40 countries remain mid-transition according to the International Telecommunication Union. Subsidy programs distribute entry-level STBs so low-income homes retain free-to-air channels. The result is a sharp, short-lived spike in STB orders, typically six to 12 months before and after the shut-off date. Price sensitivity remains intense; public tenders often stipulate sub-USD 20-unit caps, propelling volume toward high-scale Chinese assemblers that maintain razor-thin margins yet dominate bid awards.
AI-Based Upscaling Enhancing Value of Legacy Content
Samsung’s NQ4 AI Gen2, LG’s Alpha 11, and Sony’s Cognitive Processor XR all debuted in 2024 and train neural networks to elevate HD footage to near-4K clarity. Upscaling improves perceived picture quality for vast back catalogues that remain below native UHD, encouraging premium television purchases even when 8K content libraries lag. The processors also optimize audio, reduce noise, and adjust contrast scene-by-scene, helping brands defend higher ASPs against budget competitors. As chip costs fall, AI features will cascade into mid-range models, widening their total addressable market.
Restraints Impact Analysis*
| Restraint | (~) % Impact on CAGR Forecast | Geographic Relevance | Impact Timeline |
|---|---|---|---|
| Intense Price Competition Compressing Vendor Margins | -0.40% | Global, with acute pressure in Asia Pacific and emerging markets | Short term (≤ 2 years) |
| Proliferation of Low-Cost Streaming Sticks Cannibalizing STBs | -0.30% | North America, Europe, urban Asia Pacific | Medium term (2-4 years) |
| Panel Tariff Realignments Disrupting Display Supply Chains | -0.20% | North America, Europe (import-dependent markets) | Short term (≤ 2 years) |
| Data-Privacy Regulations Curbing Smart-TV Data Monetisation | -0.20% | Europe (GDPR), North America (CCPA, state-level laws), with spillover to Asia Pacific | Medium term (2-4 years) |
| Source: Mordor Intelligence | |||
Intense Price Competition Compressing Vendor Margins
TCL and Hisense continued to grow share in 2024 by pricing Mini-LED televisions 30% below Samsung and LG equivalents, leveraging integrated Chinese supply chains that shave logistics and component costs. Set-top box contract prices now dip under USD 15 for IPTV models, squeezing operator subsidies and eroding vendor profitability. Regulatory scrutiny adds pressure: the U.S. Federal Trade Commission fined Vizio for data-collection infractions in 2024, restricting an offsetting revenue stream based on viewer analytics. Established brands therefore navigate a margin squeeze that rewards economies of scale and software-based revenue diversification.
Proliferation of Low-Cost Streaming Sticks Cannibalizing STBs
Amazon and Roku retail 4K HDR dongles under USD 50, providing voice search and large app libraries that meet viewing needs for many households. Roku counted 81.6 million active accounts by Q3 2024, with platform revenue of USD 908 million for the quarter, highlighting the draw of advertising-led models. As broadband penetration tops 80% in North America and parts of Europe, consumers swap wired pay-tv boxes for Wi-Fi streaming sticks, cutting hardware clutter and monthly fees. Cable and satellite operators, once insulated by proprietary equipment, must now justify set-top rental charges or pivot to soft-client apps.
*Our forecasts treat driver/restraint impacts as directional, not additive. The impact forecasts reflect baseline growth, mix effects, and variable interactions.
Segment Analysis
By Technology: Hybrid and OTT Boxes Consolidate Operator Strategies
Hybrid and OTT devices accounted for the largest slice of the smart television and set-top box market share at 38.00% in 2025 and are projected to notch the fastest 3.96% CAGR to 2031. Operators in North America and Europe deploy Android TV Operator Tier hardware that merges linear channels with streaming libraries, helping them stem subscriber losses. The smart television and set-top box market size attributable to satellite STBs continues to shrink as DirecTV and peers reallocate capital toward pure streaming services, whereas IPTV boxes remain critical in fiber rollouts across Asia Pacific and the Middle East. Cable STBs suffer from cord-cutting and regulatory mandates favouring open standards. Over the forecast period, differentiation tilts from proprietary hardware to software updates that enable voice navigation, cloud DVR, and targeted advertising.
Hybrid solutions also give pay-TV providers tools to balance bandwidth, local caching, and service personalization without replacing entire video head-ends. They leverage common SoC families, cutting development cycles and enabling feature updates over-the-air. For contract manufacturers in Vietnam and Mexico, the pivot unlocks higher bill-of-materials value compared to legacy zappers, cushioning margins against falling average selling prices. That said, design wins now hinge on compliance with privacy frameworks that compel clear opt-out pathways for data collection, adding firmware and certification complexities.


By Resolution: 4K UHD Keeps Volume Lead as 8K Carves Premium Niche
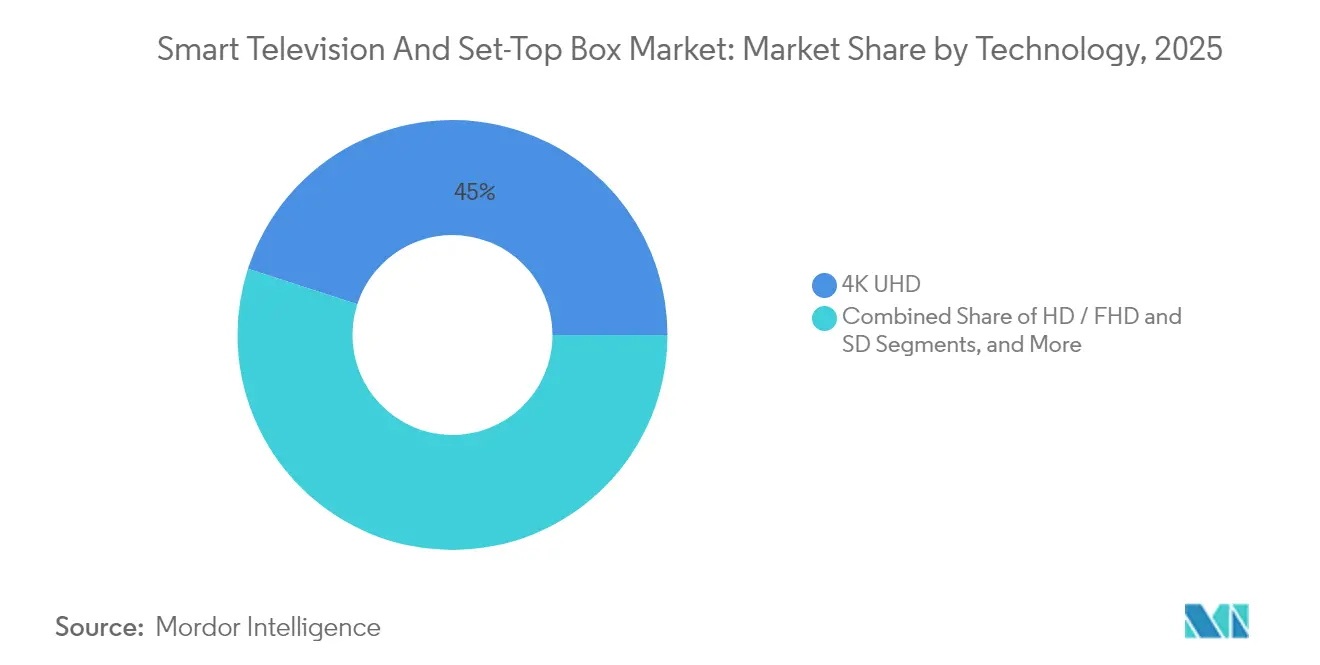
The 4K UHD cohort held 45.02% of 2025 shipments, a level expected to stay north of 40% through 2031 as panel yields rise and content libraries broaden. 8K sets, while only a mid-single digit share today, show a 3.05% CAGR driven by NHK’s 8K broadcasts and Samsung’s push into Micro RGB displays. The smart television and set-top box market size tied to 8K leans heavily on home-theater enthusiasts and digital signage buyers willing to pay premiums for high pixel density. Standard-definition units linger in subsidy-driven switch-over programs across Africa and Southeast Asia but trend downward as governments phase out analog feeds.
Consumers perceive 4K as the new normal for living-room screens 55 inches and larger, and average selling prices for 65-inch 4K sets fell another 8% year on year in 2024. Supply-chain efficiencies permit brands to bundle 120 Hz panels and HDMI 2.1 ports without hefty price premiums, boosting appeal to gamers. In contrast, 8K makers bank on AI-based upscaling and Micro-LED advances to justify valuation gaps until full-resolution content becomes mainstream, likely post-2028.
By Display Size: Large Screens Lift ASPs and Commercial Demand
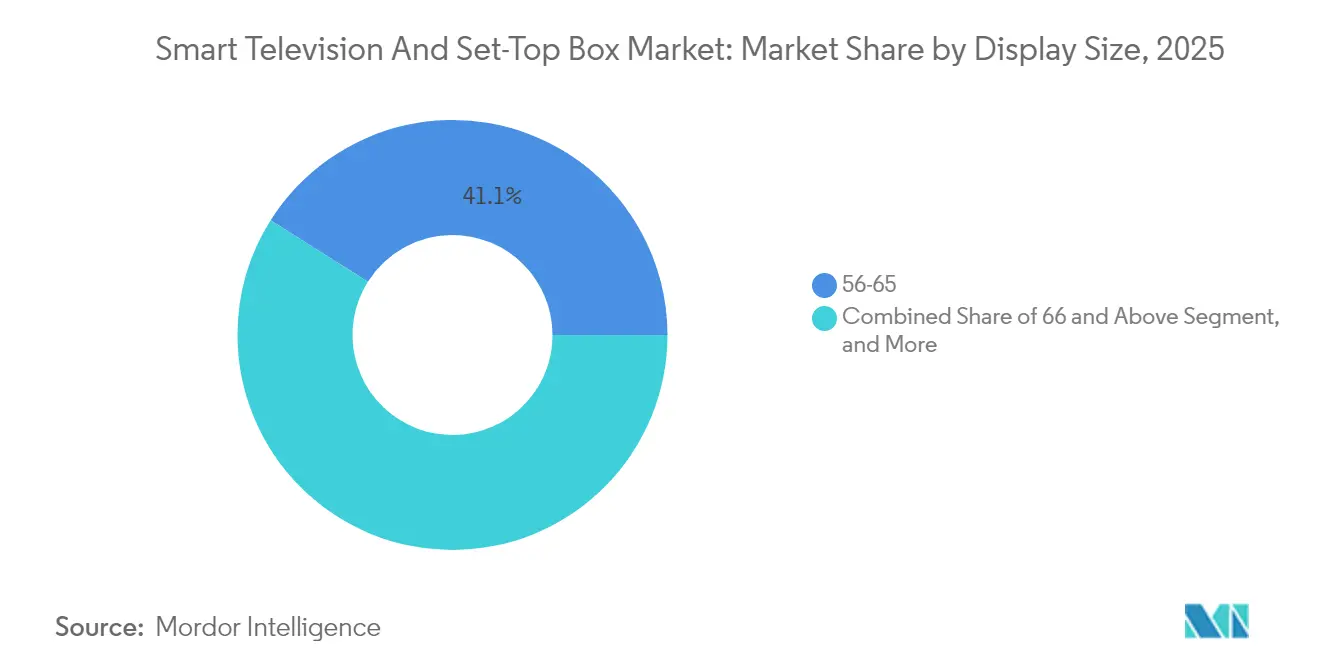
Sets measuring 55-65 inches controlled 41.05% of 2025 units, balancing living-room ergonomics with falling panel costs. Screens 66 inches and above, however, record the highest 3.55% CAGR, reflecting premium home-cinema builds and digital signage rollouts in hospitality and retail. The smart television and set-top box market size for 66-inch plus displays skews toward the United States, the Gulf Cooperation Council, and Japan, where disposable incomes support bigger footprints. Conversely, 32-inch and 33-43-inch models still cater to space-limited urban apartments in Asia and Latin America, sustaining steady replacement cycles.
Commercial buyers such as hotel chains prefer 43-55-inch sizes owing to furniture constraints and viewing distances yet are willing to pay for software like LG Pro:Centric that integrates property-management systems without external media players. The migration to larger glass substrates at Chinese fabs now positions 75-inch panels at price points previously occupied by 55-inch sets, nudging residential up-graders toward bigger diagonals.
By Display Technology: LED and LCD Retain Majority as Premium Tiers Diverge
LED and LCD panels captured 59.68% share in 2025 and remain cost leaders through 2031. OLED and QLED punch above their weight in revenue terms, benefiting from gamers and cinephiles who value wide colour gamut’s and near-perfect blacks. Mini-LED backlighting, featured in TCL’s QD-Mini LED and Samsung’s Neo QLED, offers mid-range pricing with superior contrast, giving retailers up-sell ammunition. The smart television and set-top box market size associated with Micro-LED is small but grows at 2.76% CAGR as Samsung and LG refine yields and shift toward chip-on-board assembly that lowers per-square-inch costs.
Panel makers invest in quantum-dot enhancement films and tandem OLED stacks to push peak brightness past 2,000 nits, supporting HDR10+ and Dolby Vision IQ. Competition increasingly revolves around picture processing, heat management, and power efficiency rather than base panel cost. Brands that own both panel fabrication and television assembly shorten time-to-market for new tech and capture higher margins even as overall ASPs drift down.
By Operating System and Platform: Advertising Economics Redefine Share
Android and Google TV occupied 23.85% of the OS landscape in 2025, benefiting from the Play Store and built-in Google Assistant. Roku TV OS, though smaller, shows a 3.09% CAGR as second-tier brands license the platform to tap Roku’s USD 3 billion-plus annual ad revenue. Samsung Tizen and LG webOS stay contained within company hardware, yet monetize through walled-garden storefronts. Competitive focus now shifts to dwell-time metrics, personalized recommendations, and data-privacy compliance.
Platform owners wield leverage over content placement fees and first-screen real estate, influencing consumer discovery and partner negotiations. The smart television and set-top box market size tied to OS royalties remains modest but attach-rate profits from advertising and subscription commissions outweigh hardware margins. Consequently, retailer-controlled platforms such as Walmart’s Vizio Platform+ will likely reshape bargaining power along the chain.
By Distribution Channel: Online Volume Climbs Amid Omnichannel Blends
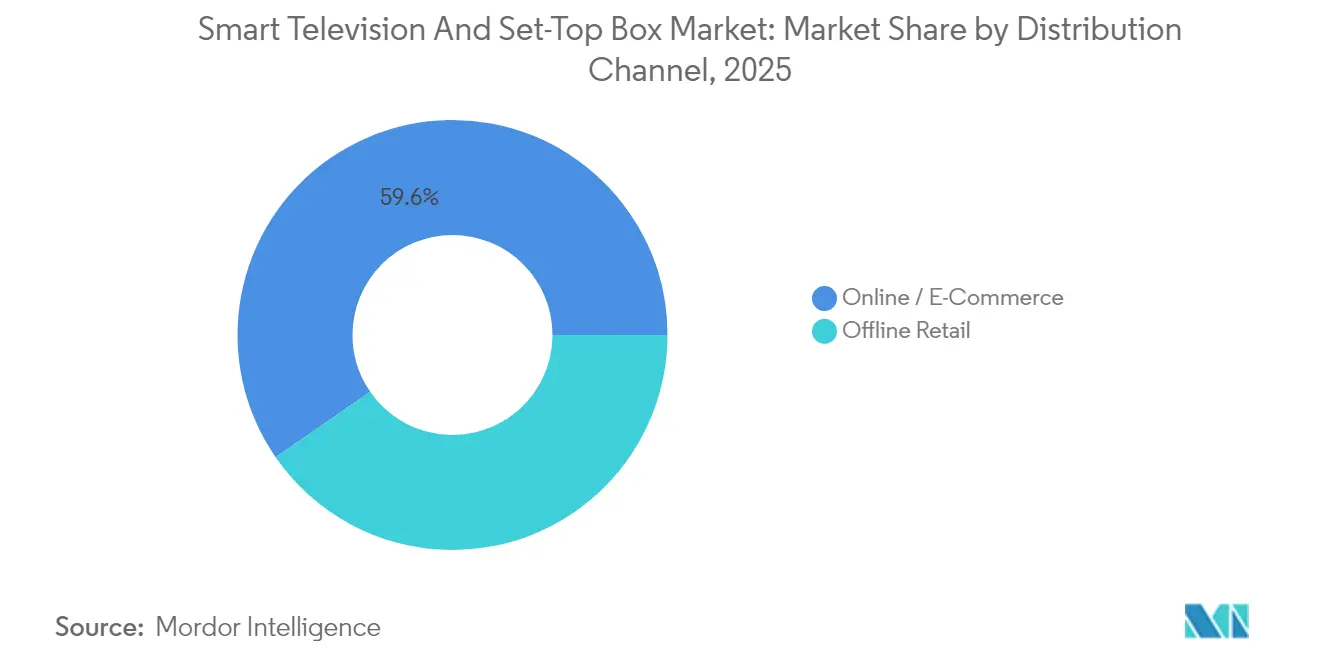
In 2025, e-commerce drove nearly 59.62% of unit sales in North America and Europe, bolstered by direct-to-consumer storefronts and rapid delivery options. This growth reflects changing consumer preferences for convenience, competitive pricing, and a wider range of product availability online. While brick-and-mortar stores play a crucial role in offering large-screen demonstrations, extended warranties, and installation services, they also serve as key touchpoints for building brand trust and providing personalized customer support.
Brands are increasingly embracing omnichannel strategies to bridge the gap between online and offline experiences. These strategies allow in-store experiences to highlight flagship sets, with the majority of inventory being dispatched from regional fulfillment centers to optimize supply chain efficiency and reduce delivery times. Although emerging regions depend heavily on dealers due to fragmented logistics, the rise of smartphone-driven digital payments is accelerating the shift towards online platforms. This transition is further supported by increasing internet penetration, growing smartphone adoption, and the expansion of digital infrastructure in these regions.
By End User: Residential Bulk Persists, Hospitality Growth Accelerates
In 2025, residential buyers accounted for a commanding 81.74% of the market volume. However, the commercial and hospitality sectors are witnessing the fastest growth, boasting a 2.84% CAGR. Hotels, prioritizing centralized control, tamper resistance, and casting features, typically refresh their displays every five to seven years to maintain a modern and functional environment for guests. Retailers are increasingly using high-brightness signage to attract foot traffic, enhance brand visibility, and improve customer engagement.
Meanwhile, healthcare facilities are integrating wall-mounted smart panels for telemedicine, enabling remote consultations, patient monitoring, and improved operational efficiency. Although the market size for smart televisions and set-top boxes driven by institutional orders is currently modest, it commands higher average selling prices (ASPs) and service contracts, significantly boosting lifetime revenue. These institutional orders often cater to specific requirements, such as customized software or hardware configurations, which further contribute to their higher value proposition.
Geography Analysis
Asia Pacific holds the largest regional share owing to concentrated manufacturing in China, South Korea, and Japan, and to rising disposable incomes in India and Southeast Asia. China sold more than 40 million smart TVs in 2024, with TCL, Hisense, and Xiaomi fighting on price and feature parity. India’s Production-Linked Incentive program lured investments from Dixon Technologies and Amber Enterprises to build domestic panel assembly, cutting import dependence and adding resilience against tariff shifts. Japan and South Korea dominate premium niches; Sony and Samsung leverage early 8K broadcast ecosystems and strong brand pull to push ASPs higher. Indonesia, Vietnam, and Thailand benefit from rapid broadband rollouts and government set-top subsidies that convert analog households to digital within three years.
North America and Europe represent mature territories shaped by replacement demand, premium segment upside, and an ongoing pivot from pay-TV bundles to à la carte streaming. Walmart’s USD 2.3 billion acquisition of Vizio in December 2024 underscores retailers’ bid to harness advertising revenue. The United States stands out for early adoption of 65-inch-plus screens and voice-assistant-heavy interfaces. Canada mirrors U.S. cord-cutting, while Mexico still enjoys STB subsidy support as its digital-terrestrial transition finalizes in 2026. Europe’s GDPR regime restricts automatic content recognition, curtailing data-monetization opportunities for OEMs, while ATSC-like DVB-T2 upgrades push 4K adoption. Germany, France, and the United Kingdom make up over 60% of European sales, favouring quality and after-sales support from Samsung, LG, and Sony over emerging brands.
South America, the Middle East, and Africa combine rapid digital-switch initiatives with growing middle-class consumption. Brazil booked double-digit smart TV growth in 2024, supported by e-commerce instalment plans from Mercado Livre, while Argentina’s macro headwinds stalled volume though deferred replacement demand builds into 2026. Gulf Cooperation Council countries gravitate toward 75-inch plus panels, delivering strong value pull for Samsung and LG. Turkey functions as a manufacturing hub feeding neighbouring states in North Africa. South Africa’s analog switch-off completed in March 2024, creating a one-time surge for low-cost DTT boxes, while Kenya and Nigeria progress toward 2027 deadlines with subsidy programs that favour Chinese ODM supply.

Regulatory Landscape
The EU's Cyber Resilience Act (Regulation (EU) 2024/2847) entered into force on 10 December 2024, imposing horizontal cybersecurity requirements for products with digital elements. Conformity-assessment body notification is scheduled from 11 June 2026 and incident reporting obligations begin on 11 September 2026, shaping secure-by-design firmware, OS update cadence, and vulnerability handling for smart televisions and streaming devices.
In the United Kingdom, the Internet Television Equipment Regulations 2024 under the Media Act driven prominence regime extend content-discovery governance, and the Television Selection Services (Designation) Regulations 2026 become enforceable from 1 July 2026 for 15 regulated services. Australia applies the ACMA TV prominence framework from 10 January 2026, requiring free-to-air apps to be pre-installed and visible, affecting home-screen real estate and data-handling workflows. India extended the deadline for IS 18112 revisions to 26 July 2026 under the 2021 Compulsory Registration Order.
Competitive Landscape
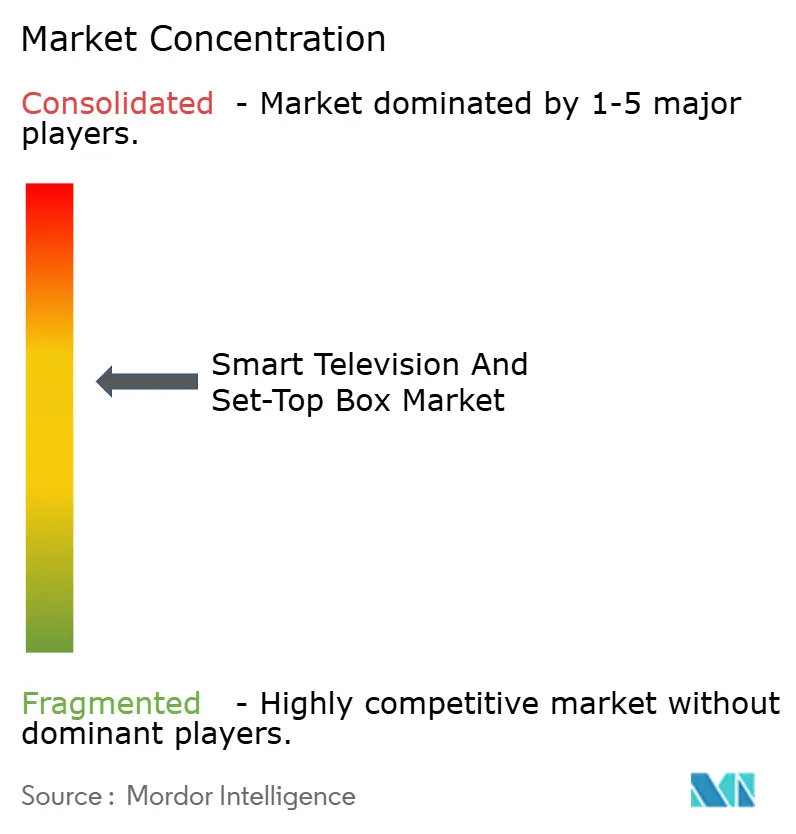
The market is moderately concentrated. The five leading brands Samsung, LG, TCL, Hisense, and Sony controlled about 55-60% of global shipments in 2024. Vertical integration drives Samsung and LG; they own panel fabs, design proprietary operating systems, and maintain large patent arsenals in AI video processing. Chinese challengers TCL and Hisense exploit cost leadership derived from domestic component ecosystems, shipping Mini-LED sets at price points 30% below South Korean peers. Sony, though smaller in volume, leverages cognitive imaging chips to command premium margins among cinephiles and gamers.
Retailer-owned entrants reshape competitive economics. Walmart folded Vizio’s Platform+ ad unit into Walmart Connect, giving the retailer a flywheel where advertising subsidizes panel costs and drives store traffic. Roku, while hardware-agnostic, secures TV-OS licensing deals that extend its platform revenue. Component suppliers like MediaTek and Realtek standardize SoC roadmaps around AV1 decoding and Wi-Fi 6E, letting second-tier assemblers keep pace with feature sets. Compliance challenges grow: GDPR and CCPA demand transparent data practices; vendors that implement granular consent flows avoid fines and win trust.
Technological trajectories center on Mini-LED refinement, quantum-dot colour purity, and Micro-LED mass transfer. Samsung and LG lead granted patents covering pixel architectures and low-temperature bonding. Supply-chain diversification sees panel capacity shift from China to Vietnam, India, and Mexico to hedge tariff and geopolitical risk, while EMS providers add value through software pre-loads and custom logistics. Across 2025-2030, sustained R&D in AI-based upscaling and energy-efficient backlights distinguishes feature-rich models from commoditized mass-market SKUs.
Smart Television And Set-Top Box Industry Leaders
Samsung Electronics Co. Ltd
LG Electronics Inc.
TCL Electronics Holdings Limited
Hisense Group
Xiaomi Corporation
- *Disclaimer: Major Players sorted in no particular order

Market Opportunities and Future Outlook
Hybrid delivery standards are enabling smart TVs and operator devices to unify broadcast and broadband experiences with cohesive service discovery. In Europe, the HbbTV 2.0.5 core specification was published in March 2026, adding baseline DRM support and stronger web security primitives, followed by Test Suite 2026-1 in April 2026 (3,439 test cases) covering Widevine DRM and CTA WAVE Media Source Extensions. In July 2026, the DVB Steering Board approved major DVB-I specification updates focusing on security, application signalling, and DVB-DASH integration, supporting product roadmaps for hybrid/OTT-capable set-top boxes and smart TVs.
Regulation-led compliance and feature differentiation open whitespace for vendors that industrialize certification, secure updates, and local-market UI requirements at scale. India extended the IS 18112 revisions deadline to 26 July 2026, while the UK and Australia prominence frameworks elevate OS-level controls over home-screen app placement and public-service discoverability. Market activity this year includes Samsung's 2026 AI TV lineup and Sony's May 2026 BRAVIA launches, illustrating continued software-driven differentiation and on-device AI alongside premium display upgrades.
Recent Industry Developments
- June 2026: LG Electronics launched its 2026 Micro RGB evo AI and Mini RGB evo AI TVs and tied the lineup to webOS 26 capabilities including integration of Google Gemini and Microsoft Copilot. This positions premium LCD lines around higher color purity and AI-assisted interaction, while also raising the importance of platform partnerships and software update cadence in the competitive stack.
- May 2026: Samsung announced the global rollout of its full 2026 AI TV lineup, extending Vision AI Companion features across 4K-and-above models. The move broadens AI-led differentiation beyond flagship tiers and increases the emphasis on integrated OS experiences and data-governed personalization as hardware price competition tightens.
- December 2024: Walmart completed its USD 2.3 billion acquisition of Vizio and moved to integrate Vizio's Platform+ advertising capabilities into Walmart Connect. The transaction deepens retailer influence over smart TV monetization by linking first-screen inventory with commerce media, putting additional pressure on OEMs and independent OS platforms to defend advertising and data economics.


Research Methodology Framework and Report Scope
Market Definition and Coverage
This market covers revenue from smart televisions and set-top boxes sold into end users, including device hardware that enables connected content viewing and upgrades in picture and audio performance.
Scope exclusions: We exclude stand-alone monitors, smartphones, and tablets, and we also exclude subscription revenue from streaming content services.
Segmentation Overview
- By Technology (Set-Top Box)
- Satellite / DTH
- IPTV
- Cable
- Hybrid / OTT
- By Resolution
- SD
- HD / FHD
- 4K UHD
- 8K and Higher
- By Display Size (in Inches)
- 32 and Below
- 33-43
- 44-55
- 56-65
- 66 and Above
- By Display Technology
- LCD / LED
- OLED
- QLED / Mini-LED
- Micro-LED
- By Operating System / Platform
- Android / Google TV
- Tizen
- webOS
- Roku TV OS
- Fire TV OS
- By Distribution Channel
- Offline Retail
- Online / E-Commerce
- By End User
- Residential
- Commercial / Hospitality
- Institutional
- By Geography
- North America
- United States
- Canada
- Mexico
- South America
- Brazil
- Argentina
- Europe
- Germany
- United Kingdom
- France
- Italy
- Spain
- Russia
- Asia Pacific
- China
- Japan
- India
- South Korea
- Southeast Asia
- Middle East
- Gulf Cooperation Council
- Turkey
- Africa
- South Africa
- North America
Data Sources, Market Sizing, and Validation
Desk Research
Desk work started with public demand and supply signals that are stable over time, and that can be checked across regions. We used sources such as ITU connectivity indicators, U.S. FCC updates on broadband and media device topics, Eurostat household ICT access series, UN Comtrade trade flows for relevant electronics categories, and IEA electricity and household appliance context data where it helps explain replacement cycles.
We also reviewed company annual reports, investor presentations, product launch notes, and reported shipment discussions in credible business press to understand price band shifts and channel movement. For specific company financial line items and for patent activity checks around display and chipset improvements, we used select paid database subscriptions where needed. The sources listed here are illustrative only, and we used additional public references to validate definitions, clean assumptions, and clarify data conflicts.
Primary Interviews and Surveys
Primary inputs came from interviews and structured surveys with device brands, component ecosystem participants, distribution and retail channel contacts, and pay-TV and broadband service stakeholders who influence set-top box demand. We covered APAC, EMEA, and the Americas so we could normalize regional price moves, promotions, and technology shifts (including 4K and OS adoption) before locking key assumptions.
Distribution of primary research fieldwork respondents
| Company type | Respondent position | Region |
|---|---|---|
| Top tier: 30% | CXOs: 22% | APAC: 50% |
| Mid tier: 48% | Functional/Unit leaders: 28% | EMEA: 32% |
| Smaller Players: 22% | Managers: 50% | Americas: 18% |
Market-Sizing & Forecasting
The core model uses a top-down and bottom-up mix. On the top-down side, we reconstruct addressable demand using connected household penetration, replacement cycles, and device mix shifts by screen size and resolution. Those demand pools are then translated into value using average selling price (ASP) bands that move with panel cost trends, promotions, and the share of premium technologies such as OLED and QLED or Mini-LED.
To keep totals realistic, we corroborated outputs with selective bottom-up approximations, such as sampled brand and region revenue rollups, channel checks on unit sell-through, and ASP x unit sanity checks across key screen-size ranges. Inputs that carried the most weight included the split of 4K and above units, the pace of operating system transitions, offline versus e-commerce mix, pay-TV subscriber direction (which impacts set-top box refresh), and import intensity for finished goods in major consuming regions. For forecasting, we ran scenario analysis around panel pricing cycles and replacement timing, then aligned the direction to expert consensus gathered in the primary calls so the trend line remains practical. Where bottom-up coverage was thin in smaller countries, gaps were handled through regional proxy ratios tied to household connectivity and historical device demand patterns.
Data Validation & Update Cycle
Validation used multiple checks so the final series does not depend on any single input. We compared model outputs against independent signals, including broad electronics trade movement, regional connectivity adoption, and observed price band changes, then investigated outliers at the country and technology level before sign-off.
Each report goes through stepwise analyst review, with targeted re-contacts triggered when variance appears around major events such as panel cost swings, large product cycle resets, or sharp channel inventory moves. Reports refresh annually, with interim updates when material market events shift pricing or demand meaningfully. Before delivery, we do a final pass to ensure the latest public releases and expert feedback are reflected in the numbers.
Mordor Intelligence's Smart Television and Set Top Box Market Estimate Compared With Other Published Estimates
Published market numbers for smart televisions and set-top boxes can appear far apart, even when the same wording is used in the title. In most cases, the gap comes down to what is counted as part of the market, how ASPs are carried forward, and which year and currency timing are used for conversion.
In this study, the refresh cadence for price assumptions is treated as a first-order driver, and USD conversion timing is kept consistent across regions before totals are rolled up, a step applied by Mordor Intelligence. Other figures often expand scope by blending adjacent categories, or they rely on a single-year shipment view without re-validating the price mix shift tied to larger screen sizes and premium display technologies.
Benchmark comparison
| Source | Market Size | Gaps in Research Methodology |
|---|---|---|
| Mordor Intelligence | USD 327.22 B (2025) | |
| Industry Association A | USD 25.33 B (2024) | This estimate is scoped to set-top boxes only and does not capture smart TV hardware value, so it will read structurally smaller than a combined device market. |
| Trade Journal B | USD 22.10 B (2023) | The figure reflects a set-top box market view with a different base year and a narrower product boundary, and it does not reflect the broader ASP mix effects seen in smart TV upgrades. |
The spread is explained mostly by scope and by how quickly prices and mix are refreshed in the model. When smart TVs are included and ASPs are updated to reflect screen-size upgrades and premium technology share, the combined market total shifts to a different scale. Using clear inclusion rules and repeatable checks makes the final number easier to trace back to real demand and pricing signals.


Key Questions Answered in the Report
How large is the smart television and set-top box market in 2026?
The smart television and set-top box market size stands at USD 334.82 billion in 2026 and is projected to reach USD 375.74 billion by 2031.
Which resolution dominates new television shipments?
4K UHD leads with 45.02% of 2025 shipments, driven by falling panel costs and abundant streaming content.
What growth outlook exists for 8K televisions?
The 8K segment is forecast to expand at a 3.05% CAGR through 2031 as Japan and South Korea broadcast native 8K sports and entertainment.
Why are hybrid and OTT set-top boxes gaining share?
Pay-TV operators deploy Android-based hybrid boxes that merge linear channels with streaming apps, helping them retain subscribers migrating to on-demand viewing.
Which operating systems show the fastest expansion?
Roku TV OS is projected to grow at a 3.09% CAGR through 2031, buoyed by licensing deals with second-tier brands and strong advertising revenue.
How are privacy regulations influencing vendor strategy?
Laws such as GDPR and CCPA restrict automatic content recognition, so manufacturers increasingly disclose data practices, add opt-out options, and seek alternative revenue streams beyond viewer analytics.
Page last updated on:






