
Smart Pole Market Size and Share
Market Overview
| Study Period | 2020 - 2031 |
|---|---|
| Market Size (2026) | USD 28.86 Billion |
| Market Size (2031) | USD 71.65 Billion |
| Growth Rate (2026 - 2031) | 19.95 % |
| Fastest Growing Market | Asia Pacific |
| Largest Market | North America |
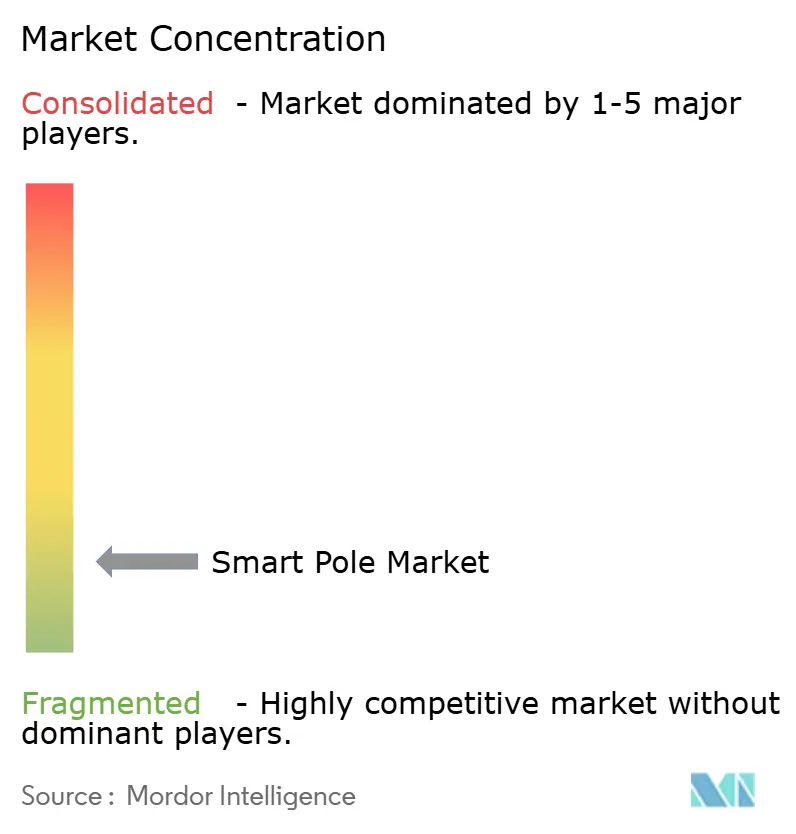
| Market Concentration | Low |
Major Players *Disclaimer: Major Players sorted in no particular order Image © Mordor Intelligence. Reuse requires attribution under CC BY 4.0. | |
Smart Pole Market Analysis by Mordor Intelligence
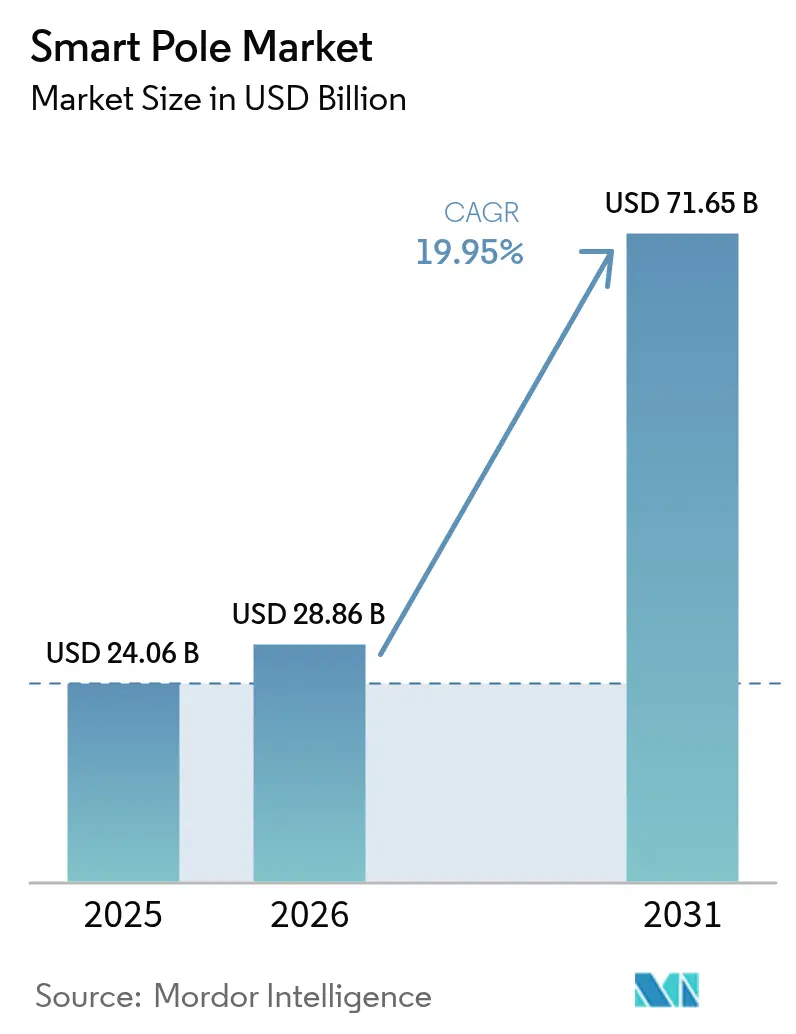
The Smart Pole market size is expected to grow from USD 24.06 billion in 2025 to USD 28.86 billion in 2026 and is forecast to reach USD 71.65 billion by 2031 at 19.95% CAGR over 2026-2031.
This sustained rise reflects how 5G densification requirements, LED-retrofit mandates, and nationwide smart-city programmes have turned connected street furniture into essential digital infrastructure. Cities now view smart poles as revenue-positive assets. San Diego’s 500 smart streetlights aided 229 criminal cases and 166 arrests in 2024, underscoring clear socio-economic returns. Backed by policy pressure, China’s housing ministry issued 2024 rules that compel interoperable pole deployments, while the EU and India channel dedicated capital through Horizon 2020 and the Smart Cities Mission to speed adoption. Cellular co-location drives 46% of deployments because operators can mount 5G small cells on existing poles, trimming both time and zoning hurdles. Hardware remains the largest spending line, yet software platforms are rapidly scaling as municipalities monetise pole-generated data.
Key Report Takeaways
- By offering, hardware held 67.20% of the smart pole market share in 2025, while software is projected to register a 21.8% CAGR to 2031.
- By installation type, new deployments dominated with 56.30% revenue in 2025; retrofit installs are poised for a 20.1% CAGR through 2031.
- By connectivity technology, cellular networks accounted for 45.60% of the smart pole market size in 2025 and are set to expand at a 23.4% CAGR.
- By application, highways and roadways captured 51.30% of the smart pole market size in 2025; parking lots and campuses represent the fastest-growing niche at a 22.7% CAGR.
- By material, steel and aluminium structures led with 48.60% revenue in 2025, whereas composite poles are on course for a 20.6% CAGR thanks to lightweight corrosion-resistant designs.
- By geography, North America commanded 35.10% of the smart pole market in 2025; Asia Pacific is advancing at a 23.6% CAGR through 2031.
Note: Market size and forecast figures in this report are generated using Mordor Intelligence’s proprietary estimation framework, updated with the latest available data and insights as of 2026.
Market Trends and Insights
Drivers Impact Analysis of Smart Pole Market*
| Driver | (~) % Impact on CAGR Forecast | Geographic Relevance | Impact Timeline |
|---|---|---|---|
| Government smart-city mandates | +6.2% | Global, with concentration in China, EU, India | Medium term (2-4 years) |
| LED-retrofit energy-savings push | +4.8% | North America & EU, expanding to APAC | Short term (≤ 2 years) |
| 5G / small-cell co-location demand | +5.1% | Global, led by developed markets | Medium term (2-4 years) |
| Falling IoT-sensor costs | +2.9% | Global | Short term (≤ 2 years) |
| Ad-revenue and data-monetisation PPPs | +1.8% | North America, EU pilot markets | Long term (≥ 4 years) |
| ESG-linked muni-bond funding | +2.3% | Global, concentrated in developed markets | Medium term (2-4 years) |
| Source: Mordor Intelligence | |||
Government Smart-City Mandates
Nation-level programmes anchor the smart pole market because municipalities must modernise lighting grids to meet climate neutrality, safety, and data-governance targets. The European Commission’s Cities Mission calls for 100 climate-neutral cities by 2030 and prescribes integrated digital infrastructure, including multi-service poles. In China, May 2024 guidance from the National Development and Reform Commission obliges city planners to fold smart poles into unified data platforms, accelerating standardised procurement. Chicago’s smart-lighting programme reports USD 10 million annual energy savings while enhancing crime monitoring through pole-mounted sensors. Such directives foster predictable procurement cycles that permit volume manufacturing and lower per-unit costs.
LED-Retrofit Energy-Savings Push
LED retrofits deliver 50-60% energy savings compared with high-pressure sodium lamps, giving cities an immediate fiscal incentive to adopt smart poles. Parramatta’s USD 5.55 million LED rollout swapped 4,500 luminaires, cutting energy bills and adding adaptive dimming. The U.S. Department of Energy notes that utility financing and energy-service contracts can cover upfront costs, unlocking adoption by budget-strapped towns. Incremental retrofits also avoid wholesale street works, allowing phased integration of sensors and connectivity modules across existing assets. As jurisdictions publicise cost-avoidance metrics, they create peer pressure that keeps the smart pole market on a rapid adoption curve.
5G Small-Cell Co-Location Demand
Mobile operators need dense, low-height sites to meet 5G coverage and capacity targets, and smart poles offer power, backhaul, and approved right-of-way in one bundle. Virgin Media O2’s UK tests showed that poles with integrated 4G/5G small cells can be installed without extra planning permission, halving deployment time[1]. Cornerstone’s alliance with Signify extends the model nationwide, enabling multi-operator neutral hosts that lighten capital burdens for individual carriers. This revenue-sharing opportunity turns street lighting from a municipal cost into an income stream, accelerating private investment and fuelling the smart pole market.
Falling IoT-Sensor Costs
With cellular IoT modules tracking a 16% CAGR through 2027, environmental, traffic, and security sensors drop into double-digit dollar pricing. Platforms like Interact City harness real-time data to trim lighting energy use by up to 80% via adaptive algorithms. Edge processors embedded in poles perform analytics locally, slashing backhaul and cloud costs while improving emergency response latency. As the bill-of-materials shrinks, even mid-sized municipalities find comprehensive sensor suites financially tenable, broadening the addressable smart pole market.
Restraints Impact Analysis of Smart Pole Market*
| Restraint | (~) % Impact on CAGR Forecast | Geographic Relevance | Impact Timeline |
|---|---|---|---|
| High upfront capex and ROI risk | -3.4% | Global, acute in developing markets | Short term (≤ 2 years) |
| Interoperability gaps in protocols | -2.1% | Global | Medium term (2-4 years) |
| Urban-aesthetic zoning limits | -1.6% | Developed markets, historic districts | Long term (≥ 4 years) |
| Cyber-physical insurance premiums | -1.9% | Global, concentrated in critical infrastructure | Medium term (2-4 years) |
| Source: Mordor Intelligence | |||
High Upfront Capex and ROI Risk
Municipal budgets rarely stretch to multi-million-dollar lighting upgrades without clear payback. In upstate New York, utilities require USD 5 million liability cover for smart streetlight pilots, inflating overall project cost[2]. Wal-Mart’s car-park case study shows a 7.5-year payback when replacing 1,000 W metal halide fittings with LEDs, far longer than most city budget cycles. Public-private partnerships such as value-capture funding, showcased by Vijayawada’s Golden Mile, redistribute risk to concessionaires, yet smaller cities often lack the legal capacity to structure similar deals, muting near-term demand.
Interoperability Gaps in Protocols
Smart poles straddle lighting, telecom, transport, and public-safety systems, yet vendor protocols remain siloed. IEEE standards like P2413 and 2030.5 outline common architectures, but adoption is patchy, forcing integrators to support multiple stacks. The open OCPP model in EV charging illustrates a workable path to unification, but replicating it for smart poles requires coordinated municipal procurement and vendor commitment. Small suppliers struggle to maintain multi-standard firmware, raising integration bills and elongating project schedules, which slows smart pole market rollouts in the medium term.
*Our forecasts treat driver/restraint impacts as directional, not additive. The impact forecasts reflect baseline growth, mix effects, and variable interactions.
Smart Pole Market Segment Analysis
By Offering:
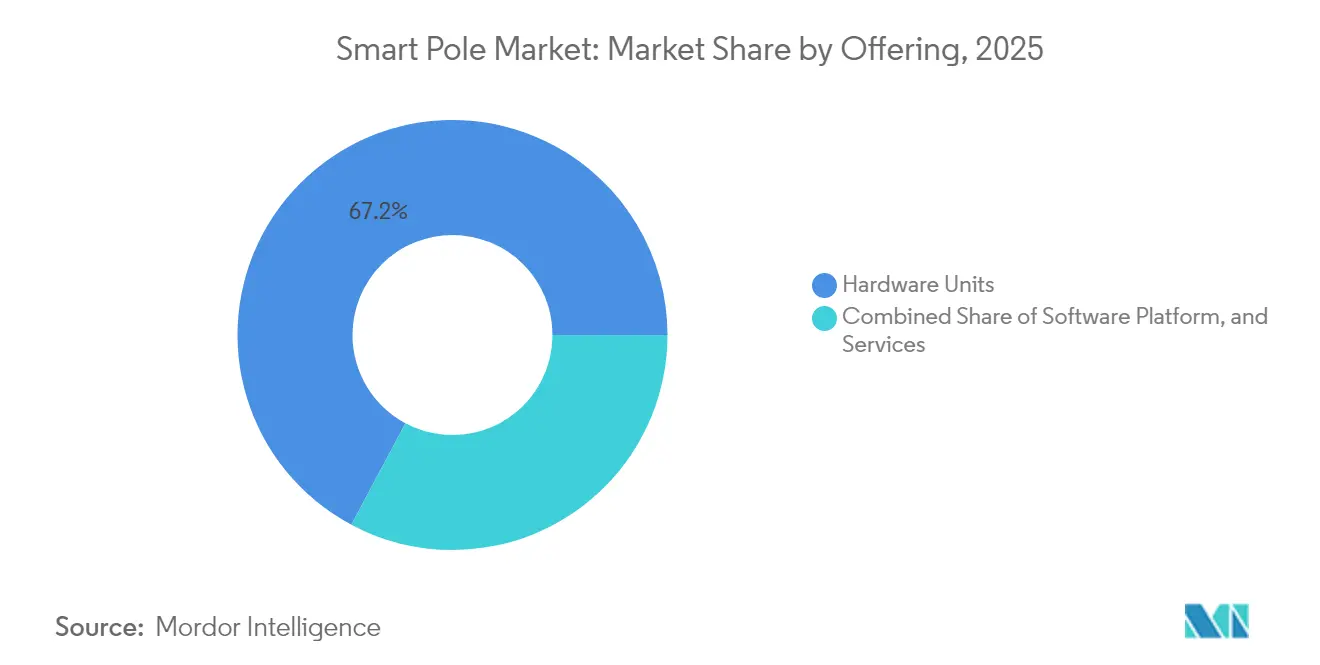
Hardware Outlays Lead, Software Value RisesHardware purchases amounted to 67.20% of the smart pole market in 2025 as poles, luminaires, sensors, and communications gear demand significant upfront capital. Software, though presently a smaller line-item, is compounding at 21.8% annually, signalling a pivot from asset delivery to data services. Signify converts 93% of its EUR 6.1 billion lighting sales into LED units, demonstrating how economies of scale reduce capital costs for municipalities.
Firms now position cloud dashboards, API gateways, and AI-driven analytics as core value streams. Wide-area device management cuts truck rolls, while predictive maintenance extends asset life, improving total-life economics. Consequently, recurring licence and support fees are beginning to rival hardware margins, a progression that underpins long-run growth for the smart pole market.

By Installation Type:
New Builds Dominate but Retrofits AccelerateNew installations comprised 56.30% of 2025 revenue because green-field smart-city districts favour custom-engineered poles with embedded radios, CCTV, and EV chargers. Retrofit programmes, however, should log a 20.1% CAGR through 2031, outpacing new builds, as cities swap sodium lamps for LED heads plus plug-in sensor modules. Chicago upgraded 270,000 lights to LED while adding remote-control nodes, cutting energy use, and enabling crime analytics.
Retrofits exploit existing power feeds and foundations, trimming civil works costs by as much as 30%. Payback windows can narrow to 4–5 years, suiting municipal budgeting cycles and supporting distributed rollouts. The pattern broadens geographic access, reinforcing demand diversity within the smart pole market.
By Connectivity Technology:
Cellular Takes the LeadCellular links 4G, 5G, and NB-IoT, held 45.60% of 2025 revenue, expanding at a 23.4% CAGR as carriers push network densification without erecting new towers. American Tower’s 220,000-site global estate allows operators to piggyback on street poles in crowded urban cores. Robust licensed-spectrum reliability also suits safety-critical traffic-management and emergency-response apps.
Wi-Fi, Zigbee, and Bluetooth address localised, low-data tasks, while fibre or power-line links serve high-bandwidth video surveillance. Hybrid architectures are therefore normal, yet cellular remains the backbone, cementing its primary status in the smart pole market.
By Application:
Highways Remain the Volume AnchorHighways absorbed 51.30% of the smart pole market size in 2025 because kilometre-scale corridors need uniform illumination and traffic sensing. Wyoming’s I-80 saw 42% collision reductions after adding connected alerts, validating the safety dividend. Parking lots and campuses show the fastest growth at 22.7% CAGR as asset owners seek precise ROI; Walmart’s LED trial cut lighting energy by 63% while boosting perceived safety.
Public plazas, railheads, and harbours add incremental volume, particularly where smart poles double as signage, Wi-Fi hotspots, and charging points. Diversifying use cases fuels steady contribution from multiple sub-sectors, keeping demand resilient across cycles for the smart pole industry.
By Material:
Steel Prevails, Composites EmergeSteel and aluminium still account for 48.60% of 2025 shipments due to mature supply chains and favourable price-performance. Yet steel traded at USD 1.60 per pound in 2024, spurring interest in lighter composites that promise 42% cost savings over a 20-year life, owing to corrosion resistance. Covestro’s polycarbonate resins integrate cable-ducts and thermal channels, enabling slimmer profiles and easier 5G radio placement.
Composites are forecast to post a 20.6% CAGR as buyers prioritise life-cycle economics and simplified transport logistics. The resulting mix shift lowers pole weight, widens design freedom, and expands addressable sites, reinforcing long-run upside across the smart pole market.
Geography Analysis
North America Smart Pole Market
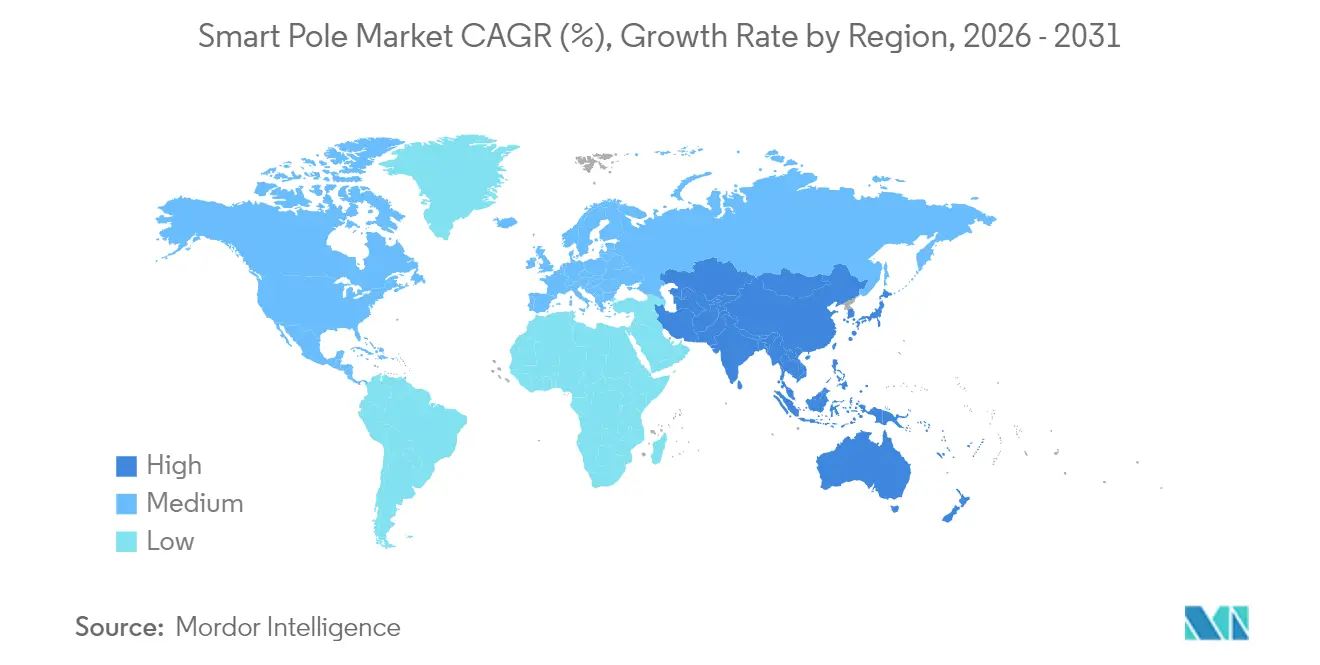
North America commanded 35.10% of 2025 revenue, underpinned by large-scale LED retrofits and utility financing. The New York Power Authority’s plan to network 500,000 streetlights with Signify’s Interact platform highlights project scale and replicability. Robust municipal bond markets facilitate capital access, while broadband carriers harness smart poles to fill suburban 5G gaps, keeping order pipelines steady.
APAC Smart Pole Market
Asia Pacific is the quickest-growing arena, rising at 23.6% CAGR to 2031. China issued national guidelines urging “vehicle-road-cloud” integration, mandating sensorized roadside units that dovetail with multipurpose poles. India’s Smart Cities Mission budgeted INR 11.21 lakh crore (USD 1.35 billion) for 2025-26, of which 90% of 8,000 projects were completed by mid-2024, creating ready-made demand funnels.
Europe Smart Pole Market
Europe maintains consistent expansion owing to the EU’s Digital Europe and Horizon 2020 funds. The bloc allocated EUR 1.4 billion to smart-infrastructure pilots in 134 cities, providing de-risked capital pools. Cornerstone’s partnership with Signify to mount neutral-host 5G radios on street lighting demonstrates how infrastructure sharing cuts operator opex, keeping deal flow healthy despite macro headwinds.
Regulatory Landscape
Smart pole deployments are increasingly shaped by formal standards and utility-grade safety rules that cover structural design, electrical interconnection, and digital interoperability. China implemented GB/T 44408-2024 in 2024 to define functional requirements for intelligent multi-function pole systems across urban road, park, and community scenarios, and in March 2026 the State Administration for Market Regulation registered a national standardization project (20260939-T-469) focused on smart multi-function pole construction and management, indicating continued codification of design and operational expectations.
Outside China, regulators and standards bodies are tightening compliance frameworks that affect procurement and permitting. In April 2026, the Puerto Rico Energy Bureau published a draft regulation for municipal participation in public street lighting connected to the grid, explicitly covering smart public street lighting systems and referencing compliance with established electrical and safety standards (NEC, NESC, IEEE, ANSI). Australia added procurement guidance through SA TS 5386:2024 and the Australian Local Government Association Multi-Function Pole Best Practice Guide (August 2025), while city-level rules such as the City of Calgary Macro Street Light Pole Guidelines (updated April 2024) add process anchors, including advance notification and electrical load reconfirmation before construction.
Value Chain Analysis
The smart pole value chain starts with raw materials and structural fabrication (steel/aluminum or composites), followed by pole engineering, galvanizing/coatings, and integration of luminaire heads, cabinets, and mounting interfaces designed for wind-load and roadside safety compliance. The next layer is electronics and connectivity, spanning radios (4G/5G small cells where permitted), gateways, edge compute, sensors (CCTV, environmental, traffic), and power distribution components that manage multiple loads on a single asset. Standards and codes increasingly shape upstream specifications, including China’s GB/T 44408-2024 functional requirements and group standards such as T/CASMES 344-2024 for urban-road construction practices.
Downstream, systems integrators and neutral-host or telecom partners coordinate permitting, utility interconnection, and commissioning, then hand over to operations teams running network management, security, and lighting-control software. Recurring value concentrates in software platforms (central management, device health monitoring, analytics) and field services (maintenance, upgrades, cybersecurity hardening), while municipalities and infrastructure owners structure commercial models around co-location and multi-tenant usage. In the United States, small-cell and right-of-way attachment processes influence deployment flow; for example, the FCC issued Order 25-38 in 2025 to streamline pole attachment procedures and timelines, which affects how quickly smart-pole-mounted radios and associated make-ready work can move from design to installation.
Competitive Landscape
The vendor base is moderately fragmented; no single supplier holds a double-digit global revenue share. Lighting majors like Signify marry hardware, cloud software, and lifecycle services to offer turnkey propositions that simplify municipal procurement. The firm crossed 153 million connected light points in Q1 2025, up from 144 million the prior year, indicating strong platform stickiness.
Telecom-tower giants such as American Tower diversify into street-level assets, bundling real-estate expertise with small-cell integration support. Their developed-markets focus syncs with pole densification hotspots, reinforcing revenue resilience. Infrastructure specialists like Valmont supply engineered poles plus construction services; the company logged USD 3 billion infrastructure sales in 2024 and targets USD 4.2 billion in 2025[4].
Value migration is shifting toward data analytics, drawing software-native entrants that license AI-driven optimisation modules across multi-vendor fleets. Open standards advocacy by IEEE and industry alliances aims to reduce lock-in, a trend likely to heighten competition on services rather than physical bill-of-materials economics. Consolidation through M&A and strategic alliances is expected as vendors race to deliver holistic solutions for the expanding smart pole market.
Smart Pole Industry Leaders
-
Iram Technologies Pvt. Ltd.
-
Signify Holding B.V.
-
Efftronics Systems Pvt. Ltd.
-
Shanghai Sansi Electronic Engineering Co., Ltd.
-
Lumca Inc.
- *Disclaimer: Major Players sorted in no particular order
Smart Pole Market Companies Covered in this Report
- Signify Holding NV
- Valmont Industries Inc.
- Iram Technologies Pvt Ltd
- Indus Towers Ltd
- Lumca Inc.
- Efftronics Systems Pvt Ltd
- Shanghai Sansi Electronic Engg.
- SmartCiti Solutions Inc.
- American Tower Corp.
- ENE.HUB Pty Ltd
- Cisco Systems Inc.
- Telensa Ltd
- CU Phosco Lighting
- Keselec Lighting Pvt Ltd
- LEDbow Technologies Ltd
- Norsk Hydro ASA
- Streetscape International
- Omniflow SA
- Ericsson AB
- Nokia Corp.
- HUB Group
Market Opportunities and Future Outlook
Standardization and platformization are opening whitespace for multi-vendor deployments where cities want faster procurement and clearer compliance pathways. ISO/TR 19482:2026 (published February 25, 2026) provides a framework for Smart Streetlighting Management Platforms, reinforcing demand for interoperable software layers that can unify lighting control with add-on applications such as traffic and weather adaptive lighting, public safety sensing, and asset health monitoring. At the same time, regulations that explicitly recognize smart public street lighting systems, such as the Puerto Rico Energy Bureau draft released April 2, 2026, are pushing projects toward utility-grade electrical and safety compliance, supporting suppliers that can package certified hardware with documented installation and operational procedures.
Named public programs and city deployments also point to near-term entry points beyond flagship smart-city districts, particularly in neighborhood safety and 5G-enabled infrastructure. In Seoul, district-level installations in 2026, including Guro-gu (36 smart poles under the Ministry of Science and ICT Smart Village Development Project) and Gwanak-gu deployments under the Safety Streetlight Plus Support Program, highlight a repeatable model where smart poles are procured as part of public safety and community connectivity upgrades. On the commercial side, municipal and neutral-host models that combine street lighting with multi-operator wireless connectivity are becoming more tangible through partnerships, such as Signify’s work with Cornerstone and Dense Air to use street lighting as a platform for multi-operator wireless networks (announced April 2025), supporting opportunities for vendors that can integrate lighting, connectivity, and operations software into a single managed asset.
Recent Industry Developments in Smart Pole Market
- March 2026: Signify introduced next-generation additions to its Interact portfolio, including EasyConnect hybrid or cellular outdoor light management, a Central Management System for outdoor lighting networks, and traffic and weather adaptive lighting capabilities. The releases reinforce the shift from smart poles as primarily hardware installations to software-led systems that standardize operations across large outdoor estates. For municipalities and integrators, expanded remote management and adaptive-control features strengthen the business case for scaling multi-service pole networks with lower field-maintenance overhead.
- December 2025: Efftronics Systems marked its 40th anniversary with expanded visibility for its large-scale digital infrastructure footprint, including reported deployments of Data Logger Signalling Systems across more than 7,000 railway stations. The scale of installed monitoring and control assets underlines the company’s capability base that can be leveraged for smart-city and smart-pole-adjacent command-and-control requirements. It also points to cross-domain integration potential where public infrastructure operators seek unified device health and telemetry management.
- December 2024: Valmont unveiled rapid-install 5G poles in the UK using screw-pile foundations designed to reduce on-site disruption compared with traditional civil works. Faster foundation approaches shorten installation windows, which helps align smart pole deployments with constrained urban work permits and environmental constraints. The move supports broader adoption of small-cell-ready street furniture where time-to-install and minimally invasive construction are key procurement criteria.
Smart Pole Market Report Scope and Research Methodology
Market Definition and Coverage
For this study, the smart pole market covers revenue generated from connected poles installed in public infrastructure that combine lighting with communication, sensing, and other smart-city functions that are managed remotely.
Scope exclusions: The sizing does not count conventional, non-connected poles and luminaires that have no remote controls or embedded connectivity.
Segments Covered in This Report
- By Offering
- Hardware Units
- Software Platform
- Services
- By Installation Type
- New Installation
- Retrofit
- By Connectivity Technology
- Wired (PLC, Fiber)
- Wireless (Wi-Fi, BLE, Zigbee)
- Cellular (4G/LTE, 5G, NB-IoT)
- By Application
- Highways and Roadways
- Public Places and Plazas
- Railways and Harbors
- Parking Lots and Campuses
- By Material
- Steel/Aluminum
- Composite and CFRP
- Concrete
- By Region
- North America
- United States
- Canada
- Mexico
- South America
- Argentina
- Brazil
- Rest of South America
- Europe
- United Kingdom
- Germany
- France
- Rest of Europe
- Asia-Pacific
- China
- Japan
- India
- Rest of Asia-Pacific
- Middle East and Africa
- Saudi Arabia
- United Arab Emirates
- South Africa
- Rest of Middle East and Africa
- North America
Data Sources, Market Sizing, and Validation
Desk Research
Desk work was used to build the first set of assumptions and anchor the model to public infrastructure activity. We referred to sources such as US Department of Transportation publications, US Census Bureau construction and public spending tables, Eurostat municipal and energy statistics, International Energy Agency lighting and electricity indicators, and International Telecommunication Union connectivity indicators to frame the demand pool.
To keep the dataset usable, we also reviewed company annual reports, investor presentations, project press releases, and city or utility tender portals to understand typical use cases and how deployments are packaged. Where needed, we used paid subscriptions covering company financials and a global contracts and tenders feed to cross-check project timing and vendor exposure. These examples are not exhaustive, and many other public and financial sources were used for data collection, validation, and clarification.
Primary Interviews and Surveys
Primary calls and structured surveys were used to pressure-test what we saw in public documents, especially around what a smart pole bundle usually includes and how pricing changes by application. We spoke with a mix of pole and lighting suppliers, system integrators, connectivity and sensor ecosystem participants, and public-sector buyers across APAC, EMEA, and the Americas, so assumptions could be challenged and then aligned.
Distribution of primary research fieldwork respondents
| Company type | Respondent position | Region |
|---|---|---|
| Top tier: 38% | CXOs: 21% | APAC: 43% |
| Mid tier: 41% | Functional/Unit leaders: 26% | EMEA: 30% |
| Smaller Players: 21% | Managers: 53% | Americas: 27% |
Market-Sizing & Forecasting
Market sizing was built by starting with a top-down demand pool view, where public lighting and smart-city deployment indicators were reconstructed by region and then filtered through smart pole adoption rates and typical configuration mix. To keep the results realistic, we corroborated them with selective bottom-up checks using sampled project pricing, pole shipment signals where available, and channel conversations on common order sizes.
Inputs that shaped the model included smart-city capex direction, municipal lighting modernization activity, 4G and 5G densification needs for street furniture, typical poles-per-kilometer in targeted corridors, and the share of retrofits versus new installations. Average selling price logic was handled at the bundle level, where the pole structure, lighting, connectivity module, and add-on devices were separated and then recombined based on the application mix. When data gaps appeared, we used conservative ranges and then narrowed them after re-checking with interview feedback.
For forecasting, scenario analysis was used because deployment speed changes with city budgets and permitting cycles. The forward path was then aligned to expert expectations on rollout timing, pricing normalization for modules, and regional procurement pipelines, before final totals were locked.
Data Validation & Update Cycle
Outputs were validated through cross-checks that compare model totals with independent signals such as public project counts, regional infrastructure budgets, and observed price bands for common configurations. Large variances were flagged, then reviewed step-by-step, including revisiting adoption rates, bundle assumptions, and currency conversion timing.
Before sign-off, another analyst reviews the work to confirm calculations, the logic flow, and whether assumptions can be explained on a client call. The report is refreshed annually, and interim updates are triggered when material events occur, such as major policy shifts, unusually large public tenders, or abrupt component price moves. Right before delivery, a final pass is done so the numbers reflect the latest available information.
Mordor Intelligence's Smart Pole Market Size Versus Other Published Estimates
Published market sizes for smart poles can look far apart because the product is often bundled, and different studies decide differently on what qualifies as a smart pole versus adjacent smart street lighting or city connectivity hardware. Variations also come from base year selection, currency timing, and whether the estimate reflects awarded projects only or also includes planned deployments.
The biggest gap drivers we see are scope cuts around bundled modules (lighting, pole structure, communications, sensors, and services), the treatment of retrofit installations versus full corridor upgrades, and how adoption rates are applied across public places versus highways and roadways. Some publishers also apply a single average price across regions, which can overstate value where deployments are more basic, and understate it where poles carry heavier device loads and higher installation labor.
Benchmark comparison
| Source | Market Size | Gaps in Research Methodology |
|---|---|---|
| Mordor Intelligence | USD 28.86 B (2026) | |
| Global Consultancy A | USD 6.07 B (2025) | Uses a narrower value base tied closely to component-led definitions, and the starting year and historical window differ, which can exclude bundled installation and service value that is often contracted with the pole. |
| Industry Publisher B | USD 13.51 B (2025) | Uses a different base year and a broader regional price approach, which can shift totals when retrofit-heavy programs and application mix (public places versus corridors) are not split with distinct adoption and ASP assumptions. |
The spread across the table is mainly explained by how the bundle is counted, the year being measured, and how quickly deployment assumptions are carried into value. When the model separates hardware, software, and services and only counts the full smart pole bundle at the point of deployment, the 2026 figure lands higher for Mordor Intelligence.
Key Questions Answered in the Report
What is the current value of the smart pole market?
The smart pole market is valued at USD 28.86 billion in 2026 and is projected to reach USD 71.65 billion by 2031.
Which segment is growing the fastest?
Software platforms show the highest momentum with a 21.8% CAGR through 2031 as cities monetise data from connected poles.
Why are cellular networks central to smart pole adoption?
Cellular connectivity enables 5G small-cell co-location, providing carriers with rapid and cost-effective densification while offering municipalities an extra revenue stream.
Which region will expand the quickest by 2031?
Asia Pacific is forecast to post a 23.6% CAGR, propelled by China’s national digital-infrastructure mandates and India’s Smart Cities Mission.
What is the chief barrier to deployment?
High upfront capital expenditure and long payback periods deter budget-constrained municipalities, particularly in developing markets.
How do smart poles aid public safety?
Integrated cameras and sensors feed real-time data to law-enforcement systems, with San Diego reporting 229 criminal cases supported by its smart lighting network in 2024.